
Remember me
EIT is a non-invasive imaging technique that dynamically visualizes the distribution of air in the lungs, as measured by electrodes (either individually placed or as part of an electrode belt) around the thorax. Small currents are injected over pairs of electrodes and resultant voltage changes are measured over the other receiving electrodes. EIT is gaining popularity worldwide as an advanced and real-time bedside technique that provides support to the clinician by monitoring changes in ventilation distribution and lung aeration in response to mechanical ventilation strategies, therapeutic procedures, or owing to clinical evolution (Barber and Brown 1984, Frerichs et al 2017, Tomicic and Cornejo 2019).
The measured impedance variations are mainly a result of variation in air content due to ventilation. However, since the heart and major blood vessels are positioned within the same electrode plain, the measured impedance changes are also affected by changes in blood volume within the thorax. Cardiac or perfusion-related impedance changes are generally one order of magnitude smaller than ventilation-related impedance changes, significantly affecting the measured signal (Graf and Riedel 2017). In most clinical uses of EIT, the impedance changes induced by ventilation are the main feature of interest, and therefore, the cardiovascular impedance changes are often removed from the signal. A commonly used method is low-pass filtering, thereby removing the higher frequency cardiovascular impedance changes. This is also often applied during real-time EIT processing directly at the bedside, in offline analysis tools from different manufacturers, and in multiple research studies (Zadehkoochak and Blott et al 1992, Leathard et al 1994, Frerichs et al 2009). However, this separation method does not take into account the occasional spectral overlap of respiratory harmonics and cardiovascular frequencies. Cardiac and respiratory frequencies—and thus their spectral overlap—often vary over time in the critically ill, making simple low-pass filtering less effective. Removing respiratory harmonics results in loss of detail, which inherently affects the outcomes of complex EIT analyses (Kerrouche et al 2001). This is especially important for computation of regional or pixel-level EIT parameters, considering that spectral overlap is of greater magnitude in pixels with close proximity to the heart.
More advanced separation techniques that have been described involve principal component analysis (Deibele et al 2008, Jang et al 2020), or singular value decomposition (Kerrouche et al 2001). While these methods are promising, they are rather complex and computationally expensive. A simple, yet effective method that is primarily aimed at enhancing ventilation monitoring is currently lacking. EMD and discrete wavelet transform techniques are increasingly used in other physiological signal processing (including for the electrocardiogram (ECG), electroencephalogram and electromyogram) (Sun et al 2020, Thangarajoo et al 2021, Hussein et al 2022) and may be a promising and viable alternative to traditional digital filters.
Therefore, the aim of the current study is to design and evaluate automated filtering methods for the offline attenuation of cardiovascular impedance changes in EIT measurements. We focus on three filtering techniques for extracting the respiratory signal while mitigating cardiac interference in EIT: MDN filters, EMD and the MODWT. Their performances will be evaluated against traditional DLP using clinical and simulated data. We hypothesize that EMD and MODWT perform better in removing cardiovascular impedance changes considering the time-varying frequency content.
2.1. Subjects and signal acquisitionTo evaluate the performance of the proposed filtering techniques we used both patient data and simulated data (see paragraph 'Simulations' below). EIT data were gathered from three previously performed studies in the Adult ICU and Neonatal ICU of the Erasmus medical center, Rotterdam, the Netherlands (local informed consent procedures were followed). EIT recordings were performed with the Pulmovista 500 (Dräger, Lübeck Germany) or LumonTM (Sentec AG, Therwil Switzerland) (Somhorst et al 2022, Wisse et al 2024). The sampling rate for Pulmovista was 20 Hz and the sampling rate for Lumon was 50.2 Hz. The spatial resolution was 32 by 32 pixels for both devices.
To evaluate performance of our filtering techniques under various conditions and within a wide and variable range of respiratory and cardiac frequencies, data from 5 adult patients on controlled ventilation (Pulmovista), 5 adult patients on pressure support ventilation, 5 adult spontaneously breathing patients without ventilator support, and 5 prematurely born neonates on synchronized intermitted positive pressure ventilation (Lumon) were randomly selected from our larger studies. We selected stable one-minute intervals from longer recordings of these patients. All data processing and development of algorithms and simulations were performed in Python version 3.11.4.
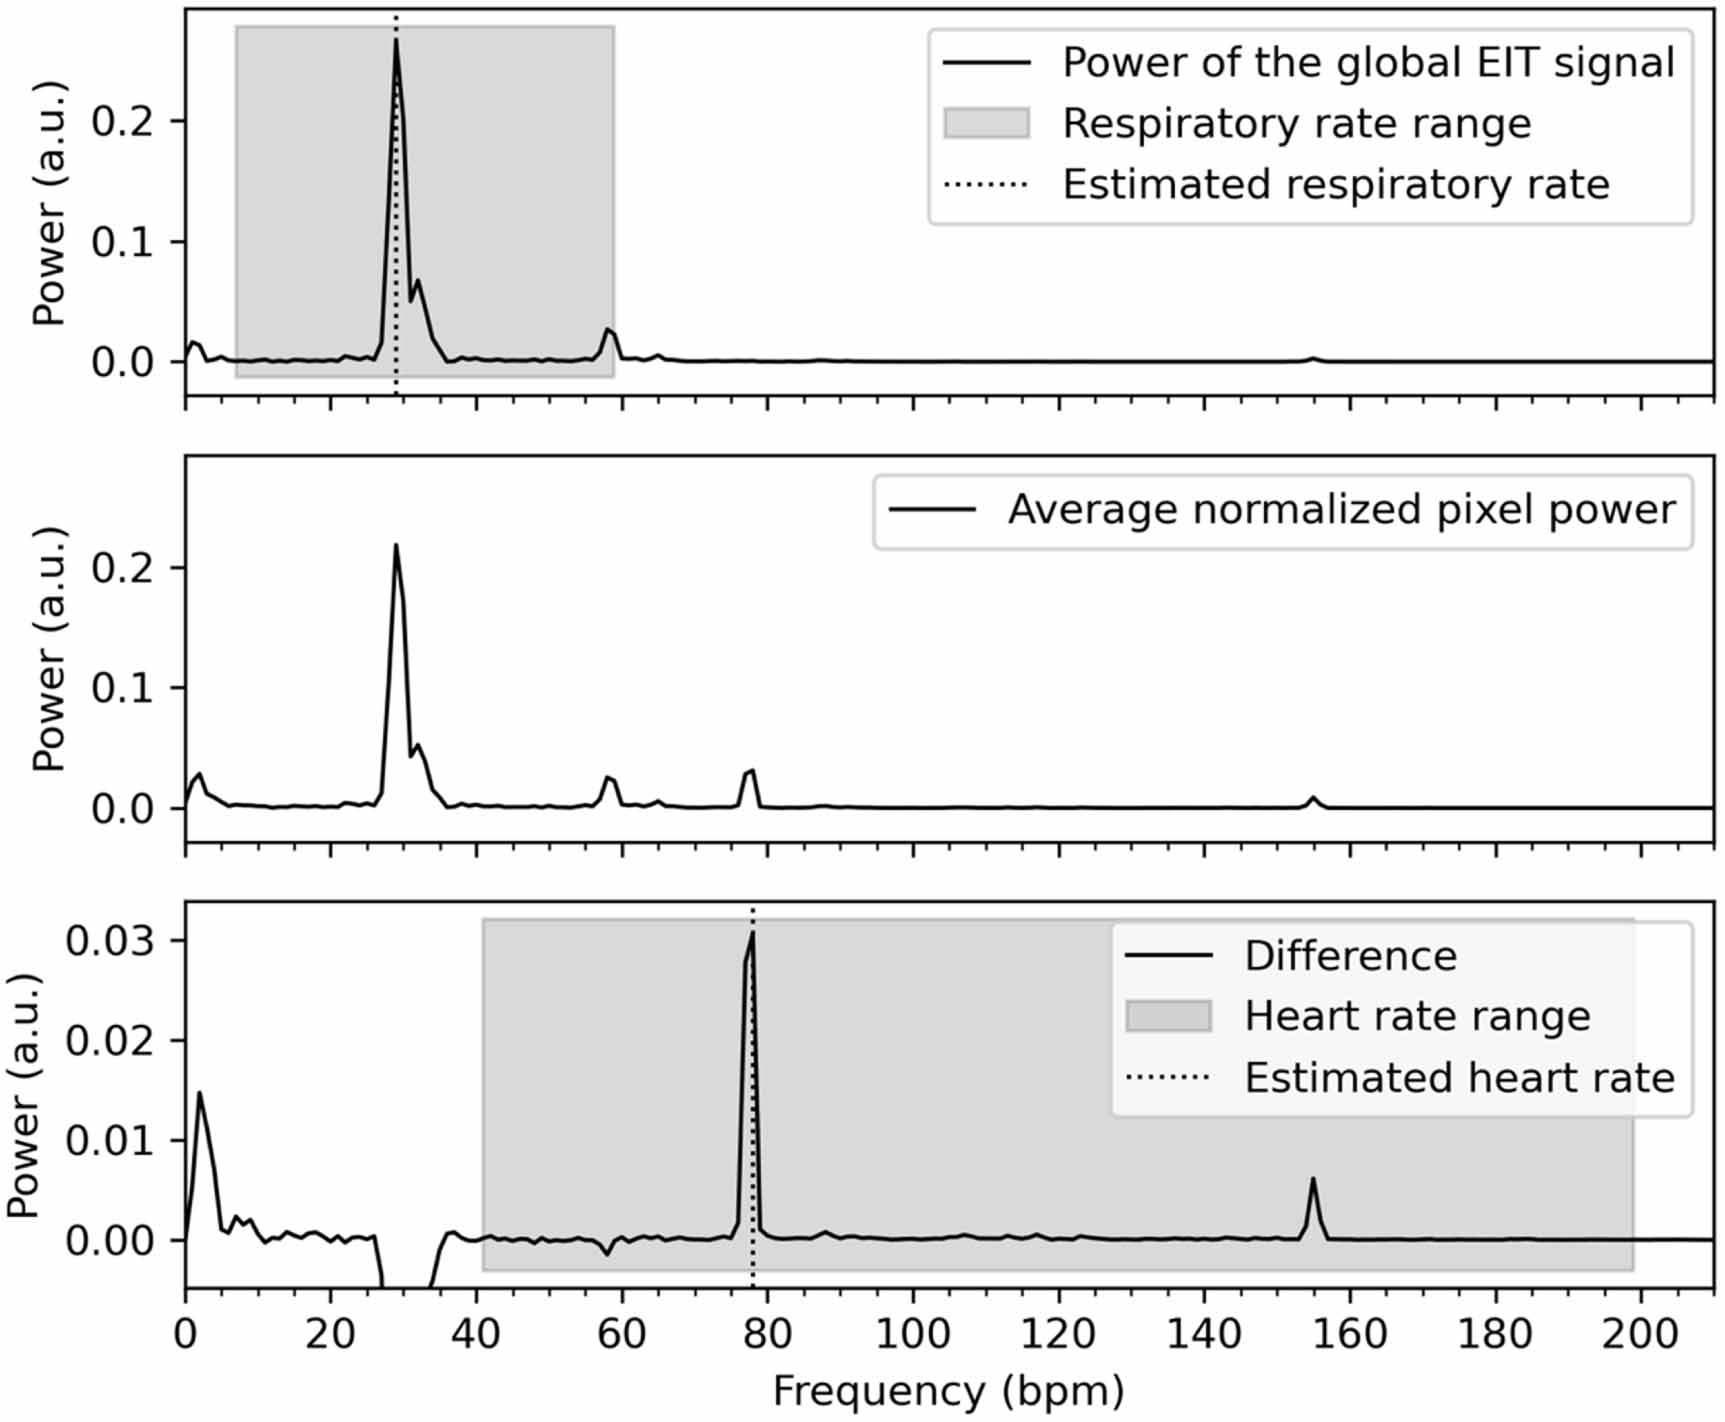
2.2. Heart rate detection algorithmSome filter algorithms we designed depend on prior knowledge of the heart rate, for which we developed a heart rate detection algorithm (figure 1 and see supplement 1 for more detailed description). If not separately recorded, acquiring the heart rate from EIT data is a non-trivial problem. To note, the periodogram of the global EIT signal generally shows three main frequencies: an offset in the range from 0 to 6 breaths or BPM, the RR, and the heart rate. The highest peak in the periodogram >6 BPM is generally the RR, and the second highest peak is the heart rate or the first harmonic of the RR. However, these two latter peaks might overlap. Therefore, simply finding the second or third highest peak in the periodogram, even when ignoring harmonics, does not always accurately reflect the heart rate. Hence, we propose an algorithm that uses the periodogram of each individual EIT pixel and compares it to the periodogram of the global EIT signal. Some pixels contain mostly the respiratory signal, while others contain more cardiovascular information. We first enlarged the cardiovascular component by normalizing the periodogram of each pixel by dividing by the area under the curve. This artificially enlarges the power of those pixels with a large cardiovascular signal. The difference between the normalized periodogram and the global periodogram shows which frequencies were enlarged during this process, resulting in an overrepresentation of the heart rate that can be easily detected (figure 1). For comparison and evaluation of performance, we obtained the patient's heart rate from the digital clinical patient record at the time of EIT recording.
Figure 1. Visual explanation of the heart rate detection algorithm in a representative case (adult patient) during pressure support mechanical ventilation. Top: normalized periodogram of the global EIT signal. The respiratory rate is easily estimated as the location of the maximum value within the viable range: 29 BPM. Middle: average normalized periodogram of all included pixels. Note the peak around 78 BPM that was not present in the top plot. Bottom: the difference between the top and middle plot. Averaging the normalized periodograms results in an apparent increase in power in the range of 0–5 BPM and around 78 BPM (and its harmonics), and an apparent decrease in power around the respiratory rate (25–35 BPM). The heart rate is now easily estimated as the location of the maximum value within the viable range: 78 BPM. Note that it would be visually impossible to detect the heart rate correctly solely based on the periodogram of the global EIT signal.
Download figure:
Standard image High-resolution image 2.3. Filter algorithmsThe following paragraphs briefly present the algorithms under analysis to remove the cardiovascular impedance changes from the EIT data.
DLP (comparator filter) is a popular and widely used filtering method for the time domain. This rather simple filter can be applied to EIT data assuming that heart rate and RR can be adequately separated in frequency. We applied a 5th order Butterworth filter with a low-pass frequency of 40 BPM (0.67 Hz, minimum heart rate) for adults and 90 BPM (1.5 Hz, minimum heart rate) for neonates.
MDN was designed as an extended version of the DLP filter. It uses individualized cut-off frequencies for each patient. To achieve this, we applied multiple 5th order Butterworth notch filters. For the first filter, the stopband frequencies were set to heart rate ± 10 BPM. Subsequent notch filters were applied to the harmonics of the heart rate ± 10 BPM, until the harmonic reached a frequency above 210 BPM (3.5 Hz). These notch filters were combined with a low pass filter with a cut-off frequency at 210 BPM (3.5 Hz). To individualize the cut-off frequencies for each data set we utilized our heart rate detection algorithm.
EMD is a time-domain filtering technique that separates a signal into groups of similar frequencies known as IMF, by a process called sifting. At each sifting iteration, the technique identifies local extrema in the signal, creates upper and lower envelopes and extracts the mean envelope. This process is repeated iteratively until all IMFs are obtained, with each iteration revealing a lower-frequency component in the data (Huang et al 1998). However, it often occurs that an IMF fails to isolate a single oscillatory component and that the cardiovascular components are included in multiple IMFs making it challenging to subtract a single IMF from the original signal. This phenomenon is called mode-mixing (Xu et al 2019). To prevent mode-mixing, we designed a modified EMD method using a frequency-depended mask.
Masking involves adding a sinusoid with a known frequency to the original signal (Wu and Huang 2004, Deering and Kaiser 2005). After estimation of the first IMF, the mask is subtracted from the filtered signal. Then, the next IMF is estimated by addition of a new, lower frequency mask (see supplement 4, figures 1 and 2). We chose masks with frequencies that forced the circulatory information to be extracted at predictable sifting iterations. Fosso et al (Fosso and Molinas 2018) also demonstrated that using powers of 2 times the heart rate introduces mode-mixing of lower frequencies into the masked IMF. A mask with frequency fm results in an IMF with frequencies between 0.67 × fm and fm. If a signal is masked with a 1 Hz sinusoid, the resulting IMF will also contain frequencies between 0.67 and 1 Hz. Accordingly, to get the optimal mask frequency, the heart rate should be divided by 0.67 to obtain a ground mask frequency (GMF). The masks can be constructed based on the GMF by: [22, 21, 2°] × GMF.
Figure 2. Visual explanation of the quality measures in the time domain. This example is created to exaggerate the difference for visual purpose and does not represent real filtered and clean data. The sum of all gray marked areas is the Removal Error. The Timing Error is the difference between the detected peaks and through in the filtered and simulated signal. The amplitude of the filtered signal (Afiltered) and the amplitude of the clean signal (Aclean) are used to calculate the Amplitude Ratio.
Download figure:
Standard image High-resolution imageMODWT is a powerful tool for analyzing varying time series data and is useful for detecting patterns and changes in signals with time-varying frequency content. The signal is decomposed by repeated application of a wavelet filter to the signal. The wavelet filter decomposes the EIT signal in a detail part (representing the high–frequency information) and an approximation part (representing low-frequency information). The decomposition process of the approximation part is repeated at multiple levels, each level providing more detailed information about the signal's frequency (Khawaja 2007, Daud and Sudirman 2022). MODWT differs from other discrete wavelet transform methods as each level of decomposition overlaps with adjacent scales to provide a more comprehensive representation of the signal's spectral content. We evaluated the performance of different orthogonal wavelets (Haar, discrete Meyer, Daubechies, Symlet, and Coiflet) and decomposition levels for building the MODWT filter. We found the Symlet (Sym) 13 wavelet with 5 levels of decomposition to be a useful choice for filtering for 50 Hz EIT signals, and the Sym 13 wavelet with 4 levels op decomposition for 20 Hz EIT signals (for further details, see supplement 2). All detail coefficients were set to zero, leaving only the last approximation part.
2.4. SimulationTo obtain simulated EIT waveforms, a clean respiratory signal was generated and contaminated with cardiac artefacts and random noise. The clean respiratory signal was generated by convolving a repetitive square block (with its frequency set to the RR), with an exponentially decaying signal. The cardiovascular artefacts were selected from EIT data during in-and-expiratory holds and periods with apnea. During these periods there was no ventilation and the measured impedance changes were only generated by the cardiovascular system. Ten periods with cardiac artefacts were selected from neonatal and adult patents and resamples over multiple heartrate frequencies. Random noise was created with random samples from a Gaussian distribution. To obtain the full simulated EIT waveform affected with noise, the simulated respiratory signal, cardiovascular signal and the random noise were summed up. A detailed description of the generation of the EIT data simulation method can be found in supplement 3.
We generated a total of 225 simulations with various RRs, heart rates and shape combinations, representing the clinical range and variability of these frequencies.
2.5. Quality measuresThe performance of the filtering techniques was evaluated as follows: (1.) in the time domain, by comparing the removal error, timing error and amplitude difference; (2.) in the frequency domain, by comparing the median frequency, relative error, SNR and the H/L ratio; and (3.) by visual inspection (Chen et al 1994, Jonkman et al 2021, Petersen et al 2020, Zhan et al 2010). Table 1 gives an overview of all quality measures and figure 2 provides additional visual explanation of the time-domain quality measures; a more detailed description can be found in supplement 5. As we cannot obtain the true clean EIT signal of patient recordings, it is not possible to assess most of these measures in clinical patient data. Therefore, only the median frequency and the H/L ratio was calculated to objectify the performance of the filters in clinical data.
Table 1. Quality measures in the time and frequency domain.
DomainQuality measureExplanationFormulaSimulated/ClinicalTimeRemoval error (erem)Normalized difference between the clean and the filtered signal. SimulatedTiming error (etime)Mean difference between the end-inspiratory and end-expiratory time points of the clean and filtered signal.
 SimulatedTiming error sd (sd etime)Standard deviation of the difference between the end-inspiratory and end-expiratory time points of the clean and filtered signal.
 SimulatedAmplitude ratioRatio of the mean amplitude of the filtered signal and the amplitude of the clean signal.
 SimulatedFrequencyRelative error (erel)Overall difference of the power spectral densities (PSD) of the filtered and clean signal.
 .100%SimulatedMedian frequencyMedian frequency in the averaged Welch's periodogram.
 Simulated & ClinicalSignal to noise ratio (SNR)Ratio of the power of the clean signal and the power of the noise. The power of the noise was calculated by subtracting the power of the clean signal from the power of the filtered signal.
 SimulatedHigh/low ratio (H/L)Ratio of the power in the high frequency content of the signal and the power of the low frequency content of the signal. The cut-off between high and low (
 ) was set to
  .
.
 Simulated & Clinical2.6. Statistical analysis
Differences between the quality measures as extracted from the filtered signals using the various algorithms and when applied to both the simulated signals and the patient data were analyzed by repeated measures ANOVA with Greenhouse–Geisser correction at the 95% significance level; pairwise comparison was performed after Bonferroni correction. The performance of the heart rate detection algorithm was evaluated using Bland-Altman analysis by comparing the heart rate as detected by the algorithm with that obtained from the digital patient file. Normality was checked with the Shapiro–Wilk test and appropriate transformation was applied if necessary; for the data to be considered a normal distribution after such transformation, we accepted a 90% significance level of the Shapiro–Wilk test. Statistical analysis was performed using R-statistics (version 4.3.1).
3.1. Heart rate detection algorithmWhen comparing the heart rate detected using the proposed heart rate detection algorithm with that reported clinically, the Bland-Altman analysis revealed a bias of 0.8 BPM with limits of agreement between −2.9 and 4.6 BPM (supplemental figure S1-1).
3.2. Filtering performanceExamples of the different filtering methods and their performance is demonstrated in figure 3 in both the time and frequency domain, presenting a representative case of patient data (adult and neonatal ICU patient) as well as simulated data. Details around the peaks and throughs of the signal were followed well by MDN and MODWT. Generally, DLP MODWT and EMD resulted in more loss of detail around the peaks and throughs of the signal. The performance of MODWT to filter out the heart action was variable in adult patients, and failed in some cases to filter out bumps due to the heart action. MODWT seemed to perform better in the neonatal and simulated cases. Most filters removed a broad range of high frequency content from the signal. MDN was more discriminatory and successfully removed the frequencies surrounding the heart rate and its harmonics.
Figure 3. Top: Time interval containing two breaths of the raw and filtered signal using the digital low pass filter (DLP), multiple digital notch filters (MDN), empirical mode decomposition (EMD) and maximum overlap discrete wavelet transform (MODWT) for three different cases: an adult during controlled mechanical ventilation (corresponds to figure S1-2), a neonate during support ventilation (corresponds to figure S1-3) and a simulated signal (RR 30 bpm, heart rate 70 bpm). DLP and EMD generally result in loss of detail around the peaks and troughs of the signal. MDN and MODWT seem to better follow the shape of the troughs compared to the other methods. MODWT fails to filter out a bump due to heart action between t = 3 s and t = 4 s in the adult case, but performs better in the neonate and simulated case. MDN functions similarly in all three cases. Bottom: fast Fourier transform of the 1-minute recording from which the time interval in the top plots were taken. Note that the y-axis is log-scaled. All filters remove especially higher frequencies from the signal. MDN is successful in mainly removing the frequencies surrounding the heart rate and its harmonics. All other filter techniques are less discriminatory in the removal of high frequency data.
Download figure:
Standard image High-resolution imageBelow, we provide a quantitative analysis of quality measures.
3.3. Simulated dataQuality measures indicating the filtering performance in both the time and frequency domain using the simulated contaminated EIT data are presented in figure 4. For reference and interpretation of the effect of different filters, we also plot the quality measures when comparing the contaminated unfiltered signal to the clean signal. All filters caused a time shift of the filtered signal compared to the clean signal. This time difference was consistently negative, identifying a shift of the peak to an earlier point in time. The timing difference of MDN and EMD is small and EMD comes with a relatively small standard deviation of the time difference but has a large number of outliers. An optimal amplitude ratio is achieved at a value of one. DLP tends to underestimate the amplitude while MDN approximates an amplitude ratio of one. The median frequency was low in all signals. The median frequency of MDN was higher compared to the other filters, indicating that MDN removes less high frequency content from the signal. The SNR performance was best for DLP; however, this comes at the cost of a high relative error and removal error. MDN, EMD and MODWT exhibited comparable performance regarding the SNR, with the best performance in relative error and removal error for MDN. Analysis of the H/L ratio emphasizes the loss of high frequency data after filtering, demonstrating that DLP removes most high frequency content and MDN the least high frequency content compared to the other filters.
Figure 4. Quality measures of the filter performance of the simulated data. Significant difference (p < 0.05) in the quality measure between the filters is indicated with a horizontal bar. The quality measures are the time difference, standard deviation of the time difference, amplitude ratio, median frequency, signal to noise ratio, relative error, removal error and the H/L ratio.
Download figure:
Standard image High-resolution image 3.4. Clinical dataThe H/L ratio and median frequencies of the EIT signals from all patients after DLP, MDN, EMD and MODWT filtering are presented in figure 5. All filtering techniques reduced the power of the higher frequency content with a corresponding decrease in the H/L ratio and a decrease in the median frequency. Post-hoc tests revealed a significant decrease in the H/L ratio of all filtering techniques, with effects more pronounced for DLP. The median frequency of the unfiltered data was significantly different compared to all filtering techniques. DLP removed most high frequency content and has the lowest median frequency. The median frequencies of the signal after MDN is closest to the unfiltered signal. The median frequency of MDN, EMD and MODWT filtering did not differ significantly. The figures in supplement 6 show the difference in behavior of the filters between neonates and adults. A remarkable difference is the performance of MODWT regarding the H/L ratio in neonates which is remarkable lower, indicating that more high frequency content was removed.
Figure 5. Performance quality measures (high/low ratio and median frequency) of the filters for the patient data. Significant difference (p < 0.05) in the quality measure between the filters is indicated with a horizontal bar.
Download figure:
Standard image High-resolution imageIn the current study we present and compare methods for suppression of cardiovascular artefacts from EIT recordings. We designed and evaluated four filter techniques: DLP, MDN, EMD and MODWT. The filter performances were evaluated in simulated EIT data and in neonatal and adult patient data. The performance of the filters was determined in both the time and frequency domains by computing quality measures related to the signal's timing, amplitude, error/SNR and frequency components. These measures can be interpreted as follows:
Timing: MDN had the best performance in the time domain, with relatively small timing error. The small timing error of MDN, EMD and MODWT filtering come with a small standard deviation of the time difference but a large number of outliers. Leading to a considerable variation in performance from one signal to another. Amplitude: MDN performs best regarding amplitude preservation. While DLP filtering tends to underestimates the amplitude, the amplitude estimation after MDN best reflected the true respiratory amplitude variations. Error/SNR: as expected, all filtering techniques reduced the noise. Although DLP increases the SNR most, this is at the expense of removal of respiratory information, as demonstrated by the high relative and removal error of this filter. MDN, EMD and MODWT demonstrated the similar performance regarding the SNR, whereas MDN showed the lowest relative error and removal error. Frequency: All filtering techniques eliminate high frequency components from the signal, leading to a reduction in the median frequency across all methods. The median frequency of MDN, EMD and MODWT is most closely aligned with the original signal. DLP is very coarse and removes most high frequency content.These results confirm that performance of the EIT processing methods varies depending on the parameter of interest. The advantages and disadvantages of each filtering technique should be weighed when considering the data type and specific research/clinical question. Researchers should also be aware that EIT recordings are dynamic with regard to frequency content and they should be stimulated to transparently publish their precise methodology. This will allow generalizability and comparability of studies and eventually improves EIT implementation in clinical practice. In current clinical and research practice the presence of cardiac artifacts may compromise the accuracy of clinical interpretations and the reliability of advanced EIT parameters. Choosing the right filtering technique could lead to more reliable research and eventually more reliable bed-side treatment decisions. We encourage the establishment of standardized procedures in preprocessing EIT data, applicable for both clinical and research purposes.
4.1. Heart rate detectionSince evaluation of the filter performance was limited to one-minute selections of patient data, heart rate variability could be rather limited in this short period. The performance of MDN and EMD filters may decrease during longer recordings with changing heart rate frequencies. Therefore, our suggested heart rate detection algorithm should be repeatedly applied when analyzing longer time intervals, in order to continuously update the input heart rate; this will require some computational effort but is certainty feasible.
MODWT has the benefit that it does not require an input heart rate and could thereby better handle time-varying frequency contents. However, substantial changes in the heart rate—which is not uncommon in the critically ill—might change the optimal level of signal decomposition, which was fixed for this study. Future work should focus on adaptive thresholds and individualized selection of decomposition levels. This will likely improve the performance of this filter.
4.2. SimulationsSimulated data was used to test the performance of the proposed filter techniques, for two main reasons. First, the RR and heart rate could be set to specific ratios (i.e. the heart rate could be set as a harmonic multiple of the RR to enhance spectral overlap). Second, data without cardiovascular artefacts and noise (i.e., true 'clean' data) allows to test the performance of the filter techniques using several objective quality measures. There is no clean data available for patient measurements, limiting the possibilities to evaluate to what extend the filter affected the original signal. Visual inspection remains an important evaluation step to determine the filter performance on patient data.
4.3. Strengths and limitationsThis study has some strengths and limitations. Strengths are that we included data from different cohorts, age groups, and measured under various ventilation modes and during spontaneous breathing. Additionally, we performed extensive simulations using real patient-derived cardiovascular artefacts. The characteristics of the EIT data and types of disturbances differ between neonates and adults, and between controlled ventilation, support ventilation and spontaneous breathing. We comprehensively compared several filtering techniques that have been used or are being studied for application in the field, describing their benefits and limitation. We used stable parts of recordings of limited length. Selection of stable intervals was done manually. For fully automated analysis, this step should be automated as well. Even though we strive towards a one-size-fits-all filter technique, some preselection of filter settings was required, e.g., depending on the sample frequency of the recorded data and the average RR. For fully automated analysis, this should be done automatically. Furthermore, our techniques were developed and applied for offline data processing and are not (yet) suitable for online analysis; employing these methods for online processing should be explored in future studies. All filter performances were evaluated on the global EIT signal. All filters are applicable to filter pixel-level EIT measurements. Similar performances are hypothesized but not confirmed with this study.
4.4. ConclusionThis study demonstrates the performance of new advanced filtering techniques including MDN, EMD and MODWT in filtering cardiac artefacts from EIT data. Each technique exhibited varying degrees of effectiveness and limitations. MDN had the best performance in the time domain and amplitude preservation. EMD demonstrated the best performance regarding the SNR, whereas MDN showed the lowest relative error and removal error. All filtering techniques eliminate high frequency from the signal, with the median frequency of MDN, EMD and MODWT most closely aligned with that of the original signal. The advantages and disadvantages of each filtering technique should be weighed when considering the data type and specific research/clinical question.
The data cannot be made publicly available upon publication due to legal restrictions preventing unrestricted public distribution. The data that support the findings of this study are available upon reasonable request from the authors.
The ethics board approved the study (MEC-2018-1572, MEC-2020-0521 and MEC-2019-0478) and informed consent was obtained. The study has been carried out in accordance with the Helsinki declaration for medical research involving humans (General Assembly of the World Medical Association 2013).
This study was funded by an unrestricted grant by Sentec AG (Therwil, Switzerland).
All Authors declared that they have no competing interests directly related to this study. This study was supported in part by Sentec AG, Therwil, Switzerland. Funders played no role in the design and conduct of the study; interpretation of the data; preparation, review, or approval of the manuscript; nor in the decision to submit the manuscript for publication. The opinions, results and conclusions reported in this paper are those of the authors.
Concept and design: JW, PS, AJ. Data acquisition: JW, PS. Data analysis: JW, PS, JB, AN. Data interpretation: all authors. Manuscript drafting: JW, PS. Manuscript revising for intellectual contact and final approval: all authors.
Comments (0)