
Remember me


Overall, 118 cases of HEV infection from Abruzzo and Lazio from 2015 to 2023 were included in the present study. While the vast majority of analyzed samples were from acute hepatitis cases admitted to hospital because of hepatitis symptoms (n = 114), four cases were asymptomatic (one blood donor and three transplanted individuals), with infection detected either in the frame of a prevalence study in blood donors or in the frame of a project of active surveillance of transplanted patients in Abruzzo.
Table 1 summarizes the demographic features of the study population. Most cases were males (100/117, 85.5%; data not available in one case). The mean age was 58.3 years (± 13.2 years), with no significant difference between males and females.
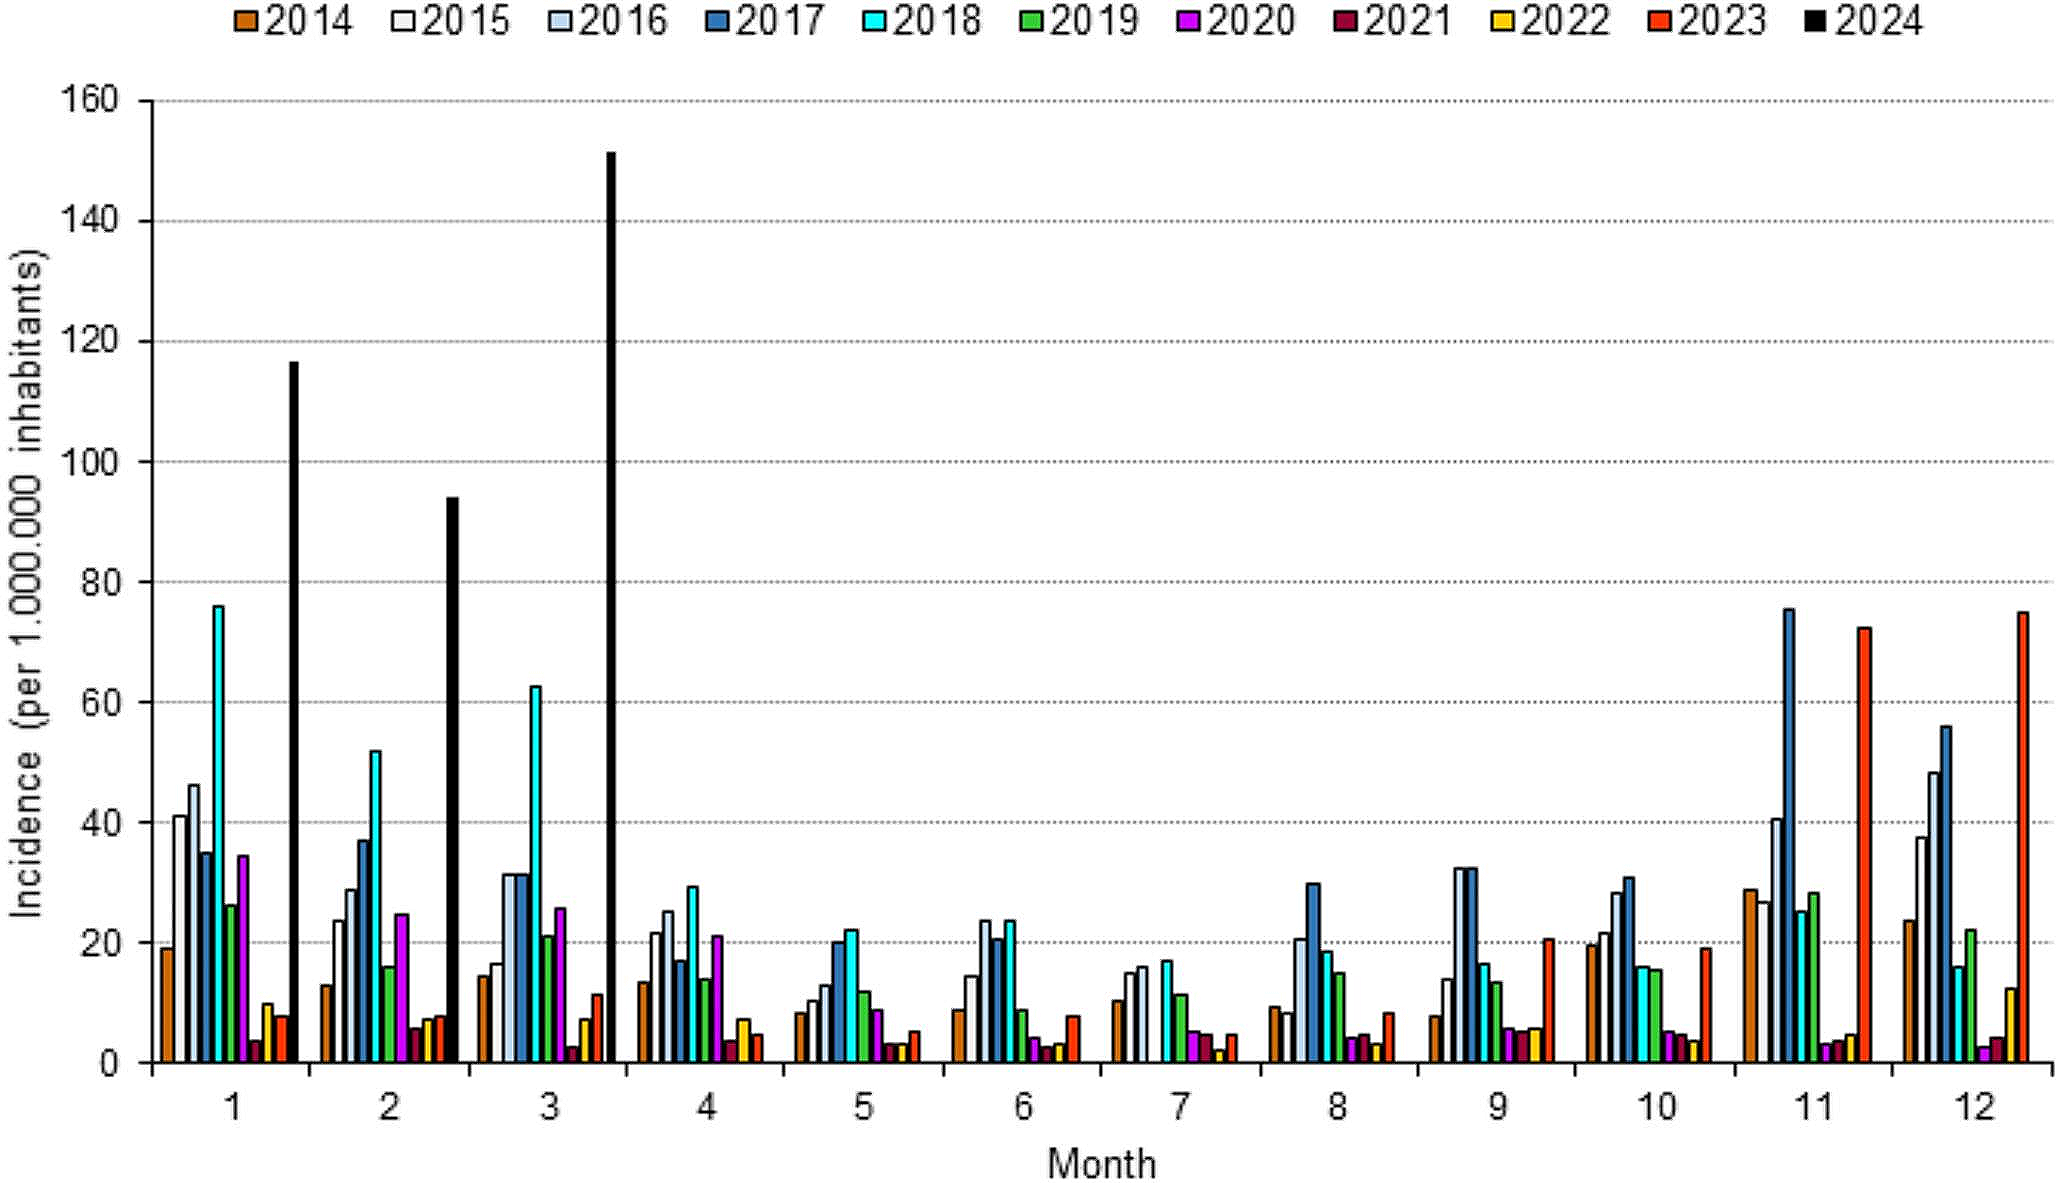
Table 1 Demographic features of the study population (n = 118)Figure 1A shows the monthly distribution of HEV infection cases of the present study, collected in the period 2015–2023; the distribution is based on the date of symptom onset (or the date of sample collection, as a proxy of the onset date). Only three months (July, November and December) showed less than 8 cases, with a quite uniform distribution of cases over the year. However, while the considered population mostly includes sporadic cases, some of them (represented by the orange part of the bars in Fig. 1B) were part of an outbreak occurred in a single year (2019) [22]: thus, in this specific analysis the exclusion of these exceptional cases may more accurately represent the actual monthly distribution of “background” sporadic cases in the period under study (2015–2023). In this latter case, i.e. by considering only the blue bars in Fig. 1B, it is evident a seasonality, with higher frequency in February to April than in the remaining months.
Fig. 1
Monthly distribution of cases observed in the period 2015–2023, in which cases from a HEV outbreak occurred in Central Italy in 2019 are highlighted (orange end of the bars)
Genotyping/subtyping of viral sequences: overall, annual and monthly distribution of subtypesGenotyping by phylogenetic analysis of the 118 HEV sequences together with references of the known eight genotypes showed clearly that all autochthonous HEV infection cases in Abruzzo and Lazio during 2015–2023 had been caused by HEV genotype 3 (data not shown). During this period, we had also observed five cases caused by HEV genotype 1, all from foreign people from India, Pakistan, and Bangladesh. All of them manifested acute hepatitis symptoms when came back from their country of origin. Those sequences were omitted from the study because they were not autochthonous strains.
Figure 2 shows the subtyping results of the 118 sequences by phylogenetic analysis. The ISS and INMI laboratories sequencing protocols produce 493 nt and 411 nt sequences, respectively, with a 370 nt overlapping region. To include in the analysis as much as possible genetic information, the sequences obtained by the two different protocols were subtyped separately, reserving phylogenetic analysis of the 370 nt overlapping region only to the search for possible clusters (see below). Figure 2a and b report the phylogenetic trees obtained from the 493 nt and 411 nt sequences, respectively.
Fig. 2
Phylogenetic trees for HEV subtyping, obtained by the Maximum Likelihood approach. (A) Analysis of n = 52 sequences, size 493 nt. (B) Analysis of n = 66 sequences, size 411 nt. Both trees include 39 Reference sequences representing subtypes 3a to 3 m, as reported in Smith et al., 2020 [2]. The meaning of the red and black dots is reported in the insert in the lower right corner of the figure
A p-distance analysis of the sequences was also carried out. Supplementary Table 1 reports the individual p-distance values calculated between each of the 118 sequences and each of the same 39 reference sequences used for phylogenetic analysis. The average p-distances of the sequences, grouped by subtype according to the results of phylogenetic analysis, are reported in Supplementary Table 2. The 3f, 3e, 3a and 3c strains correctly showed the lowest average p-distance only when compared with reference sequences of the same subtype; one only exception was a sequence that could not be unambiguously assigned to a specific subtype by phylogenetic analysis (INMI_1909/Dec.2019/ in Fig. 2B) and that, in fact, showed low p-distance both with 3c and 3i references (Supplementary Table 2, column “3chilm strain”).
Figure 3A summarizes the distribution of subtypes according to the results of phylogenetic and p-distance analysis. One half cases was subtype 3f (61/118, 51.7%), the great majority of remaining cases were split between 3e (30/118, 25.4%) and 3c (25/118, 21.2%); one case observed in 2017 was 3a; finally, in one case occurred in 2019 (the above mentioned INMI_1909/Dec.2019 in Fig. 2B) phylogenetic analysis places its sequence in the 3chilm clade (i.e. in the clade including 3c, 3 h, 3i, 3 L, 3 m reference sequences) and it appears most similar to the 3i reference, but without significant boostrap support; p-distance analysis also did not provide any further elements for subtype assigment: so it was classified as a member of the 3chilm clade.
Fig. 3
(A) Subtype distribution, HEV infection cases (n = 118) from Abruzzo and Lazio, 2015–2023. (B) Annual trend of subtype distribution of 3f, 3e and 3c cases from Abruzzo and Lazio, 2015–2023. The annual number of cases in the years 2015, 2020, 2021, 2022 was not large enough (n = 3, n = 7, n = 7 and n = 3, respectively) to give rise to a reliable annual distribution. Thus, cases from 2015 were joined to 2016, cases from 2020 were joined to 2021 and cases from 2022 were joined to 2023. (C) Monthly distribution of 3f, 3e and 3c subtype cases cumulatively observed in the period 2015–2023 in Abruzzo and Lazio, including 3f and 3e cases from the 2019 outbreak. (D) Monthly distribution of 3f, 3e and 3c subtype cases after exclusion of the 3f and 3e cases from the 2019 outbreak
Figure 3B shows the annual trend of subtype distribution of 3f, 3e and 3c cases. It is evident that year 2019 contributed heavily to the total number of 3e and 3f sequences in the overall study period, because of the above-mentioned outbreak occurred in that year. Except in 2019, the 3f subtype appears to be the most frequent over the studied period, followed by 3c and 3e; this latter subtype was rarely detected before and after the 2019 outbreak. Careful analysis of residence data of individual cases showed that in Abruzzo the few 3e cases detected in 2015–2018 were from the coastal areas (Pescara and Chieti provinces); in the internal areas (L’Aquila province) the 3e subtype had never been detected previously and was first observed upon the 2019 outbreak, that was sustained mainly by 3e strains, possibly introduced by pork products or live animals imported from outside Abruzzo [22].
Figure 3C shows the monthly distribution of 3f, 3e and 3c subtypes in the period 2015–2023 in Abruzzo and Lazio. A seasonal trend can be recognized: the winter/early spring months show an excess of 3f subtype while summer months include most subtype 3e cases observed in 2015–2023. Figure 3D shows that this trend holds even after having excluded the 3f and 3e outbreak cases occurred in summer/fall 2019.
Subtypes vs. demographic and clinical variablesNo differences in the distribution of 3f, 3e and 3c subtypes were observed between males and females or in different age groups (data not shown).
No significant differences of ALT and AST levels could be observed among 3f, 3e and 3c, however total bilirubin levels were significantly higher in 3f (6.53 mg/dL ± 7.93) than in 3c (2.82 mg/dL ± 3.08) (t-Student’s, p = 0.01).
Analysis of molecular clustersThe sequences obtained by the different ISS and INMI sequencing protocols were aligned and the shared overlapping region (size: 370 nt) was subjected to phylogenetic analysis by a Maximum Likelihood approach.
Figure 4 shows the resulting phylogenetic tree. It was preliminary controlled if the “cut” 370 nt sequences had been assigned to the same subtypes as in the two phylogenetic trees obtained from the “uncut” 493 nt and 411 nt sequences (Fig. 2A and B, see above). Careful comparison of the trees demonstrates that the “cut” 370 nt sequences were correctly grouped in the same subtype clades as in the trees obtained from the “uncut” sequences.
Several sequence clusters could be identified according to the following criteria: (a) the cluster had to be statistically supported (bootstrap value ≥ 70) and (b) sequences in the cluster had to be identical or closely related (≤ 3 nt differences over 370 nt). Identified clusters were then evaluated for any possible temporal and/or geographical link among the cases from which the sequences were obtained.
Fig. 4
Phylogenetic tree resulting from analysis of a 370 nt region shared by the HEV sequences obtained with different protocols (n = 118). A Maximum Likelihood approach was applied, with a GTR + G + I evolutionary model preliminarily estimated by the Model tool in MEGA. The tree includes reference sequences (n = 39) representing subtypes 3a to 3 m, as reported in in Smith et al., 2020 [2]. The meaning of red, blue and black circles is described in the box. Clusters are delimited by red lines and marked by alphabetical letters, A to N
Seven clusters (A to G) were identified in the 3f clade (Fig. 4). Cluster A includes sequences from the above mentioned HEV outbreak that occurred in 2019, that was sustained by multiple 3f and 3e HEV strains [22]. Cluster B includes five sequences, four of them identical each other and the fifth with 1 nt difference; they show geographical link (all occurred in Lazio) and they also show a temporal link (onset between mid-February and mid-March 2017). Cluster C includes two closely related sequences (1 nt difference) showing geographical as well as temporal link (both cases from Lazio in April 2017, onset three days apart). Cluster D includes five sequences (three identical, the two others with 1 nt and 2 nt differences); the cases occurred in a narrow timeframe (between mid-April and the end of May 2018). Three cases were from Lazio, but one of them reported a dinner in Abruzzo with consumption of pork products about three weeks before onset of symptoms; the two other cases were from Abruzzo. Cluster E includes two identical sequences from cases occurred in Lazio in January 2016, with onset on two consecutive days, admitted in two different hospitals. Cluster F includes two identical sequences from two cases occurred in Lazio in May 2021, with onset two days apart, admitted to the same hospital. Cluster G includes two identical sequences from two cases occurred in Abruzzo in February 2018, with onset four days apart.
Three clusters (H to L) were identified in the 3e clade (Fig. 4). Clusters H and L mostly include 3e sequences from the above-mentioned outbreak occurred in 2019, in which two distinct 3e clusters had been recognized [22]. However, cluster L also includes two further sequences detected one-and-a-half and two years later, respectively: a closely related sequence (ISS_ID_366, 1 nt difference) detected in January 2021 from a case in Abruzzo and an identical sequence (INMI_2109) detected in August 2021 from a case in Lazio. Cluster I includes two identical sequences from two cases occurred in Lazio in February 2016, with onset one week apart, admitted to the same hospital.
Two clusters (M and N) were identified in the 3c clade (Fig. 4). Cluster M includes two closely related sequences (1 nt difference) from two cases occurred in Lazio in 2023, with onset two months apart (mid-June and mid-August). Cluster N includes five sequences (two identical and three closely related sequences with 1–3 nt difference) occurred in cases from both Lazio and Abruzzo between February 2017 and April 2018. However, even though the cases formally occurred in two different regions, actually they are geographically linked: in fact, the cases have their residence in towns/villages quite close to each other, in an area at the border of Lazio and Abruzzo (maximum straight-line distance between those towns/villages: 25 Km).
Analysis of risk factorsInformation about risk factors was available for 48 HEV positive cases; they were compared with risk factors available from 99 non-A/non-B/non-C hepatitis cases whose samples had been received for HEV testing during 2015–2023 and had proved to be negative for anti-HEV IgM and IgG as well as for HEV-RNA. No significant differences were observed in the frequency of consumption of raw or undercooked meat (from pig/wild boar/dear) and in consumption of wild boar sausages, while consumption of both pig sausages and liver sausages was significantly more frequent in the HEV positive group than in the HEV negative one (pig sausages: 40/46, 87% vs. 59/92, 64%, Fisher’s test: p < 0.005; liver sausages: 28/45, 62% vs. 21/90, 23%, Fisher’s test: p < 0.0001).
Comments (0)