All chemicals and reagents used in this study were purchased from Sigma Chemicals Company, unless otherwise specified.
Experimental design
The experimental design consisted of isolating COCs (GV stage) from EAFs and subjecting them to the long in vitro culture process (LIVC) for 5 days, either individually or in groups. The 5-day duration was chosen based on previous studies showing that this is the minimum time required for oocytes within EAFs to reach meiotic competence [3]. A comprehensive series of assessments were conducted both before and after the LIVC procedure, encompassing various parameters such as COC morphology, cumulus cell viability, ultrastructural evaluations, gap junction communication, oocyte diameter, global transcriptional activity, chromatin configuration, levels of reactive oxygen species (ROS), and mitochondrial activity and distribution patterns. Following these assessments, to investigate the potential of meiosis resumption, the in vitro-grown COCs were subjected to an in vitro maturation (IVM) process (Supplementary Fig. 1).
Ovary collection and isolation of cumulus-oocyte complexes
Sheep ovaries (Sarda sheep) were collected during the non-breeding season from a local slaughterhouse and transported to the laboratory within 1 h. To ensure ideal conditions during transportation, they were placed in a 50-mL tube filled with a 0.9% saline solution and then in a thermos flask maintained at 37 °C. Upon arrival at the laboratory, the ovaries were rinsed with a holding medium (H-TCM199) consisting of TCM199 supplemented with 20 mM HEPES, 1790 IU/L Heparin, 0.4% BSA (BSA, fraction V), 0.062 g/L Penicillin G, and 0.010 g/L Streptomycin. All subsequent procedures were performed at a controlled temperature of 38.5 °C using a warm plate. To isolate growing COCs, ovarian cortical slices (1–2 mm thick) were carefully sectioned using a surgical blade and placed in a 6-cm glass Petri dish containing H-TCM199 supplemented with 5 µM Cilostamide (HTCM199-Cilo) [6]. Cilostamide, a specific PDE3A inhibitor, prevents cyclic cAMP hydrolysis. The prevention of cAMP drop has been shown to maintain gap junction functionality between oocytes and cumulus cells [16, 17]. The samples were then examined under a stereomicroscope, and COCs were retrieved by gently puncturing the follicle walls of EAFs (outer diameter, 350–450 µm), using a 21-gauge needle [6]. The isolated COCs were then washed in HTCM199-Cilo and transferred to a pre-warmed Petri dish (38.5 °C with 5% CO2) containing base medium (B-TCM199), which consisted of TCM199 supplemented with 2 mM GlutaMAX™ (ThermoFisher Scientific, Milano, Italy), 0.4% fatty acid-free BSA, 0.2 mM sodium pyruvate, 25 mM sodium bicarbonate, 0.1 mM cysteamine, 75 µg/mL kanamycin, 4% polyvinylpyrrolidone (PVP; 360 k molecular weight), 21.3 µg/mL of phenol red, and 5 µM Cilostamide [6]. Each isolation session lasted a maximum of 30 min, yielding 20–30 COCs per session (4–8 COCs per ovary).
Incorporation of COCs in the LIVC system
Before initiating the LIVC process, the diameter of the oocytes was measured using an inverted microscope (Nikon Diaphot-TMD) equipped with a digital camera (Leica-DFC450) and a heated stage. Only oocytes with a diameter of 110 ± 5 µm (excluding the zona pellucida) that displayed a uniform cytoplasm and were surrounded by five or more complete layers of cumulus cells without any signs of expansion were selected [6].
The selected COCs were then washed in pre-warmed B-TCM199 (38.5 °C, 5% CO₂) and cultured in a 96-well plate (BioCoat™ Collagen I, Becton Dickinson Italia, Milan, Italy), either individually or in groups of three per well. Each well contained 200 µL of B-TCM199 supplemented with 0.15 µg/mL Zn sulfate, 10−4 IU/mL FSH (r-hFSH, Gonal-F, Merck-Serono, Roma, Italia), 10 ng/mL estradiol, 50 ng/mL testosterone, and 50 ng/mL progesterone [6]. The plates were incubated in a humidified atmosphere at 38.5 °C with 5% CO₂ for 5 days.
To maintain a stable culture environment, sterile embryo culture tested water was added around the edges of the culture plates. Half of the culture medium volume was replaced with freshly prepared medium on the second and fourth days of culture. Following the culture, only COCs with compact granulosa cells and no morphological indications of degeneration, such as darkened or deformed oocytes, were selected for further analysis or in vitro maturation.
Evaluation of COCs before and after LIVCMorphology and viability of COCs
The morphology of COCs before (n = 96) and after single (n = 45) and group (n = 70) culture was evaluated using an inverted microscope (Nikon Diaphot-TMD) equipped with a digital camera (Leica DFC450) and a warm plate (38.5 °C). COCs were classified into three grades based on cumulus cell integrity: grade 1, with compact cumulus cell layers, showing no signs of cell expansion or degeneration; grade 2, with multiple cumulus cell layers, lacking cumulus expansion and exhibiting partial disaggregation in the outer cell layers; and grade 3, with significant cumulus cell loss (over 50% of the oocyte surface) and signs of cell degeneration [6, 26].
The viability of COCs before (n = 96) and after single (n = 48) and group culture (n = 70) was assessed using propidium iodide (PI) staining, as previously described [30]. Briefly, COCs were incubated in a culture medium containing 10 µg/mL PI for 5 min (38.5 °C, 5% CO2). Then, COCs were rinsed three times in H-TCM119 medium to remove excess PI and examined under an inverted fluorescence microscope (Nikon Diaphot; Nikon) equipped with a standard filter set (excitation, 535 nm; emission, 617 nm). COCs were classified according to the proportion of the oocyte surface covered by cumulus cells stained with PI. Based on the extent of PI staining of cumulus cells, COCs were categorized into three classes: class 1, with less than 25% of the cumulus cells stained; class 2, with 25–50% of cumulus cells stained; and class 3, with more than 50% of cumulus cells stained [31, 32].
Ultrastructural analysis
For an in-depth investigation of cytoplasmic maturation, freshly isolated COCs from EAFs (n = 2), as well as those after LIVC in both singles (n = 2) and groups (n = 3), were fixed and processed for transmission electron microscopy (TEM) analysis. Fixation was performed in 2.5% glutaraldehyde in PBS solution. After fixation for 2–5 days at 4 °C, COCs were rinsed in PBS, post-fixed with 1% osmium tetroxide (Electron Microscopy Sciences) and rinsed again in PBS. COCs were then singularly embedded in small blocks of 1% agar of about 5 × 5 × 1 mm in size, dehydrated in ascending series of ethanol (Carlo Erba Reagenti, Milan, Italy), immersed in propylene oxide (BDH Italia, Milan, Italy) for solvent substitution and embedded in epoxy resin EMbed-812 (Electron Microscopy Sciences) for 48 h at 60 °C. Ultrathin Sects. (60–80 nm) were cut with a diamond knife, mounted on copper grids, and contrasted with Uranyless (Uranyl acetate alternative) (TAAB Laboratories Equipment Ltd., Aldermaston, UK) and lead citrate (Electron Microscopy Sciences). They were examined and photographed using a Zeiss EM 10 and a Philips TEM CM100 Electron Microscopes operating at 80 kV. The following parameters were evaluated: type and quality of organelles (e.g., vacuoles and mitochondria), the integrity of the oolemma and zona pellucida (ZP), and the appearance of intercellular contacts, including microvilli and transzonal projections [33].
Gap junction communications
To compare the functionality of gap junction communication (GJC), the fluorescent dye Lucifer Yellow (LY) was injected into oocytes before (n = 36) and after single (n = 23) and group culture (n = 26). Briefly, the COCs were transferred into a 50 µL drop of TCM199 supplemented with 0.4% BSA and covered with mineral oil. Subsequently, 8–10 nL (equivalent to 1% of the oocyte volume) of LY (5% w/v in 5 mM lithium chloride) was calculated and injected into the ooplasm using a Narishige microinjection apparatus (Narishige Co., Tokyo, Japan), as previously described [32, 34, 35]. Following a 10-min incubation (38.5 °C, 5% CO₂), dye diffusion into the surrounding cumulus cells was observed using an inverted fluorescence microscope (Nikon Diaphot; Nikon) equipped with a standard fluorescein filter set. Based on the extent of dye spread, COCs were categorized as follows: open, when the dye spread throughout the entire cumulus; partial, when the dye spread to only a limited portion of the cumulus; and closed, when the dye remained confined to the oocyte [32, 36, 37].
Oocyte diameter
Oocyte diameter was assessed as an indicator of oocyte quality and competency [38]. Briefly, healthy COCs (Grades 1 and 2) from both single (n = 227) and group (n = 281) cultures were selected, and their diameters were measured before and after LIVC using an inverted microscope equipped with a digital camera (Leica DFC450), LAS software (Leica Microsystems), and a heated stage (38.5 °C). Diameters were recorded along two perpendicular axes, excluding the zona pellucida.
Global transcriptional activity
To further assess the impact of culture conditions on oocyte development, the global transcriptional activity of oocytes was examined as an additional parameter. This analysis was carried out using the Click-iT® RNA Imaging Kit (Invitrogen, Thermo Fisher Scientific), as previously described [39]. Briefly, COCs before (n = 46) and after single (n = 26) and group culture (n = 32) were incubated with 2 mM 5-ethynyl uridine (EU) diluted in LIVC medium for 1 h at 38.5 °C under 5% CO2. Cumulus cells were mechanically removed using denuding pipettes. The oocytes were then washed in warm PBS/PVA, fixed in 4% PFA in PBS for 30 min, and washed again in PBS/PVA. Samples were permeabilized with 0.5% Triton-X 100 in PBS for 15 min, briefly washed in PBS/ PVA, and incubated in a Click-iT® reaction cocktail for 30 min. After further washing in Click-iT® reaction rinse buffer in PBS/PVA, oocytes were stained with Hoechst 33,342 for 15 min (10 µg/mL Hoechst 33,342 in PBS/PVA), and, after rinsing in PBS/PVA, mounted on a slide and observed with a Nikon Diaphot fluorescent microscope equipped with a standard fluorescein filter set. Transcriptional activity was classified as strong ( +), moderate (+ / −), or absent ( −) [40].
Chromatin configuration
Chromatin configuration was used as a marker of oocyte differentiation and competence acquisition [41]. In brief, the oocytes before (n = 100) and after single (n = 42) and group (n = 48) culture systems were denuded by gentle pipetting and washed with H-TCM199 with 4% BSA. They were then stained with Hoechst dye (5 µg/mL Hoechst 33,342 in H-TCM19 + 0.4% BSA) for 15 min (38.5 °C and 5% CO2) under mineral oil. Afterward, the oocytes were rinsed with H-TCM199 + 0.4% BSA and observed under a Nikon Diaphot fluorescent microscope with a standard fluorescein filter set. The oocytes at the GV stage were categorized based on their chromatin configuration (NSN, non-surrounded nucleolus, and SN, surrounded nucleolus), as described before [42].
Intracellular level of reactive oxygen species (ROS) and mitochondrial activity and distribution
To assess mitochondrial activity and ROS levels, oocytes were collected at different stages of the culture (before LIVC, after LIVC, and IVM) and underwent a concurrent triple staining procedure as previously described (Succu, et al., 2021). Initially, the oocytes before (n = 31) and after single (n = 18) and group (n = 15) cultures were immersed in phosphate-buffered saline containing 20% Fetal Calf Serum (PBS/20% FCS) and incubated for 30 min at 39 °C with Mito-Tracker Red CM-H2XRos (500 nM; MT-Red, Molecular Probes, Inc., Eugene, OR, USA). Subsequently, after undergoing three washes in PBS/20% FCS, the oocytes were subjected to a 20-min incubation in the same medium with 2′,7′-dichlorodihydrofluorescein diacetate (5 mM; H2DCF-DA, Molecular Probe, Eugene, OR, USA), a molecular probe designed for detecting reactive oxygen species (ROS). After exposure to probes, the oocytes were washed three times in PBS/20%FCS, fixed in 2.5% glutaraldehyde/PBS for at least 15 min, and stored (4 °C) until analysis. The oocytes were stained with Hoechst 33,342 and then mounted on a glass slide for evaluation using confocal microscopy (Leica TCS SP5 CLSM with Leica LAS Lite 170 Image software, Wetzlar, Germany). To assess mitochondrial function, samples were examined with a multiphoton laser to detect MitoTracker Red CM-H2XRos (excitation, 579 nm; emission, 599 nm).
Following IVM, the same procedure was used to analyze cultured COCs in both single (n = 13) and group (n = 16) cultures. The image analysis software (Leica LAS AF Lite) was used to record the mean fluorescence intensity values for subsequent statistical analysis. Furthermore, the mitochondrial distribution pattern was evaluated before culture (n = 34), as well as after single (n = 18) and group (n = 18) culture, and following IVM (n = 13 for single and n = 16 for group culture). The patterns were then classified into three distinct groups: “fine,” characterized by homogeneous small granulations dispersed throughout the cytoplasm; “granular,” with homogeneous large granulations distributed throughout the cytoplasm; and “clustered,” marked by particularly heterogeneous large granulations either spread across the entire cytoplasm or located in specific cytoplasmic domains [30].
Meiotic competence
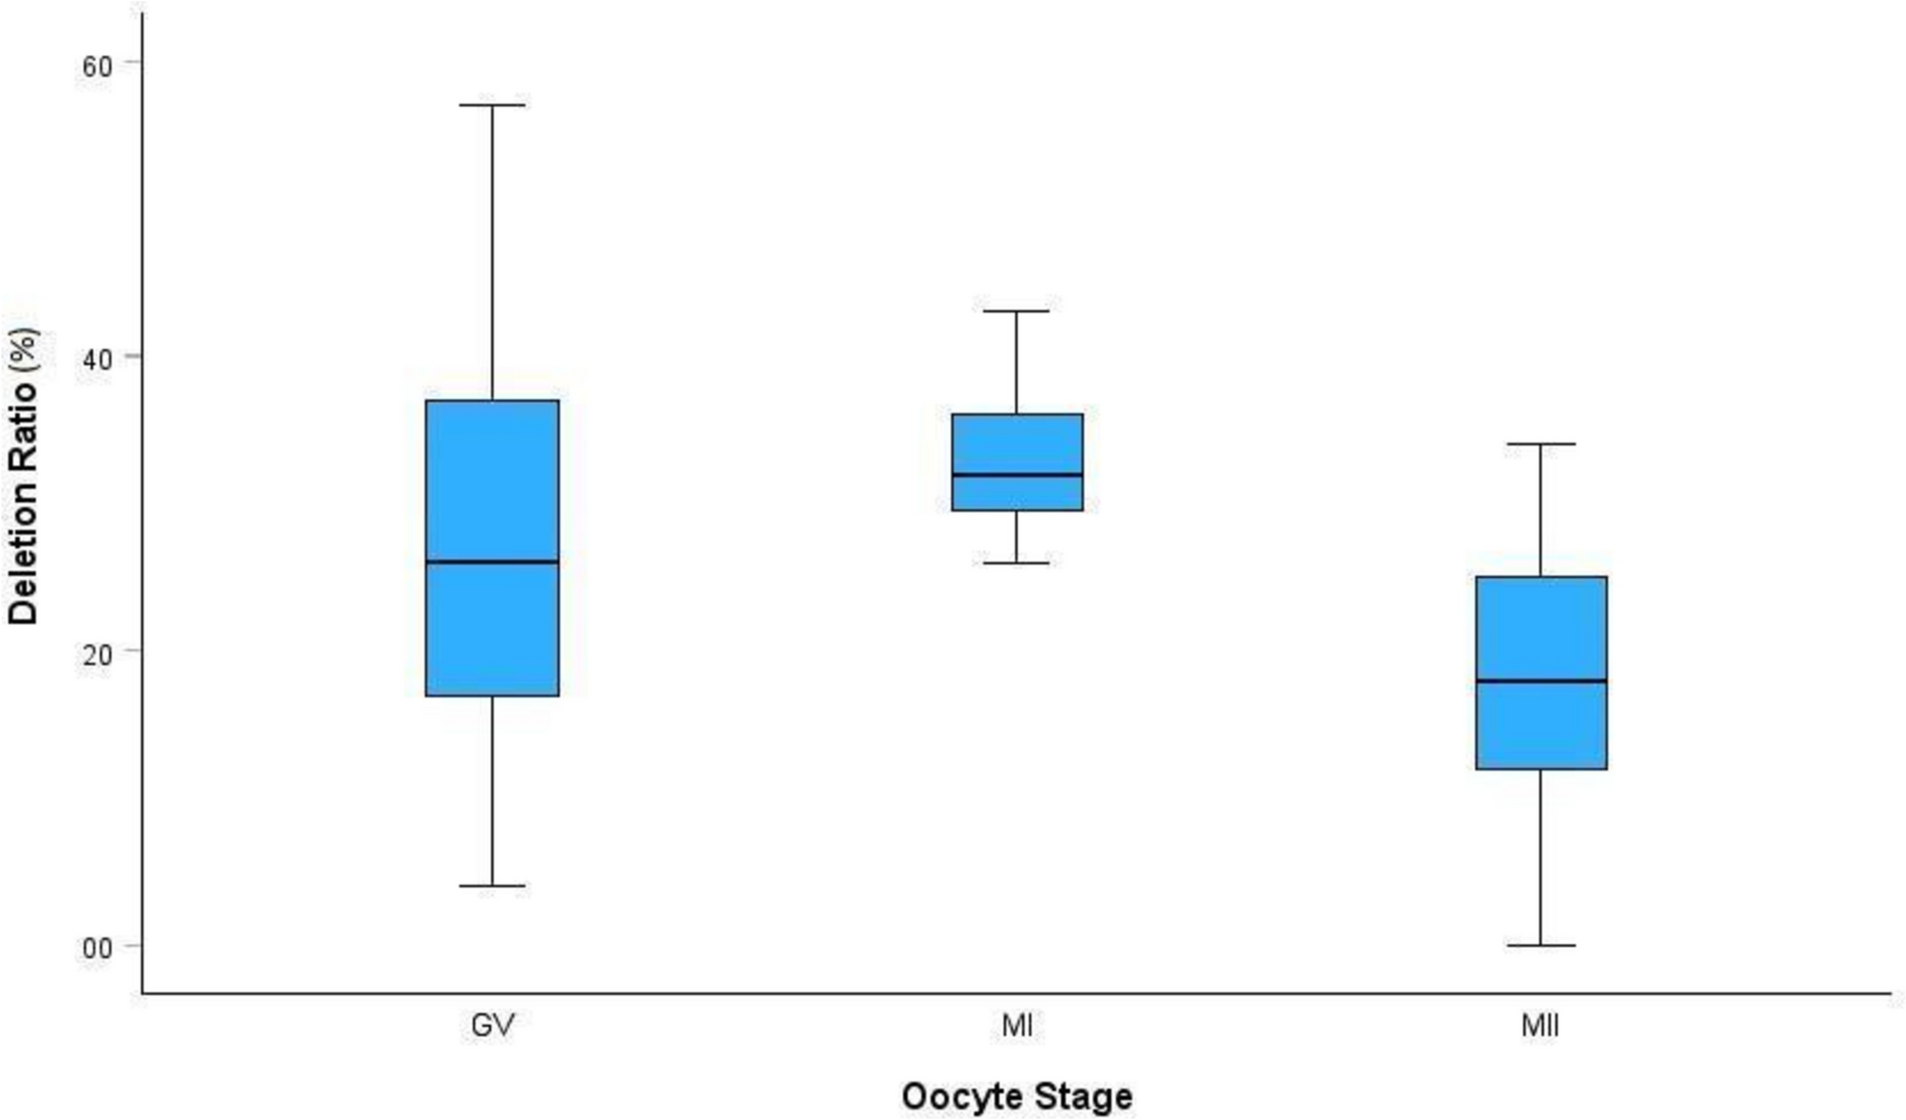
The meiotic competence was investigated by subjecting the COCs to standard IVM procedures. Freshly isolated oocytes from antral follicles (n = 80) and EAFs (n = 43), as well as oocytes from single (n = 46) and group (n = 42) cultures, were collected and washed in H-TCM199. Subsequently, they were incubated in a 4-well dish (15–20 COCs per well; Nunc, Thermo Scientific, USA) with 450 µL of IVM medium containing TCM-199 supplemented with 4 mg/mL BSA, 100 µM cysteamine, 0.3 mM sodium pyruvate, 1 µg/mL estradiol-17β, 40 µg/mL gentamicin, and 1 IU/mL Pluset (500 IU, p-FSH and p-LH, Serono). The dishes were covered with 200 µL of washed mineral oil, and the COCs were incubated at 38.5 °C in a humidified atmosphere of 5% CO2 for 24 h. The meiotic status of the oocytes was evaluated as described in the chromatin configuration assessment section. The oocytes were classified as GV (germinal vesicle), GVBD (germinal vesicle breakdown), MI (metaphase I), or MII (metaphase II).
Statistical analysis
All experiments were repeated at least three times. Data were analyzed using Minitab® Statistical Software 21.4.1.0 and are expressed as mean ± standard error of the mean (SEM). A Generalized Linear Model was employed to assess the statistical significance of variations observed in oocyte diameter, COCs morphology, viability, changes in GJCs, global transcriptional activity, and chromatin configuration. The active mitochondrial phenotypes were analyzed using the chi-square test. Maturation rate data, fluorescence intensity of mitochondrial activity, and intracellular ROS levels were subjected to one-way ANOVA followed by Tukey’s post hoc test to elucidate differences. Statistical significance was determined for probabilities with values less than 0.05.


Comments (0)