
Remember me
Psychiatric disorders can be classified using an internalizing versus externalizing model (Cerdá et al., 2010; Kendler et al., 1992; Krueger and Markon, 2006). Internalizing disorders are characterized by negative emotion, including depression, anxiety, and phobias, whereas externalizing disorders are characterized by behavioral disinhibition, including conduct disorder, antisocial behavior, and impulsivity. These internalizing and externalizing tendencies are associated with personality or temperament traits, such as neuroticism and sensation-seeking, that emerge early in development and are highly heritable (Bienvenu et al., 2001; Caspi et al., 1996; Clark et al., 1994; Jardine et al., 1984; Kagan and Snidman, 1999; Karlsson Linnér et al., 2021; Khan et al., 2005; Sanchez-Roige et al., 2018, 2019; Zuckerman and Cloninger, 1996; Zuckerman and Kuhlman, 2000). Thus, elucidating the genetic contribution to temperament could provide insight into the etiology of a variety of psychiatric and addictive disorders.
One compelling way to explore the genetic contribution to temperament is to selectively breed animals that show extreme behavioral traits. Selectively breeding laboratory rodents has confirmed the heritability of extreme anxiety-like and depressive-like behavior, risk-seeking, exploratory behavior, substance use, and hyperactivity (Almeida et al., 2018; Brush, 2003; Castanon et al., 1995; Commissaris et al., 1986; Filiou et al., 2014; Hendley et al., 1983; Jónás et al., 2010; Kessler et al., 2007; Overstreet et al., 1994; Rezvani et al., 2002; Terenina-Rigaldie et al., 2003; Weiss et al., 1998; Wigger et al., 2001). Within our laboratory, we have selectively bred rats for two decades for either a high propensity to explore a novel environment (high responders to novelty) or a low propensity to explore a novel environment (low responders to novelty) (Stead et al., 2006; Turner et al., 2017). We have found that this locomotor response to a novel environment (LocoScore) predicts a broader behavioral phenotype in our bred lines, akin to human temperament (Flagel et al., 2014; Turner et al., 2017). The bred high responders (bHRs) have high exploratory locomotion and disinhibited, sensation-seeking, externalizing-like behavior. They show greater impulsivity, low anxiety, and an active coping style. They are highly sensitive to reward cues, which can become attractive and reinforcing in a Pavlovian conditioned approach (PavCA) task (“sign-tracking”) (Flagel et al., 2011). In contrast, bred low responders (bLRs) have low exploratory locomotion and inhibited, internalizing-like behavior. They show elevated anxiety- and depressive-like behavior, stress reactivity, a passive coping style (Aydin et al., 2015; Clinton et al., 2014; Flagel et al., 2014, 2016; Turner et al., 2017), and primarily use reward cues for their predictive value (PavCA “goal-tracking”) (Flagel et al., 2011). These behavioral phenotypes appear early in development (Clinton et al., 2011; Turner et al., 2019) similar to temperament in humans (Mervielde et al., 2005; Saudino, 2005). Thus, the highly divergent bHR/bLR phenotypes model the heritable extremes in temperament predictive of internalizing and externalizing psychiatric disorders in humans. They can also model two paths to substance use disorders and addiction: sensitivity to reward cues and sensation-seeking makes bHRs more likely to initiate and re-initiate substance use, whereas bLRs increase substance use following stress (Flagel et al., 2014, 2016).
The extreme divergence in bHR/bLR behavior makes them a powerful model for investigating the heritable contributions to temperament. However, like all selective breeding models, the bHR/bLR lines are likely to be enriched with genetic alleles contributing to the behavioral phenotype as well as alleles that are merely in linkage disequilibrium with the causal locus. To hone in on causal loci for our selected behavioral phenotype, we used a classic method of producing a series of crosses (F0-F1-F2) to generate a heterogeneous sample with well-characterized lineage. We bred bHRs with bLRs from generation 37 (F0) to produce F1 cross offspring (Intermediate Responders, “IR”). These F1 offspring were then bred with each other to produce a re-emergence of diverse behavioral phenotypes in the F2 generation (Figure 1). We then performed exome and whole genome sequencing on the F0 and F2 rats (Chitre et al., 2023; Zhou et al., 2019) to reveal coding differences segregating the bHR/bLR lines (F0s) and chromosomal regions associated with variation in exploratory and anxiety-related behaviors in the F2 adults and juveniles [quantitative trait loci (QTLs)]. However, each of the loci associated with behavior (QTLs) in the F2 rats still encompassed many genetic variants segregated in the bHR/bLR rats, potentially influencing the expression of multiple, diverse genes. Thus, additional studies were necessary to pinpoint gene expression that might mediate functional effects on the brain leading to bHR/bLR behavior. This step is important, because the implicated genetic variants themselves are not necessarily translatable across species, or even across strains, but can guide us to causal pathways.

Figure 1. Experimental design: Crossbreeding bHR and bLR rats to identify genes implicated in exploratory, anxiety-like, and reward-related behaviors. After 37 generations of selectively breeding rats for a high or low propensity to explore a novel environment, we have generated two lines of rats [high responders to novelty (bHRs) or low responders to novelty (bLRs)] with highly divergent exploratory locomotion, anxiety-like behavior, and reward-related behavior [Pavlovian conditioned approach (PavCA)]. 1. Breeding Scheme: An initial set (F0) of bHRs were bred with bLRs to create 12 intercross families. The offspring of this intercross (F1) were then bred with each other to produce a re-emergence of diverse phenotypes in the F2 generation. 2. Behavior: All rats were assessed for locomotor activity in a novel environment (LocoScore) as well as exploratory and anxiety-like behavior in the elevated plus maze (EPM). For a subset of F2 rats, sensitivity to reward-related cues (Pavlovian Conditioned Approach (PavCA) behavior) was also measured. 3. Genotyping: To identify genomic loci associated with bHR/bLR phenotype (F0 population segregation) and behavior in F2 adults and F2 juveniles (quantitative trait loci, QTLs), exome sequencing was initially performed on both F0 and F2 rats (Zhou et al., 2019), followed by a broader genome wide association study (GWAS) (Chitre et al., 2023). Within the GWAS, the whole genome was deeply sequenced for the F0 rats. This whole genome sequencing (WGS) data was then used in conjunction with low pass (~0.25x) WGS data from the larger cohort of F2 rats to impute the genotype of 4,425,349 single nucleotide variants (SNPs) for each rat (Chitre et al., 2023). 4. Molecular Phenotyping: RNA-Seq was used to characterize gene expression in the hippocampus of a subset of male F0 and F1 rats (n = 6/subgroup), which was included in a cross-generational bHR/bLR meta-analysis (Birt et al., 2021). In our current study, RNA-Seq was used to characterize hippocampal gene expression in an independent set of males and females in the F0 (n = 24, n = 6 per phenotype per sex) and F2 (n = 250) rats to identify gene expression related to both bHR/bLR lineage and exploratory locomotion, anxiety-like behavior, and PavCA behavior.
Therefore, our goal in the current study was to obtain brain gene expression data from the F0 and F2 animals which could provide insight into the functional mechanisms mediating the influence of genetic variation on behavioral phenotype. We chose to focus on the hippocampus due to its importance in behaviors that diverge between our bred lines, including novelty processing, exploration, behavioral inhibition, emotional regulation, environmental reactivity, and stress-related responses (Campbell and Macqueen, 2004; Fanselow and Dong, 2010; Gerlach and McEwen, 1972; Gray, 1982; Johnson et al., 2012; Papez, 1937; Schwarting and Busse, 2017) The hippocampus has also been linked to the heritable component of anxious or inhibited temperament (Oler et al., 2010), and both internalizing and externalizing disorders (Campbell and Macqueen, 2004; Hoogman et al., 2017; Schmaal et al., 2016). Importantly, previous investigations found pronounced bHR/bLR differences in hippocampal function both in adulthood and early in development (Birt et al., 2021; Clinton et al., 2011; McCoy et al., 2019; Perez et al., 2009; Simmons et al., 2012; Turner et al., 2008; Widman et al., 2019), suggesting that it might be a key region in the generation of the phenotype.
To identify the genes and biological pathways that shape temperament, the present study triangulated the newly-collected functional genomics data with previously-collected behavioral and genetic data (Figure 2). We first used RNA-Sequencing of hippocampal tissue from both male and female bHRs and bLRs (F0, n = 24) to confirm and expand upon our earlier results from a cross-generational meta-analysis of hippocampal gene expression in bHR versus bLR males (Birt et al., 2021). We then performed RNA-Sequencing of hippocampal tissue from a large sample of heterogeneous F2 intercross rats (n = 250) to identify differential expression that continued to correlate with exploratory locomotion, anxiety-like behavior, and reward-related behavior independent of the linkage disequilibrium and genetic drift specific to our bred lines. To determine generalizability, we compared these results to hippocampal differential expression from other rat models and to bHR/bLR differential expression in other brain regions. Then, to determine which differential expression was most likely to be driven directly by genetic variation, we integrated our current F2 RNA-Seq data with previous whole genome sequencing results (Chitre et al., 2023) to identify genes with expression tightly correlated with proximal genetic variation (expression QTLs: cis-eQTLs). We determined which of these cis-eQTLs were segregated in the bHR/bLR lines and co-localized with the loci that we had previously linked to behavior (QTLs) within the larger F2 sample [adults and juveniles: Chitre et al., 2023]. This converging evidence revealed a set of differentially expressed genes that are particularly strong candidates for mediating the neurobiology of temperament.
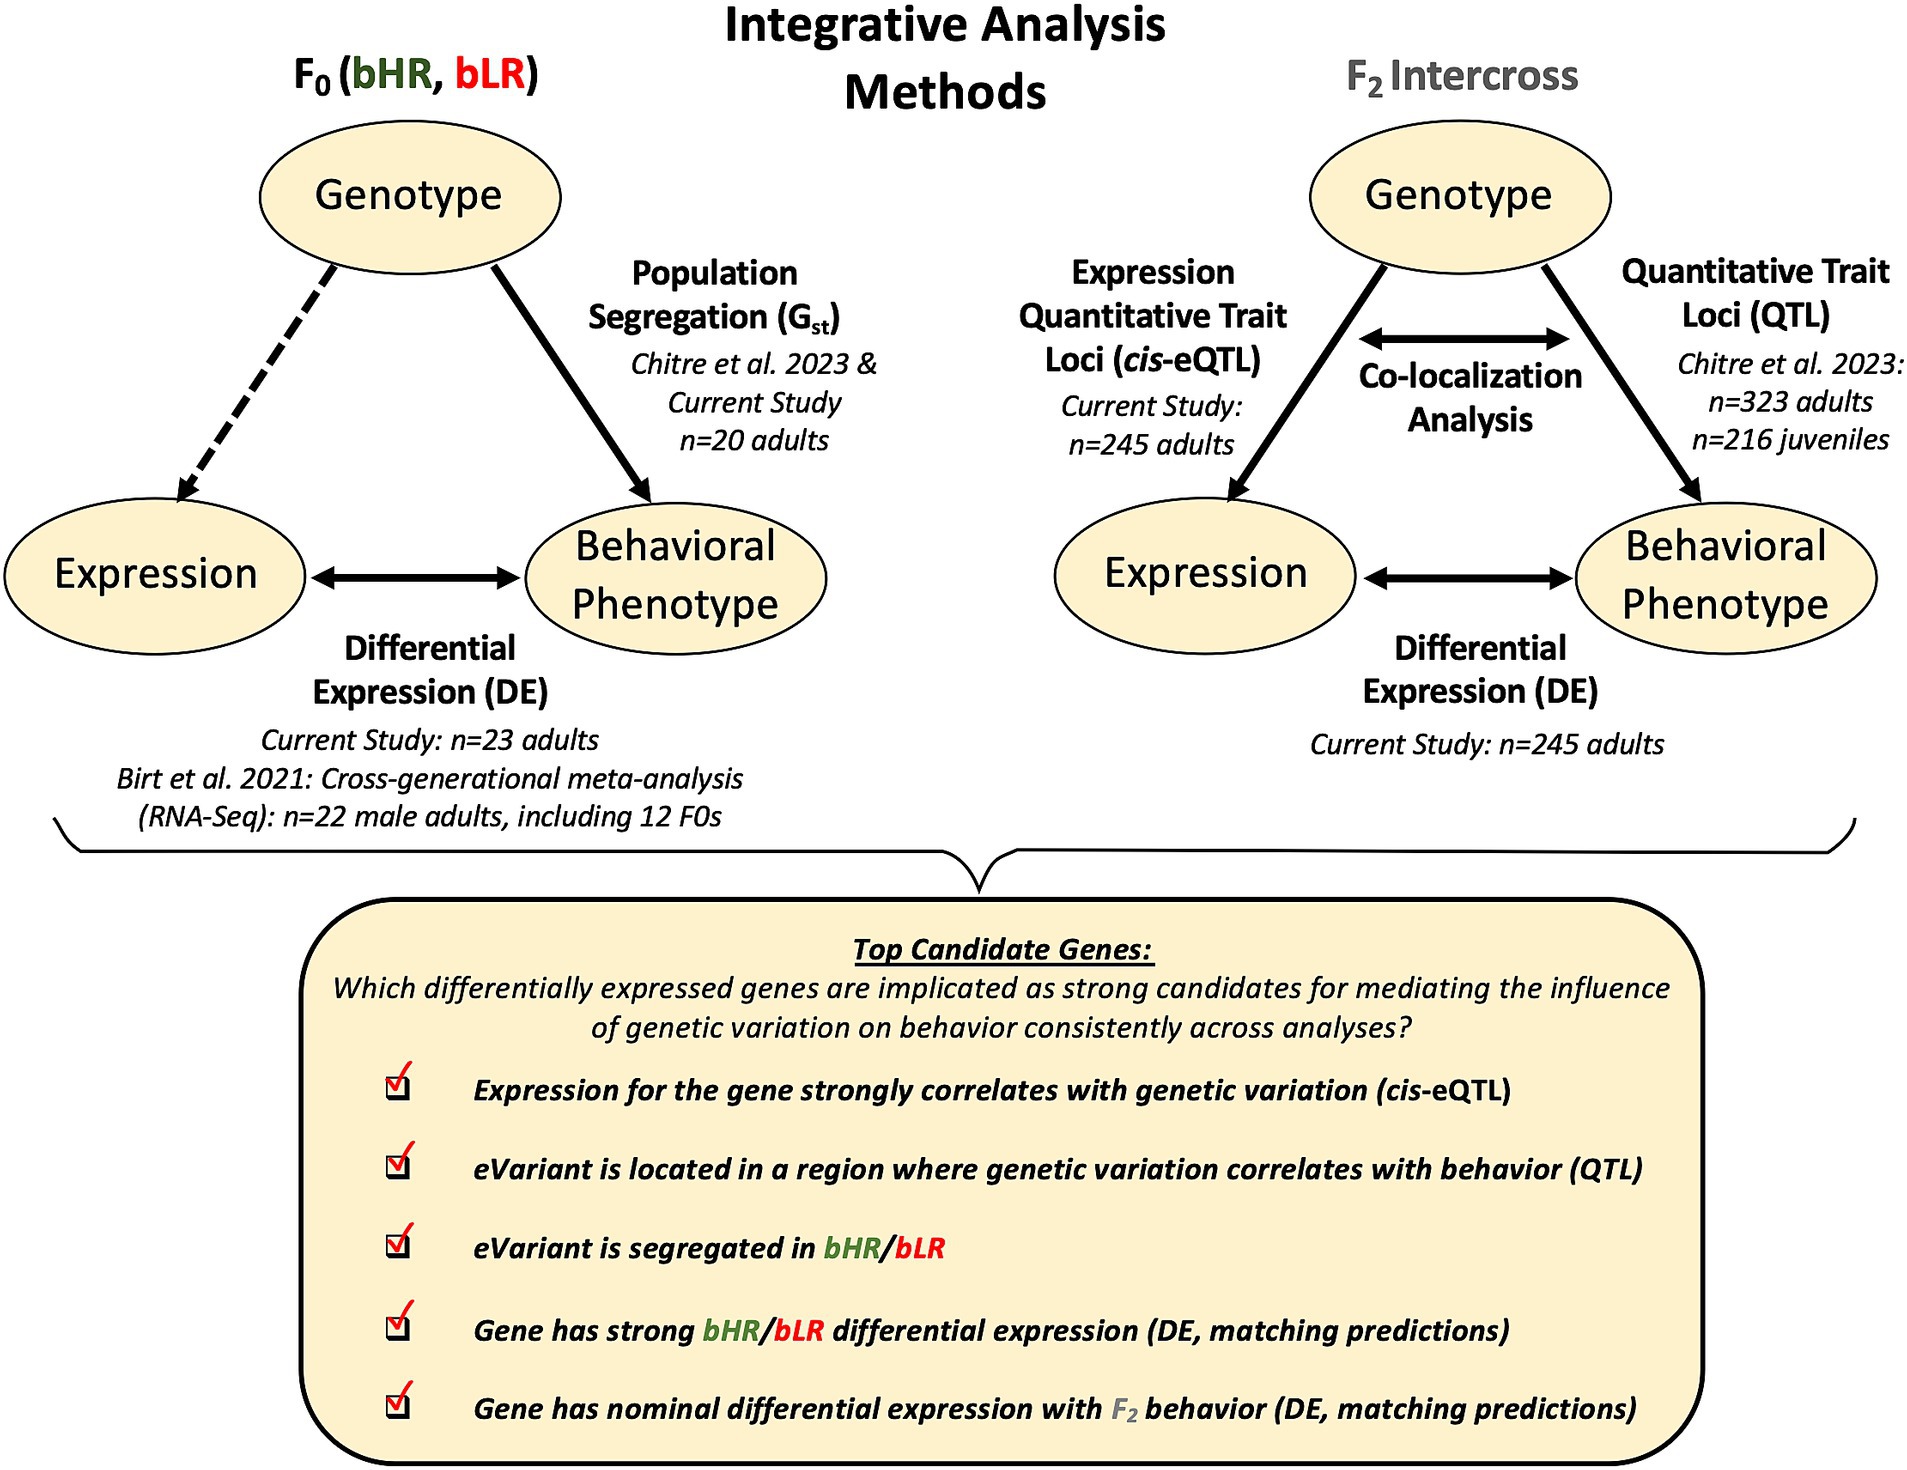
Figure 2. Analysis methods: Using convergent evidence to identify differentially expressed genes that are the strongest candidates for mediating the influence of genetic variation on behavioral temperament. We first identified expression in the hippocampus that differentiated the bHR and bLR lines, using information from both our current F0 sample and previous cross-generational meta-analysis. We then identified gene expression that continued to correlate with bHR/bLR divergent behaviors in our large F2 intercross sample, indicating that the differential expression (DE) was not an artifact of genetic drift. To determine which DE was most likely driven by proximal genetic variation, we performed a cis-expression Quantitative Trait Loci (cis-eQTL) analysis to determine which genes (eGenes) had expression that strongly correlated with nearby genetic variants (eVariants) using the F2 genotype and F2 gene expression data, and then estimated the magnitude of that effect in Log2 fold change units (allelic fold change or aFC). We determined which eVariants were segregated in the bHR/bLR lines and confirmed that the predicted effect of this genetic segregation on gene expression matched the bHR/bLR DE observed in the F0s. We also determined which eVariants co-localized in regions of the genome previously identified as having strong relationships with behavior in the full sample of F2 adults and F2 juveniles (QTLs) using Summary-Data Based Mendelian Randomization (SMR) and compared the predicted direction of effect of this genetic variation on gene expression to the DE observed in the F2 adults in association with behavior. Finally, to be considered a top candidate gene for mediating the influence of genetic variation on behavioral temperament, we required that a gene have hippocampal DE related to both bHR/bLR phenotype and F2 behavior which appeared plausibly driven by genetic variation (cis-eQTL) that segregated in the bHR/bLR lines and correlated with behavior (SMR colocalization with QTL). Note that the sample sizes listed in the diagram reflect the sample sizes used in the analysis following quality control.
2 Materials and methodsFull methods are in the Supplementary material, including the ARRIVE reporting checklist. Analysis code (R v.3.4.1-v.4.2.2, R-studio v.1.0.153-v.2022.12.0+353) has been released at https://github.com/hagenaue/NIDA_bLRvsbHR_F2Cross_HC_RNASeq.
All procedures were conducted in accordance with the National Institutes of Health Guide for the Care and Use of Animals and approved by the Institutional Animal Care and Use Committee at the University of Michigan.
2.1 AnimalsSelectively breeding rats for high or low locomotor activity in a novel environment (LocoScore) produced the bHR line (Wakil:bHR, RRID:RGD_405847397) and bLR line (Wakil:bLR, RRID:RGD_405847400), respectively (Stead et al., 2006). After 37 generations, 12 bHRs and 12 bLRs (F0) were chosen from 24 distinct families to crossbreed. The F1 offspring with similarly high or low LocoScores were then bred with each other to produce a re-emergence of diverse behavioral phenotypes in the F2 generation (Figure 1). These 48 F2 litters generated 540 rats [n = 216 behaviorally phenotyped as juveniles (1 month old), n = 323 behaviorally phenotyped as young adults (2–4 months old)]. Our current study sampled a subset of the adults (F0: n = 24, n = 6/phenotype per sex; F2: n = 250, n = 125/sex) that overlapped with previous genetic studies (Chitre et al., 2023; Zhou et al., 2019) but was distinct from our previous male-only meta-analysis (Birt et al., 2021).
2.2 Behavioral analysisBehavioral phenotyping for the F0 and F2 rats used in our current study was performed in adulthood, in the morning, with each test occurring on separate days. Testing order was counterbalanced for phenotype (bHR/bLR), with males tested before females on separate days. All F0 and F2 rats were tested for locomotor activity in a novel environment (protocol: Stead et al., 2006). During testing, rats were placed in a box akin to their home cage but located in a different room with novel cues. Over 60 min, lateral and rearing movements were counted via beam breaks, and the cumulative total defined as locomotor score (LocoScore). All F0 and F2 were tested for exploratory and anxiety-related behaviors on an EPM [dimly lit (40 lux), protocol: Chitre et al., 2023]. Rats began the five-minute test at the intersection of the arms. A video tracking system (Ethovision, Noldus Information Technology) recorded the percent time spent in the open and closed arms, distance traveled (cm), and time immobile (sec). A subset of F2s (n = 209) subsequently underwent seven sessions of PavCA training to measure their bias in favor of reward cues over the reward itself (protocol: Meyer et al., 2012). To create a summary PavCA Index, three behavioral variables were averaged: (1) Probability difference: the probability of lever contact minus the probability of food magazine entries, (2) Response bias: the total conditioned stimuli (CS: lever) contacts minus the total food magazine entries, divided by the sum of the two behaviors. (3) Latency score: the average latency to enter the food magazine minus the average latency to contact the lever, divided by the length of the CS duration (8 s). The PavCA Index for the last 2 days of testing (days six and seven) was used to classify rats as “sign trackers” (ST: values > 0.5), “intermediate” (IN: values −0.5 to 0.5), or “goal trackers” (GT: values < −0.5).
For each of the continuous behavioral variables, the interacting effects of sex and phenotype (F0 bHR vs. F0 bLR vs. F2) were examined using analysis of variance (ANOVA type 3, contrasts = “contr.sum”). Exploratory analyses were also performed to examine the potential effect of batch-related variables, testing order, maternal lineage, and paternal lineage. Correlations between behaviors were characterized in the F0 and F2 datasets separately using parametric methods (Pearson’s R, simple linear model). For the F0s, Lineage was included as a dummy variable (bHR as reference 0, bLR coded as 1). For PavCA, a Fisher’s Exact Test was performed on the ratios of male to female animals classified as ST, IN, or GT.
2.3 Tissue dissection, RNA extraction, and sequencingAdults (postnatal days 113–132) were decapitated without anesthesia and brains rapidly extracted (<2 min). For the F0s, whole hippocampus was immediately dissected and flash frozen. For the F2s, whole brains were flash frozen, and later hole punches from the dorsal and ventral hippocampus were pooled from four hemisected coronal slabs per rat (−2.12 to −6.04 mm Bregma; Paxinos and Watson, 2013). RNA was extracted using the Qiagen RNeasy Plus Mini Kit. A NEB PolyA RNA-seq library was produced and sequenced using a NovaSeq S4 101PE flowcell (targeting 25 million reads/sample).
2.4 Hippocampal RNA-Seq analysisRNA-Seq data preprocessing was performed using a standard pipeline including alignment (STAR 2.7.3a: genome assembly Rnor6), quantification of gene level counts (Ensembl v103, Subread version 2.0.0), and basic quality control. All downstream analyses were performed in Rstudio (v.1.4.1717, R v. 4.1.1). Transcripts with low-level expression (<1 read in 75% of subjects) were removed. Normalization included the trimmed mean of M-values (TMM) method (Robinson and Oshlack, 2010, edgeR v.3.34.1; Robinson et al., 2010), and transformation to Log2 counts per million [Log2 cpm (Law et al., 2016), org.Rn.eg.db annotation v.3.13.0; Carlson, 2019]. Following quality control, the F0 dataset contained n = 23 subjects (subgroups: n = 5 bHR females, n = 6 for each of the other subgroups: bHR males, bLR females, bLR males) with Log2 cpm data for 13,786 transcripts, and the F2 dataset contained n = 245 subjects (subgroups: n = 122 males, n = 123 females) with Log2 cpm data for 14,056 transcripts.
Differential expression was calculated using the limma/voom method (Law et al., 2014, package: limma v.3.48.3) with empirical Bayes moderation of standard error and FDR correction. For the F2s, the same differential expression model was used for each variable of interest (LocoScore, EPM % time in open arms, EPM distance traveled, EPM time immobile, PavCA Index). Technical co-variates were included if they were strongly related to the top principal components of variation identified using Principal Components Analysis (PCA) or had confounding collinearity with variables of interest [covariates: percent of reads that were intergenic (%intergenic) or ribosomal RNA (%rRNA), dissector, sequencing batch, and PavCA exposure (“STGT_Experience”)].
Equation 1: F0 differential expression model:
y~β0+β1Lineage+β2Sex+β3%rRNA+β4%Intergenic+ε (1)Equation 2: F2 differential expression model:
y~β0+β1VariableOfInterest+β2Sex+β3%rRNA+β4%Intergenic+β5Dissector+β6STGT_Experience+β7−8SequencingBatch+ε (2) 2.5 Comparison of F0, F2, and previous hippocampal meta-analysis resultsThe full F0 and F2 differential expression results were compared to our previous meta-analysis of hippocampal RNA-Seq studies from late generation bHR/bLR males (Supplementary Table S2 in Birt et al., 2021) using parametric and non-parametric methods (Pearson’s and Spearman’s correlation of Log2FC values) and visualized using gene rank-rank hypergeometric overlap [RRHO v. 1.38.0 (Plaisier et al., 2010; Rosenblatt and Stein, 2014), ranking by t-statistics] and VennDiagram [v.1.7.3 (Chen, 2022)]. For downstream analyses, we defined bHR/bLR differentially expressed genes as the 1,063 genes with FDR < 0.10 in either the F0s or late generation meta-analysis, or nominal replication (p < 0.05) in both with consistent direction of effect.
2.6 Comparison of bHR/bLR hippocampal results to findings from other regionsAs an exploratory analysis, we compared bHR/bLR hippocampal differential expression to the pattern of differential expression in other brain regions in previous small transcriptional profiling studies of bHR/bLR adults, including publicly available data from the amygdala [GSE88874: n = 5/group, generation F31 (Cohen et al., 2015; McCoy et al., 2017), GSE86893: n = 6/group, generation F34-F36 (Cohen et al., 2017)] and dorsal raphe [GSE86893, n = 6/group (Cohen et al., 2017)], and unpublished data from the cortex (GSE286181, n = 6/group) and hypothalamus (GSE286181, n = 6/group) from an early generation of selective breeding (F4). To run this comparison, differential expression was calculated for each dataset using the limma pipeline (Supplementary methods). To reduce noise and increase statistical power, we used a standardized pipeline (Hagenauer M. et al., 2024) to perform a simple random effects meta-analysis (Viechtbauer, 2010, package: metafor) to summarize the amygdala differential expression results (collective sample size of n = 11/group for 7,133 genes), and—to potentially identify bHR/bLR differences that might exist brain-wide—all non-hippocampal differential expression results (collective n = 29/group for 11,509 genes). These results were compared to our hippocampal findings using non-parametric methods [Spearman’s correlation of Log2FC values and RRHO v. 1.38.0 (Plaisier et al., 2010; Rosenblatt and Stein, 2014), ranking by t-statistics].
2.7 Gene set enrichment analysisTo elucidate functional patterns, we ran Gene Set Enrichment Analysis (fgsea v.1.2.1, nperm = 10,000, minSize = 10, maxSize = 1,000, FDR < 0.05) using a custom gene set database (Brain.GMT v.1, Hagenauer M. H. et al., 2024) that included standard gene ontology, brain cell types, regional signatures, and differential expression results from public databases. We created a continuous variable representing bLR-like vs. bHR-like differential expression for each gene by averaging the t-statistics for bLR vs. bHR comparisons in the F0 dataset and former late generation RNA-Seq meta-analysis (Birt et al., 2021) and for each of the F2 behaviors (with bHR-like phenotype set as reference). A second non-directional analysis used the absolute value of the average t-statistic.
2.8 Constructing a hippocampal cis-eQTL databaseHippocampal cis-eQTL mapping was performed using published methods Munro et al. (2022, unpublished). Quality-controlled F2 RNA-Seq data (Log2 CPM, n = 245 following quality control) was corrected for technical covariates (Equation 2, residualized), followed by rank-based inverse normal transformation ((see footnote 1) Ongen et al., 2016). F2 genotypes were generated by low coverage whole genome sequencing followed by imputation (from data release for (Chitre et al., 2023): doi: 10.6075/J0K074G9, n = 4,425,349 SNPs). Principal Components Analysis was run on the gene expression matrix and genotype matrix [following pruning for linkage disequilibrium, Plink2 v.2.00a2.3 (Chang et al., 2015)], and principal components 1–5 from both analyses included as covariates within the single-SNP linear regression for cis-eQTL mapping [tensorQTL v.1.0.6 (Taylor-Weiner et al., 2019)]. We tested SNPs with minor allele frequency (MAF) >0.01 within ±1 Mb of each gene’s transcription start site (tss). A significant eVariant-eGene relationship (cis-eQTL) was defined using empirical beta-approximated p-values calculated using permutations for each gene, and false discovery corrected (FDR < 0.05) using results from the top SNP for all genes. When SNPs were in perfect linkage disequilibrium, a single SNP was selected randomly. Additional, conditionally independent cis-eQTLs for each eGene were identified using stepwise regression (tensorQTL: default settings). We estimated cis-eQTL effect size (allelic fold change, aFC) using an additive cis-regulatory model (package aFC.py) with raw expression read counts and the same covariates as cis-eQTL mapping (Mohammadi et al., 2017).
2.9 Predicting bHR/bLR differential expression using the cis-eQTL databaseWe extracted F0 genotype information for each eVariant (n = 10 bHR/n = 10 bLR in Chitre et al., 2023, release: doi: 10.6075/J0K074G9) using VcfR (v1.14.0, Knaus and Grünwald, 2017). We defined partial bHR/bLR segregation using myDiff() Gst’ > 0.27 [(Hedrick, 2005), akin to all 0/0 vs. all 0/1 in our dataset]. We assigned the direction of effect for the Log2 aFC to reflect the bLR-enriched allele vs. bHR-enriched allele and compared these predictions to both the F0 differential expression results (Log2FC) and bHR/bLR late generation RNA-Seq meta-analysis results (estimated d) using parametric (linear regression) and non-parametric (Spearman’s rho) methods.
2.10 Co-localization of cis-eQTLs with regions of the genome associated with bHR/bLR-like behaviorWe used Summary Data-based Mendelian Randomization (SMR; Zhu et al., 2016) to test for colocalization of cis-eQTLs with QTLs from the full F2 cohort [GWAS results: (Chitre et al., 2023)] for adult behaviors included in our differential expression analysis (LocoScore, EPM time immobile, EPM distance traveled, EPM % time in open arms, PavCA Index) and juvenile behaviors targeting analogous traits (open field (OF) time immobile, OF distance traveled, OF % time in center). Z-scores for the cis-eQTL and GWAS associations with each top eVariant were used to calculate the SMR approximate chi-squared test statistic, with p-values determined using the chi-squared distribution’s upper tail [df = 1, FDR correction: mt.rawp2adjp() (proc = “BH”) in multtest v.2.26.0 (Pollard et al., 2005)]. Results were visualized using the manhattan() plot function in the qqman package [v.0.1.8 (Turner, 2018)].
To determine whether the strength of cis-eQTL/QTL co-localization (SMR t-statistic) correlated with F2 behavioral differential expression, we assigned a predicted direction of effect based on the relationship between genotype and behavior within the larger F2 sample (adults: n = 323 adults, juveniles: n = 216) and genotype and expression within the cis-eQTL analysis (n = 245). We then examined the correlation between the F2 Log2FCs for each adult behavior and the “directional” SMR T-statistics for the same adult behavior or analogous juvenile behavior (OF distance traveled, OF time immobile, OF % time in center), both in the full dataset (all 5,937 cis-eQTLs) and within the subset of cis-eQTLs that we had already confirmed were segregated in bHR/bLRs in a manner predictive of bHR/bLR differential expression (492 cis-eQTLs representing 456 eGenes).
To narrow down our pool of top candidate genes for mediating the effect of genetic variation on behavior, we required that our final top candidate genes have expression strongly related to genetic variation (cis-eQTLs) that is segregated in bHR/bLR (Gst’ > 0.27) in a manner that correctly predicts bHR/bLR differential expression and is co-localized with a QTL for behavior (SMR FDR < 0.10) in a manner that correctly predicts F2 differential expression. Using a conservative estimate (Supplementary methods), this convergence of results should only be observable once, at most, in our dataset due to random chance.
3 Results 3.1 Locomotor activity in a novel environment reflects a broader behavioral temperament in both selectively-bred bHR/bLR lines and F2 intercross ratsThe bHR/bLR (F0) crossbreeding scheme produced F2 animals with behaviors ranging between the more extreme bHR and bLR phenotypes [all behaviors: p < 1.5e-06 for effect of group (F0 bHR vs. F0 bLR vs. F2); examples: Figures 3A,B; Supplementary Figure S4, full statistics: Supplementary Table S1]. F2 behavior sometimes appeared more similar to bLRs than bHRs (e.g., Figure 3B) suggesting a floor effect or that genetic contributions to internalizing-like behavior may be more dominant.
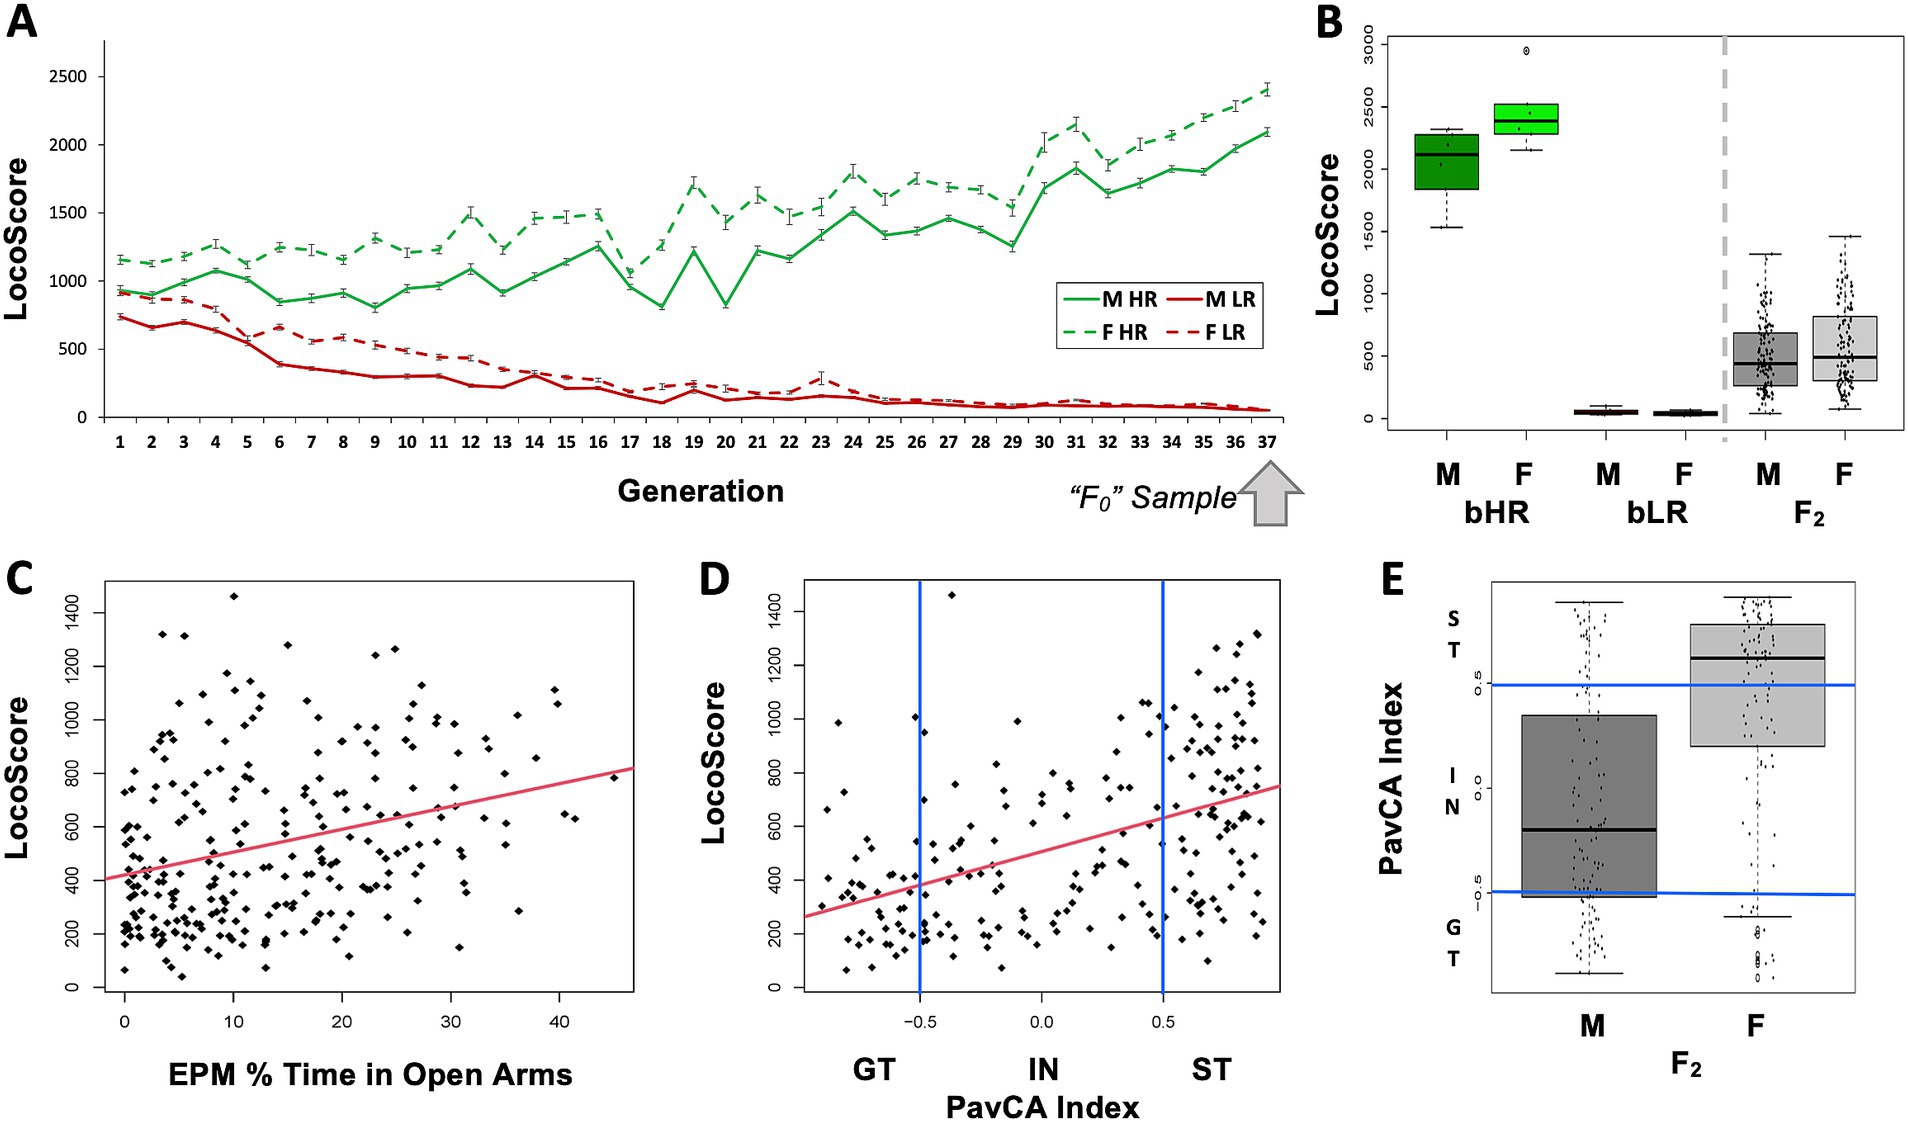
Figure 3. Behavioral phenotype: Locomotor activity in a novel environment reflects a broader behavioral temperament in both selectively-bred bHR/bLR lines and F2 intercross rats. (A) Locomotion in a novel environment (LocoScore: lateral + rearing counts over 60 min) is strongly influenced by genetics, as indicated by the divergence in LocoScore observed following the selective breeding of the bHR/bLR lines in both males (M) and females (F). The “F0” animals used in our crossbreeding experiment were taken from the 37th generation of selective breeding. (B) The bHR/bLR (F0) crossbreeding scheme produced F2 rats with intermediate behavior which fell between the extreme bHR and bLR phenotypes. Depicted are the LocoScores for the F0 and F2 rats included in the current RNA-Seq experiment (effect of group: F(2, 268) = 212.764, p < 2.2E-16). The graphs for other measured behaviors (EPM Distance traveled, EPM time immobile, EPM % Time in Open Arms) are in Supplementary Figure S4. For all measured behaviors, group differences (ANOVA: F0 bHR vs. F0 bLR vs. F2) were highly significant (p < 1.5e-06, Supplementary Table S1). (C,D) Behaviors that diverged during bHR/bLR selective breeding for LocoScore remained correlated in F2s. Example scatterplots illustrate correlations between LocoScore and other bHR/bLR distinctive behaviors in the F2s. Red lines illustrate the relationship between the variables across both sexes. The correlations between all variables can be found in Supplementary Figure S4 and Supplementary Table S2. (C) Greater LocoScore predicted greater EPM % Time in Open Arms in the F2s (R = 0.30, p = 1.72E-06). Greater time spent in the open arms of the EPM is typically interpreted as indicating low anxiety. (D) Most F2s (n = 209) were tested for PavCA behavior. Greater LocoScore predicted an elevated PavCA Index in the F2s (R = 0.46, p = 3.22E-12). Rats with greater PavCA Index (>0.5) are considered sign-trackers (ST) and rats with lower PavCA Index (<−0.5) are considered goal-trackers (GT). (E) All behavioral variables showed a significant sex difference (p < 0.007) except for LocoScore. As an example, sex differences in PavCA index are illustrated with a boxplot. A higher percent of females than males were classified as Sign Trackers (ST) vs. Goal Trackers (GT) (Intermediate = IN) (Fisher’s exact test: p = 1.472E-06, OR: 0.13; CI: 0.05–0.34). These observed behavioral sex differences are difficult to interpret, as the two sexes were tested on all tasks in separate batches but supported the inclusion of sex as a covariate in all statistical models.
Exploratory locomotion, anxiety-like behavior, and PavCA behavior remained strongly correlated within the F2s, as previously observed in the bHR/bLR lines (examples: Figures 3C,D; Supplementary Figure S4, full statistics: Supplementary Table S2). Although these behaviors often differed by sex (example: Figure 3E, Supplementary Figure S4, full statistics: Supplementary Table S1), sex differences were not responsible for driving the correlation between different behaviors (with sex in the model: all behavior–behavior relationships still p < 0.0284). These findings are consistent with results using the full F2 cohort (Chitre et al., 2023) and imply that locomotor activity in a novel environment echoes a broader behavioral temperament, reflecting genetic and environmental influences shared across anxiety, mood, and reward-related behaviors.
3.2 F0 RNA-Seq: selective breeding produced a robust molecular phenotype in the hippocampus that surpassed the effect of sexThe hippocampus plays an important role in many processes relevant to bHR/bLR behavioral phenotype, including novelty processing, exploratory behavior, behavioral inhibition, emotional regulation, environmental reactivity, and stress-related responses. We observed robust bHR/bLR differential expression in the hippocampus. Within the F0 RNA-Seq dataset, there were 131 differentially expressed genes with elevated expression in bLRs versus bHRs, and 86 differentially expressed genes with higher expression in bHRs (False Detection Rate (FDR) < 0.10, Figures 4A,C, Supplementary Table S3). In contrast, despite the observed sex differences in behavior, there were only 21 genes upregulated in females (versus males) and 22 genes upregulated in males (versus females) (Figures 4B,C, Supplementary Tables S3, S4). The effect sizes (Log(2) Fold Changes, or Log2FC) for bHR/bLR differentially expressed genes were also larger than those for sex, with the exception of a few X and Y chromosome genes (Figures 4A,B, Supplementary Tables S3, S4). There were no significant interactions between the effects of Lineage and Sex on gene expression (FDR > 0.10), but our sample size was underpowered to detect these effects (n = 5−6/subgroup). The presence of robust bHR/bLR hippocampal differential expression in both male and female F0s replicated previous male-only studies (Birt et al., 2021).

Figure 4. A robust hippocampal (HPC) molecular phenotype: There was greater hippocampal differential expression associated with F0 bHR/bLR lineage than with sex. Differential expression associated with bHR/bLR Lineage and Sex were examined in the same dataset (F0) with comparable subgroup sample sizes (total n = 23). Shown are two volcano plots illustrating the differential expression associated with bHR/bLR phenotype (A) and sex (B). For both volcano plots, red depicts genes with a log2 fold change (Log2FC) > 1.0, green depicts genes with a False Discovery Rate (FDR) < 0.1, and gold indicates genes satisfying both criteria. In (A), the reference group was defined as bHR, therefore positive Log2FC coefficients indicate upregulation in bLRs, and negative Log2FC coefficients indicate upregulation in bHRs. In (B), males served as the reference group, therefore positive Log2FC coefficients indicate upregulation in females (F), and negative Log2FC coefficients indicate upregulation in males (M). For ease of visualization, six X and Y chromosome genes were not plotted due to extreme p-values (ranging from p = 5.71E-13 to 8.97E-26: Kdm5d, Eif2s3y, Uty, Ddx3, ENSRNOG00000055225, AABR07039356.2). The summary table (C) shows the number of differentially expressed genes (DEGs) for bHR/bLR Lineage and Sex. The full F0 bHR/bLR differential expression results can be found in Supplementary Table S3 and the full F0 differential expression results for Sex can be found in Supplementary Table S4.
3.3 Current F0 study replicated bHR/bLR gene expression differences detected in previous studiesThe bHR/bLR hippocampal differential expression in our current study replicated many effects observed in our previous meta-analysis of hippocampal transcriptional profiling studies in bHR/bLR males (Birt et al., 2021), with the F0 Log2FC correlating positively with the bLR versus bHR estimated effect size (d) observed in RNA-Seq data from later generations (Figures 5A,B). Sixty-two of the 984 bHR/bLR differentially expressed genes in either dataset (FDR < 0.10) were significant (FDR < 0.10) in both datasets (Figure 5C, Supplementary Table S3). More genes showed replication of nominal bHR/bLR effects (p < 0.05) with consistent direction of effect in both datasets, so that, in total, 1,063 genes had evidence of bHR/bLR differential expression in the hippocampus (Figures 5D,E, Supplementary Table S3). As many generations of selective breeding for a behavioral phenotype are likely to produce an enrichment of eQTL alleles influencing the phenotype, these 1,063 genes were prioritized in downstream analyses.

Figure 5. The current F0 study in males and females replicated bHR/bLR differential expression (DE) detected in previous male-only hippocampal (HPC) studies. (A) A scatterplot illustrates the positive correlation (n = 11,175 genes, R = 0.35, p < 2.2E-16) between the bHR/bLR effect sizes from our current F0 dataset (bLR vs. bHR Log2FC for all genes) and the bLR vs. bHR effect sizes identified by our previous late generation RNA-Seq meta-analysis ((Birt et al., 2021): bLR vs. bHR estimated Cohen’s d for all genes). Genes with particularly large effects in both datasets are labeled in green (upregulated in bHRs) or red (upregulated in bLRs). (B) This positive correlation is also visible when using a non-parametric analysis of the results ranked by t-statistic, as illustrated with a two-sided Rank-Rank Hypergeometric Overlap (RRHO) plot. Warmer colors illustrate the strength of the overlap [−log10(p-value)], with the visible red diagonal indicating a positive correlation between the ranked results. (C–E) To identify the strongest bHR/bLR differentially expressed genes (DEGs) for use in downstream analyses, we referenced results from both the current F0 dataset and previous late generation RNA-Seq meta-analysis (Birt et al., 2021). Shown are three Venn diagrams illustrating the overlap of the DEG lists from the two studies, with DE defined either using a traditional threshold of FDR < 0.10 in either study (C) or using a nominal p-value threshold (p < 0.05) and a specified direction of effect [(D): upregulated in bLR vs. bHR, (E): upregulated in bHR vs. bLR]. In each case, the overlap exceeded what would be expected due to random chance (OR > 4.7, p < 2.2e-16). The 1,063 unique genes with either FDR < 0.10 in either study or nominal replication with a consistent direction of effect in both studies were considered to have the strongest evidence of bLR vs. bHR DE and highlighted in downstream analyses.
As an exploratory analysis, we also compared the pattern of bHR/bLR differential expression identified in the hippocampus in our current study to bHR/bLR differential expression in other brain regions using data from previous transcriptional profiling studies in bHR/bLR adults, including the amygdala [n = 5/group (Cohen et al., 2015; McCoy et al., 2017), n = 6/group (Cohen et al., 2017)], dorsal raphe [n = 6/group (Cohen et al., 2017)], and unpublished data from the cortex (n = 6/group, Supplementary Table S5) and hypothalamus (n = 6/group, Supplementary Table S5). To increase power, we performed a meta-analysis of the two amygdala datasets (collective n = 11/group, 7,133 genes, Supplementary Table S5) and a meta-analysis encompassing all of the non-hippocampal data to identify bHR/bLR differences that might exist brain-wide (n = 29/group, 11,503 genes, Supplementary Table S5). These comparisons suggested that at least some of the bHR/bLR differential expression identified in the hippocampus may also be present in other brain regions, whereas other differential expression may be hippocampal specific (Supplementary results).
3.4 F0 hippocampal differential expression predicts expression related to F2 behaviorSince some bHR/bLR differential expression may be due to either linkage disequilibrium with causal variants or genetic drift specific to our bred lines, we performed RNA-Seq on hippocampal tissue from a large F2 intercross sample (n = 250) to identify differential expression that continued to independently correlate with exploratory locomotion, anxiety-like behavior, and reward-related behavior. Hippocampal gene expression associated with bLR lineage resembled the expression associated with lower F2 LocoScore, as indicated by the negative correlation between the F0 bLR vs. bHR Log2FCs for all genes and the F2 LocoScore Log2FCs for all genes (R = −0.20, p < 2.2e-16, Figure 6A, Supplementary Table S6). Similarly, gene expression associated with bLR lineage partially resembled expression in F2s exhibiting lower exploration (distance traveled) and greater anxiety (greater time immobile, less time in the open arms) on the elevated plus maze (EPM) task (Supplementary Table S6), and greater goal-tracking behavior on the PavCA task (lower PavCA Index; Supplementary Table S6). This pattern of correlations confirmed that a portion of the hippocampal differential expression that emerged following selective breeding was related to behavioral temperament.
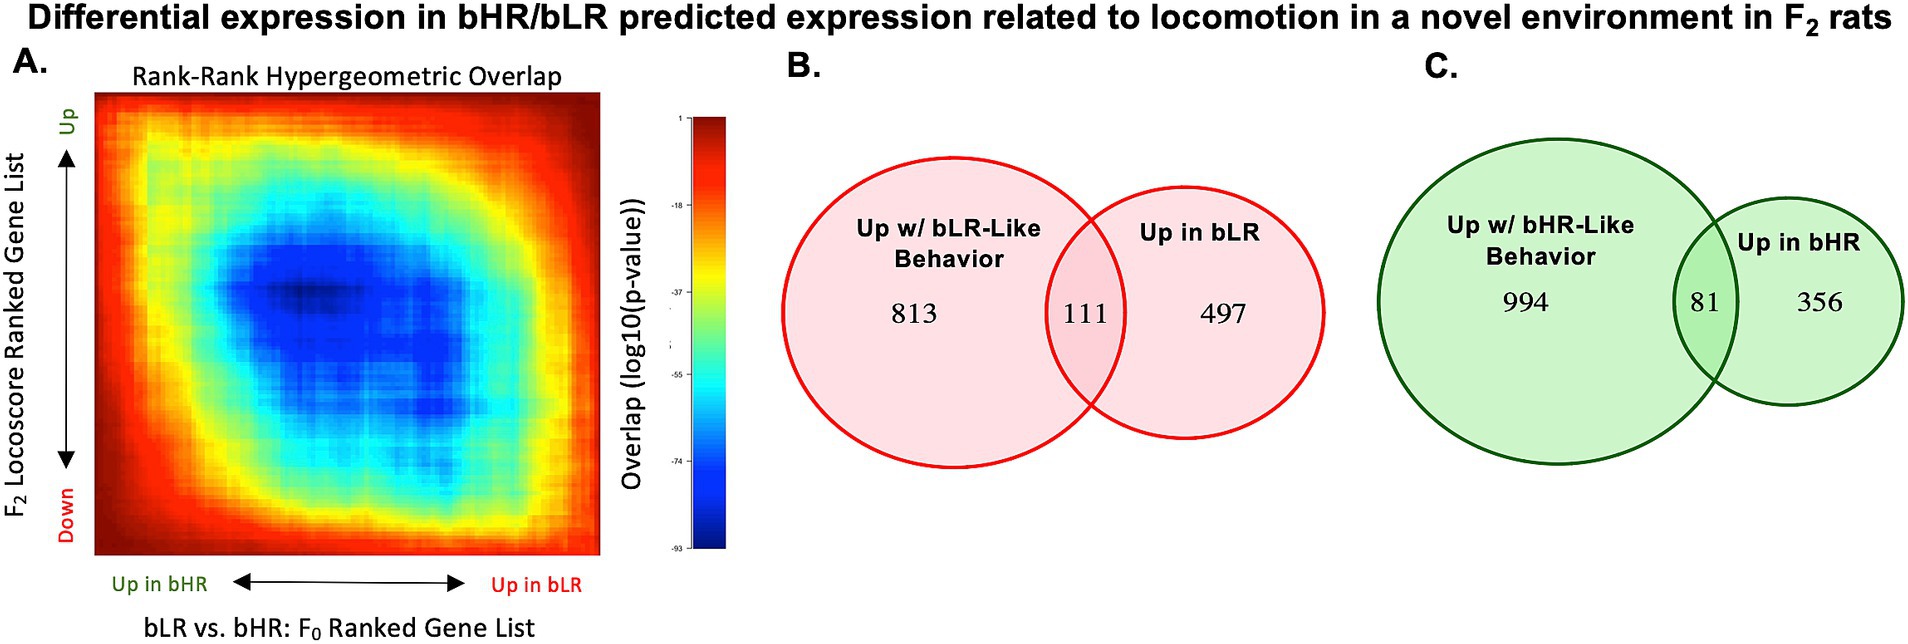
Figure 6. Hippocampal gene expression in bLR vs. bHR F0 rats predicts the pattern of gene expression associated with bLR-like vs. bHR-like behavior in F2 intercross rats. (A) For example, there is a negative correlation between the Log2FC associated with locomotion in a novel environment (LocoScore) in the F2s and the Log2FC for bLR vs. bHR lineage in the F0s (n = 13,339 genes, R = −0.196, p < 2e-16), which matches the prediction that a bLR-like pattern of gene expression resembles the expression associated with lower exploratory activity. Following the plotting conventions from Figure 5B, this negative correlation is illustrated using a two-sided RRHO plot. Within the RRHO, the results are ranked by t-statistic. The visible blue diagonal indicates a negative correlation between the ranked results. The correlation between bLR vs. bHR differential expression and gene expression associated with the other F2 behaviors can be found in Supplementary Table S6. (B) A pink Venn Diagram illustrates the enrichment of bLR-upregulated differentially expressed genes for nominal (p < 0.05) associations with bLR-like behavior in the F2s (i.e., gene expression correlated with decreased locomotor activity, decreased distance traveled, increased immobility, decreased % time in the open arms of the EPM, or decreased PavCA Index) (enrichment: Fisher’s exact test: OR: 3.27, p < 2.2e-16). (C) A green Venn Diagram illustrates the enrichment of bHR-upregulated differentially expressed genes for nominal (p < 0.05) associations with bHR-like behavior in the F2s (i.e., gene expression correlated with increased locomotor activity, increased distance traveled, decreased immobility, increased % time in the open arms of the EPM, or increased PavCA Index) (enrichment: Fisher’s exact test: OR 2.72, p = 7.14e-13). We prioritized the 192 genes that satisfied both criteria (i.e., the intersection of the Venn Diagrams) in downstream analyses as differential expression that might mediate the effect of selective breeding on behavior (111 genes upregulated in both bLRs and with bLR-like behavior, 81 genes downregulated in both bHRs and with bHR-like behavior).
These correlations strengthened when focusing specifically on bHR/bLR differentially expressed genes (1,063 genes in Figures 5C–E), of which 1,045 were present in the F2 dataset (Supplementary Table S6). Of these genes, 111 showed both upregulation in bLR rats and at least one nominal (p < 0.05) association with bLR-like behavior in the F2s (i.e., expression correlated with decreased locomotor activity, decreased EPM distance traveled, increased EPM time immobile, decreased EPM % time in open arms, or decreased PavCA Index), a 3.27X enrichment beyond random chance (Fisher’s exact test: 95%CI: 2.61–4.08, p < 2.2e-16, Figure 6B), and 81 genes showed both upregulation in bHR rats and at least one nominal (p < 0.05) association with bHR-like expression in the F2s, a 2.72X enrichment beyond random chance (Fisher’s exact test: 95%CI: 2.10–3.51, p = 7.14e-13, Figure 6C).
However, we were unable to identify differentially expressed genes for F2 behavior with strong enough effects to survive false discovery rate correction (FDR < 0.10). This was also true when using a model that included sex-specific differential expression for F2 behaviors (sex*behavior interaction: all FDR < 0.10). This inability to detect significant differential expression related to F2 behavior was particularly striking because the F2 sample size was much larger than the sample sizes used to detect differential expression in our bred model (F2: n = 250, F0: n = 24), and this greater statistical power lead to the expected increase in the detection of more subtle differential expression related to sex (1,679 genes with FDR < 0.10, Supplementary Figure S5, full results: Supplementary Table S4).
These findings drive home the role of cumulative small, polygenic effects in generating complex behavior, and suggest a need for larger sample sizes to reliably detect these polygenic effects on gene expression in a heterogeneous population. These findings also demonstrate the utility of selective breeding in behavioral genetics: the highly divergent phenotype and minimized within-group variability made it possible to detect relevant differential expression in a much smaller size. For downstream analyses, we chose to focus on the differential expression with the strongest converging evidence supporting its potential to mediate behavioral temperament from both the selectively bred lines and F2 rats (the 111 genes that were upregulated in bLRs and nominally with bLR-like behavior in the F2s and 81 genes upregulated in bHRs and nominally with bHR-like behavior in the F2s).
3.5 Multiple genes have hippocampal differential expression consistently associated with behavioral temperament in other rat models as well as in our F0 and F2 studiesTo determine generalizability, we compared our list of differentially expressed genes implicated in behavioral temperament by converging evidence from the bred lines and the F2s (identified in Figures 6B,C) to a database of 2,581 genes previously identified as differentially expressed in the hippocampus of other bLR-like and bHR-like rat models targeting hereditary behavioral traits resembling extremes on the internalizing/externalizing spectrum [database from Birt et al. (2021), summarized in Figure 7A; Andrus et al., 2012; Blaveri et al., 2010; Díaz-Morán et al., 2013; Garafola and Henn, 2014; Meckes et al., 2018; Raghavan et al., 2017; Sabariego et al., 2013; Wilhelm et al., 2013; Zhang et al., 2005]. Sixteen of 111 genes that were upregulated in bLRs and with bLR-like behavior in our study were also upregulated in other bLR-like models (Figure 7B, enrichment OR: 2.50 (95%CI: 1.37–4.29), Fisher’s exact test: p = 0.00242) and 14/81 genes that were upregulated in bHRs and with bHR-like behavior in our study were downregulated in other bLR-like models [Figure 7C, enrichment OR: 2.07 (95%CI: 1.07–3.74), p = 0.0189]. Notably, Tmem144 had elevated hippocampal expression in three other bLR-like r
Comments (0)