
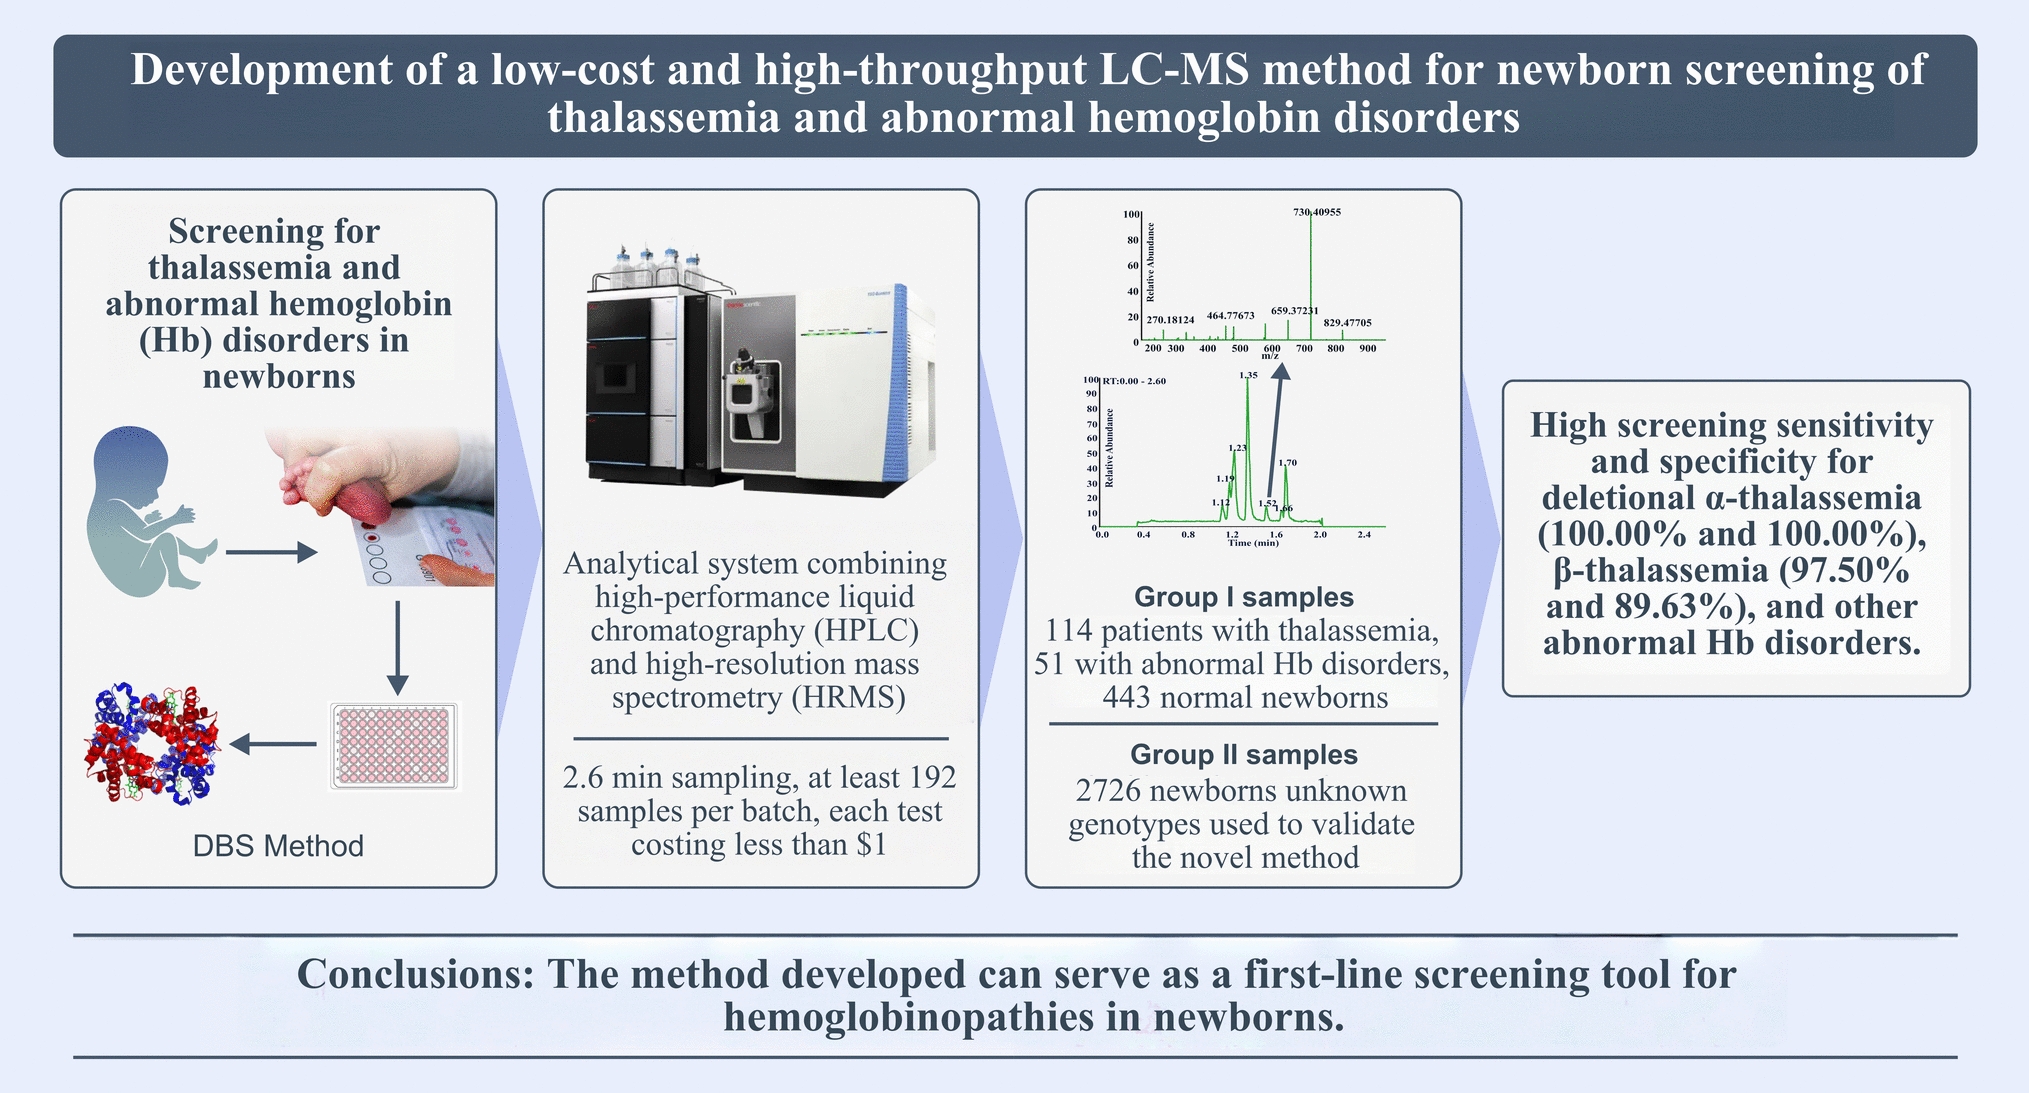
Remember me
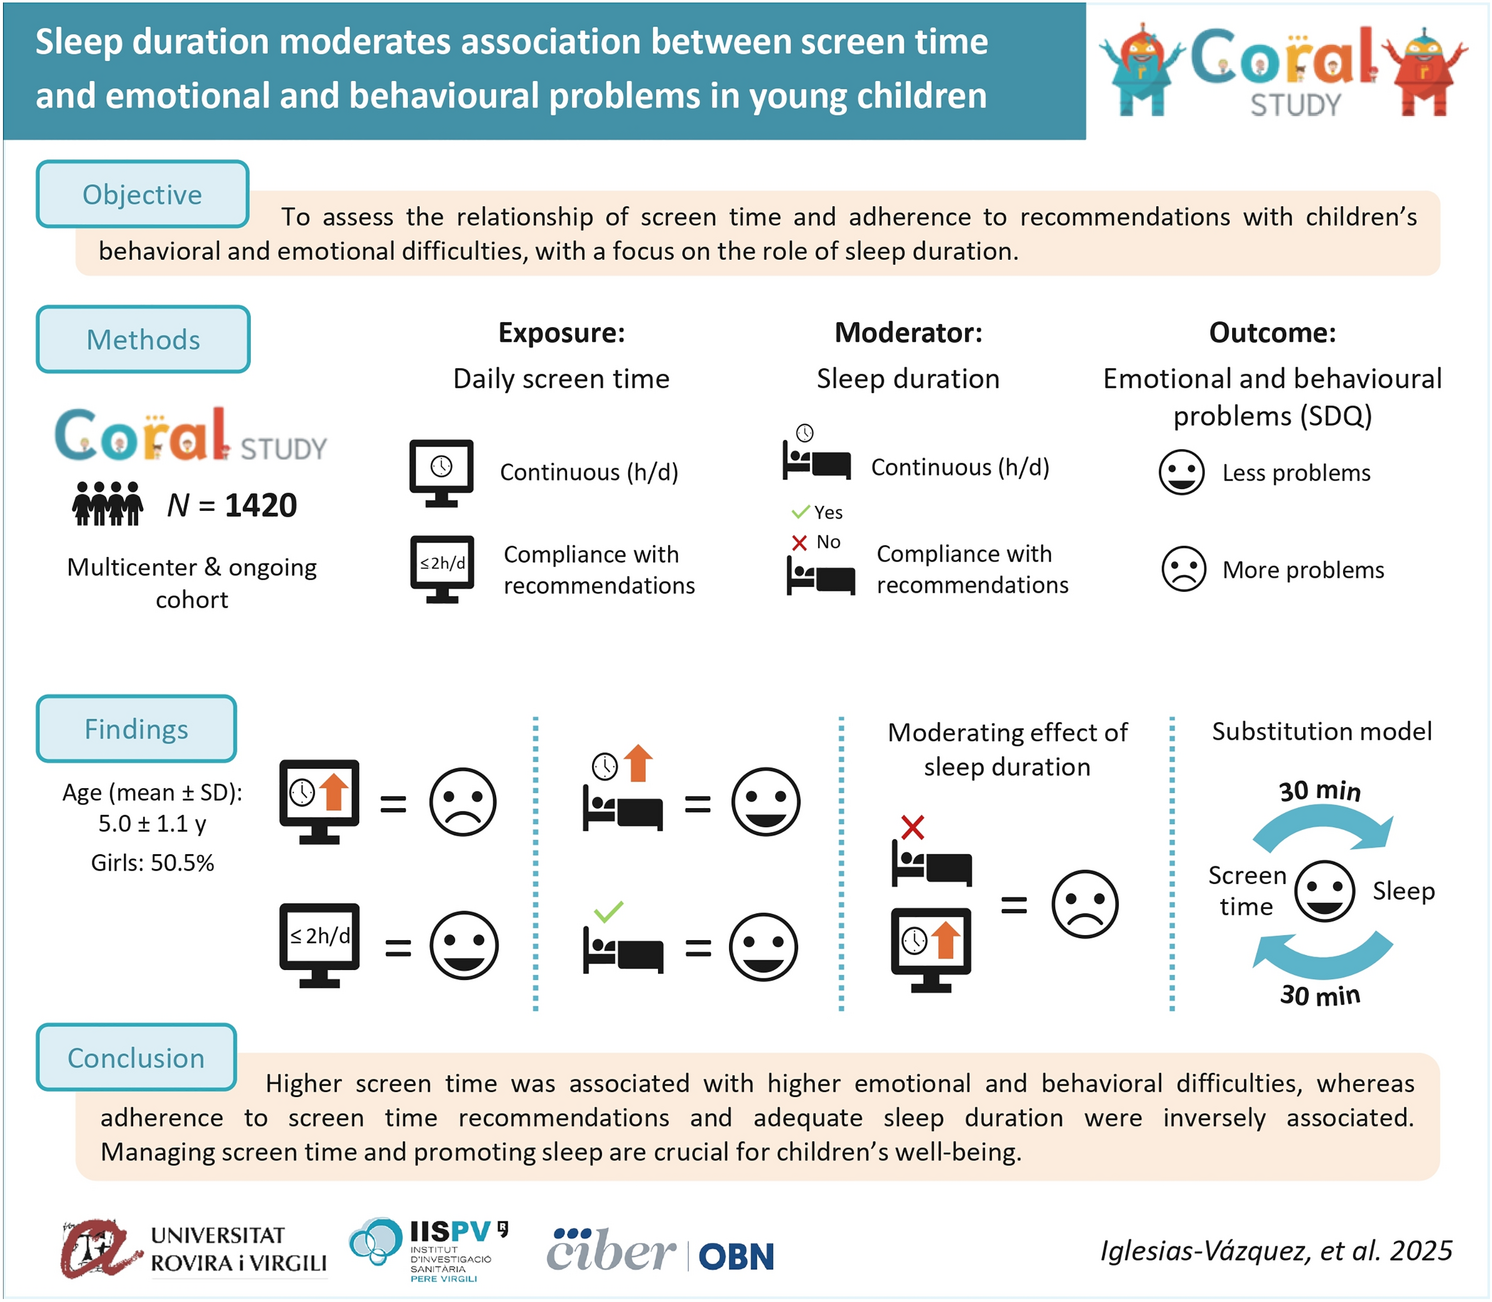


For this longitudinal study, data were taken from the Add Health project, which followed a nationally representative group of U.S. adolescents in grades 7–12 into adulthood. Wave I, carried out in 1994, involved 20,745 in-home interviews [12]. Data from Wave V and biomarker data from 2016 to 2018 (n = 5381, age 33–39 years) were also used. After missing data were excluded and individuals who were diagnosed with hypertension before the age of 18 were removed, 3076 individuals were included in the analysis (Fig. 1). Among participants included and excluded in Wave V, there were no statistically significant differences in screen time (P = 0.514), sleep duration (P = 0.701), PA (P = 0.762), or demographic characteristics (ethnicity, P = 0.333; region, P = 0.324). Consequently, it is unlikely that the missing data significantly influenced the analysis results.
Fig. 1 Anthropometry
Weight and height were recorded during Wave V, and the formula used to calculate body mass index (BMI) was weight (kg) divided by height (m) squared.
Blood pressureA calibrated oscillometric blood pressure (BP) instrument (BP3MC1-PC-IB, Micro-Life USA; Dunedin, Finland) with a suitable cuff was used by skilled professional field workers to measure BP. After five minutes of sat rest, three systolic and diastolic BP readings were recorded on the right arm at 30-s intervals. The analysis was based on the average of the last two readings. The American Heart Association and American College of Cardiology’s 2017 guidelines [13] defined hypertension as a systolic blood pressure of 130 mmHg or higher, a diastolic BP of 80 mmHg or higher, a history of hypertension diagnosed by a doctor, or the use of antihypertensive drugs at the time of the diagnosis.
Twenty-four-hour movement behaviorDetailed information on how PA, screen time, and sleep duration described elsewhere in a related publication [14].
Physical activityAdolescents and adults reported their moderate-to-vigorous physical activity (MVPA) over the past week during the Wave I and Wave V in-home interviews, using specific questions and a scale detailed in the article referenced above [14]. Individuals meeting the PA guidelines were those who reported engaging in MVPA five or more times weekly, based on the Gordon-Larsen et al. criterion [15].
Screen timeScreen time was assessed through questions about weekly hours spent watching TV, videos, and playing video/computer games [14]. Total weekly screen time was calculated by summing responses. Adherence to guidelines was defined as ≤ 2 h/day for adolescents in Wave I and ≤ 3 h/day for adults in Wave V [16].
Sleep durationDuring the Wave I and Wave V in-home interviews, sleep duration was self-reported by adolescents and adults. Adherence to sleep guidelines was evaluated based on National Sleep Foundation recommendations: 9–11 hours for ages 12–13, 8–10 hours for ages 14–17 [17], and 7–9 hours for adults in Wave V [16].
TrajectoriesWe analyzed the individuals who maintained each movement behavior individually in both waves and performed a general analysis in which we evaluated whether the individuals met all three guidelines in both waves.
Definitions of covariatesSociodemographic data, including age, sex, and ethnicity, were collected via in-home questionnaires.
Alcohol consumption was measured by asking participants how many days they had consumed alcohol (beer, wine, liquor) in the past 30 days. Responses were used to classify participants into categories ranging from “None” to “Every day or almost every day,” with intermediate groups reflecting varying frequencies over the past year.
Finally, smoking behavior was assessed by asking adults about cigarette use in the past 30 days, while fast food consumption was evaluated based on the number of days participants ate at fast-food establishments in the past week.
Statistical analysisThe analytic sample, including tests for significant changes based on BP state, was first described. For continuous variables, descriptive statistics are displayed as means and standard deviations; for categorical variables, they are displayed as counts and percentages. Every model assumption, including homoscedasticity and normalcy, was confirmed.
For each of the 24 h movement patterns at Wave I, we compared the BP characteristics of those who did and did not meet the movement recommendations at Wave V. Furthermore, we compared the BP characteristics of those who did not met the guidelines with those who did at both time points (i.e., Waves I and V). After controlling for sex, ethnicity, age at Wave V, BMI at Wave V, alcohol consumption at Wave V, smoking habits at Wave V, and fast-food consumption at Wave V, generalized linear models with Gaussian distributions were used to analyze the main effects and interactions and control for potential confounding variables. A nonparametric approach that involved resampling dependent variables with replacement and bootstrapping with 5000 repeats was used.
Finally, using the previously indicated adjustments and variables, generalized linear models with binomial distributions were used to calculate the probabilities of developing hypertension in relation to fulfilling the 24 h movement criteria (individually and collectively). For the analysis, we used version 17.0 of STATA statistical software (StataCorp LLC, College Station, TX). The threshold for statistical significance was set at P < 0.05.
Comments (0)