
Remember me


Sarcoidosis is a complex immune-mediated granulomatous disease of unknown cause, which can affect various organs, such as the lungs, skin, eyes, and heart. Non–organ-related symptoms such as fatigue, cognitive failure, and symptoms associated with small fiber neuropathy (SFN) may, however, also have a large impact on the quality of life.6 Up to 86% of patients with sarcoidosis experience symptoms associated with SFN.22 The exact prevalence, however, remains unknown. Symptoms include neuropathic pain, paresthesia, diminished heat and cold sensation, bedsheet intolerance, or autonomic dysfunction.11,23
Diagnosis of SFN is currently based on clinical signs of SFN in combination with decreased intraepidermal nerve fiber density (IENFD) or abnormal quantitative sensory testing (QST).4,5,20 Quantitative sensory testing assesses both small and large nerve fibers.17 Because performing the full test is time-consuming, thermal threshold testing (TTT) has been selected to test the small nerve fibers,1,2,21 whereas nerve conduction studies are recommended to test large nerve fibers.14 Thermal threshold testing measures the cold detection threshold (CDT), warm detection threshold (WDT), thermal sensory limen (TSL), paroxysmal heat sensation (PHS), cold pain threshold (CPT), and heat pain threshold (HPT).
Cold detection threshold and WDT can be measured using the method of limits (MLi) and the method of levels (MLe). The MLi is time-dependent and requires the participant to respond as soon as they feel a change in temperature. The MLe applies standardized temperature changes and requires feedback with a yes or no button to determine whether the next stimulus is higher (after no) or lower (after yes). No clear agreement has been reached on the superiority between the 2 methods and results are conflicting.2,4 For example, the DFNS protocol,18 the most widely recognized and standardized protocol for QST procedures, recommends the MLi. By contrast, the Besta criteria, the most widely recognized and standardized diagnostic criteria for SFN, recommends the MLe.4 Known disadvantages of the MLe are high time consumption and desensitization15 because of numerous repeated measurements.
The selection of TTT parameters and measuring sites has not been standardized yet. For example measuring TTT at both feet was suggested by 1 group20 while another group measured TTT at both hands and feet.2 This protocol was further refined by testing CDT and WDT, at both hands and feet using only MLe.2 Recently, the new Besta criteria recommended to perform CDT and WDT measurements bilaterally only at the feet, using both MLi and MLe.4 Several recent studies of diagnosing SFN have shown a lack of uniformity in TTT testing7,9,13 which makes it a challenge to compare the data. However, what all of the studies have in common is that they defined “abnormal QST” when one of the parameters measured was abnormal. It is known that the chance of finding an abnormality increases with increasing number of measurements.
With this study, we first wanted to investigate whether QST could benefit from a new approach focusing on the balance between the number of measurements, depending on the selection of parameters and measuring sites, and on number of abnormalities (NOAs). Second, we wanted to address the role of MLe in possible desensitization during TTT measurements.
2. Methods 2.1. EthicsThe study protocol was approved by the local Ethics Committee (Medical Research Ethics Committees United, Nieuwegein, the Netherlands, R19.080). The study was conducted in accordance with the Declaration of Helsinki and GCP guidelines. Verbal and written consent was obtained before starting the study. All data have been collected and saved in a database (RedCap).
2.2. DesignThis was a prospective, cross-sectional observational study. Patients with sarcoidosis aged 18 to 75 years with and without clinical signs of SFN were included between January 2021 and September 2022 at the outpatient clinic of St. Antonius Hospital, a tertiary referral center for sarcoidosis and ILD in the Netherlands. In addition, healthy controls were included, consisting of partners of participants and colleagues. Sarcoidosis was diagnosed using the criteria of the American Thoracic Society or European Respiratory Society.3 The exclusion criteria were polyneuropathy, other diseases with a risk of developing neuropathy or polyneuropathy, neurological diseases affecting sensory nerve function, language barriers, mental health problems, pregnancy, glucose intolerance, vitamin B12 deficiency, and excessive alcohol intake as judged by the treating physician.
2.3. Neuropathy assessmentAll participants underwent detailed assessment of SFN by a neurologist and medical history assessing any type of annoying spontaneous, evoked pain sensations or other symptoms related to SFN. Neurological physical examination was used for cerebellar, large nerve fiber, and small nerve fiber assessment, as described in Table 1. Patients completed the Small Fiber Neuropathy Screening List (SFNSL)10 to quantify their somatic and autonomic symptoms. Sensory and motor nerve conduction studies were performed to exclude large fiber involvement. Surface recording electrodes with standard placement were used to measure compound muscle action potential, sensory nerve action potential, and nerve conduction velocity. Motor nerve conduction was assessed in peroneal and tibial nerves, and sensory nerve conduction was assessed in the sural nerve.
Table 1 - Neurological tests for clinical signs of small fiber neuropathy. Test Function Small fiber assessment (eyes closed) Sensory signs with comparative assessment Define dermatomic, mono or multineuropathic and polyneuropathic distribution Cotton bud Tactile hypoesthesia and dynamic mechanical allodynia Sharp stimulation Hypoalgesia, analgesia, and punctuate allodynia Pain stimulation Hyperalgesia, hypoalgesia, and analgesia Thermal sensation (cold tuning fork) Thermal hypoesthesia and thermal allodynia Pupil abnormalities, sweating, skin flushing or discolouration, orthostatic hypotension, and heart frequency Dysautonomia Large fiber, spinal cord, and cerebral assessment 128 Hz graduated tuning fork Vibratory sensation Coordination Cerebellar and sensory function Romberg test Proprioception and sensory ataxia Hoffmann sign Upper motor neuron lesion Reflex test decreased or absent Radiculopathy, large fiber polyneuropathy, Reflex test increased Upper motor neuron lesion Diadochokinesia test Cerebellar ataxia Motion sense hallux Position senseQuantitative sensory testing is a psychophysical instrument that can be influenced by the patient's focus and the way instructions are given by the person administering the test. To standardize instructions, the DFNS has developed a Standard Operating Procedure (SOP) file16 which describes how to perform QST measurements. They also performed a large study to define normative values.18
Thermal threshold testing measurements were performed at both hands and feet. The order of measurements was clearly described in the SOP file of the DFNS16 and took desensitization due to pain thresholds into account by performing them as the last measurement. Method of levels was not mentioned in the SOP file, but because the detection threshold lies below the pain threshold, MLe was performed before assessment of the pain thresholds. Eventually, it was performed next to MLi because it should yield the same detection thresholds.
First, the most affected side or the dominant hand side was identified as the test side. A single test round was conducted at the forearm on the contralateral side. For the full protocol, every parameter was measured 3 times. The mean of the 3 measurements was used as the result. The full protocol was always executed at the contralateral side first, followed by the test side. The dorsal sides of the hands were measured first, followed by the dorsal sides of the feet. Method of levels was only performed at the test side. An overview of the order, type, and frequency of testing is presented in Table 2.
Table 2 - Overview of thermal threshold testing protocol. Order Methods Contralateral sideThe first column shows the order in which the measurements were programmed. A test round measured each parameter once and was performed at the forearm of the contralateral site. Next, a full test protocol measured each parameter 3 times. The full protocol was performed at the contralateral side first, followed by the test side. MLe was not performed for the contralateral side. MLe varies in the number of levels required to determine the detection threshold. Moreover, the hands were always measured first, before the feet.
CDT, cold detection threshold; CPT, cold pain threshold; HPT, heat pain threshold; MLe, method of levels; MLi, method of limits; PHS, paroxysmal heat sensation; TSL, thermal sensory limen; WDT, warm detection threshold.
The Medoc Thermal Sensory Analyzer II (Medoc Ltd, Ramat Yishai, Israel) was used. Thermal stimulation was provided by a 3.0 × 3.0-cm thermode, based on the Peltier effect. Baseline temperature was set at 32°C, with a range of 0 to 50°C. For detection and pain thresholds, temperature changed at a rate of 1°C/s, while the return to baseline was set at a rate of 5°C/s. A variable time window of 4 to 6 seconds was set between stimuli to prevent an automated reaction. For TSL, temperature changed at a constant rate of 0.7°C/s. The SOP file described in the Investigator's Brochure16 published by the DFNS was translated into Dutch and used to instruct the participants.
Results were transformed from temperature units into z scores, corrected for age, sex, and measuring site, according to the DFNS protocol.18 A positive abnormal z score indicates increased sensitivity to stimuli (hyperesthesia, hyperalgesia, and allodynia), whereas a negative abnormal z score indicates a decreased sensitivity to stimuli (hypoesthesia and hypoalgesia). Normative values from the DFNS18 were used to determine abnormality for each parameter.
2.5. Principal component analysisFirst, principal component analysis (PCA) was applied to identify the correlation between and discriminative power of TTT parameters. To this end, patients with sarcoidosis were divided into 2 groups: probable SFN and no SFN, based on the new Besta criteria.20 The group without SFN was clustered with healthy controls.
2.6. Method of levelsThe number of MLe measurements depends on the consistency of the participants' performance and can vary considerably. For example, when a participant pressed “yes” the first time and “no” the second time while the same temperature level was applied, additional measurements were required to establish the detection threshold. Therefore, the number of levels required to establish the detection threshold was first assessed to gain insight into the variation between participants. Next, because MLe corrects for the reaction time artifact of MLi, MLi was expected to show abnormal findings more often than MLe. Whether this is true was assessed by plotting the distribution of participants classified as normal or abnormal using both methods. Four groups were defined as “both normal,” “MLi abnormal,” “MLe abnormal,” and “both abnormal,” respectively, for CDT and WDT.
To investigate the discriminative power of individual parameters, the percentage of participants with at least 1 abnormal result for the same parameter measured at both feet was calculated. Results were displayed for 3 groups: patients with sarcoidosis with probable SFN, patients with sarcoidosis without SFN, and healthy controls. The same calculations were performed for the following 4 definitions of “abnormal QST”:
(1) New Besta criteria: at least 1 abnormality in CDT and WDT with MLi and MLe at both feet (8 measurements). (2) At least 1 abnormality in all TTT measurements at both feet (14 measurements). (3) At least 1 abnormality in all TTT measurements at both feet without MLe (12 measurements). (4) At least 2 abnormalities in all TTT measurements at both feet without MLe (12 measurements). 2.7. Diagnostic accuracyReceiver operating curve (ROC) analysis was used to determine sensitivity and specificity. Because QST parameters were investigated, they were not used to classify “diseased” patients. Incorporation bias was avoided by defining patients with sarcoidosis and probable SFN as “diseased.” In addition, healthy controls were excluded to avoid bias and patients with sarcoidosis without SFN were classified as “healthy.” Diagnostic accuracy was calculated with methods corresponding to the new Besta criteria4 and for all TTT parameters at both hands and feet. To improve the clinical feasibility about measuring all TTT parameters at 4 measuring sites, we investigated whether fewer measurements could be performed without reducing the diagnostic accuracy. We therefore investigated several combinations of TTT parameters and measuring sites. The combination with the highest diagnostic accuracy was used to set a cutoff value for NOAs to define “abnormal QST.” Logistic regression analysis was used to calculate diagnostic accuracy for the combination of the SFNSL questionnaire and the most accurate combination of TTT measurements. The SFNSL score and NOAs for the best combination of TTT parameters and measuring sites were plotted for the 3 groups: healthy controls, sarcoidosis without SFN, and sarcoidosis with probable SFN. We also investigated the correlation between NOAs and SFNSL score.
2.8. Data availabilityAll data in this study are available on reasonable request to the authors.
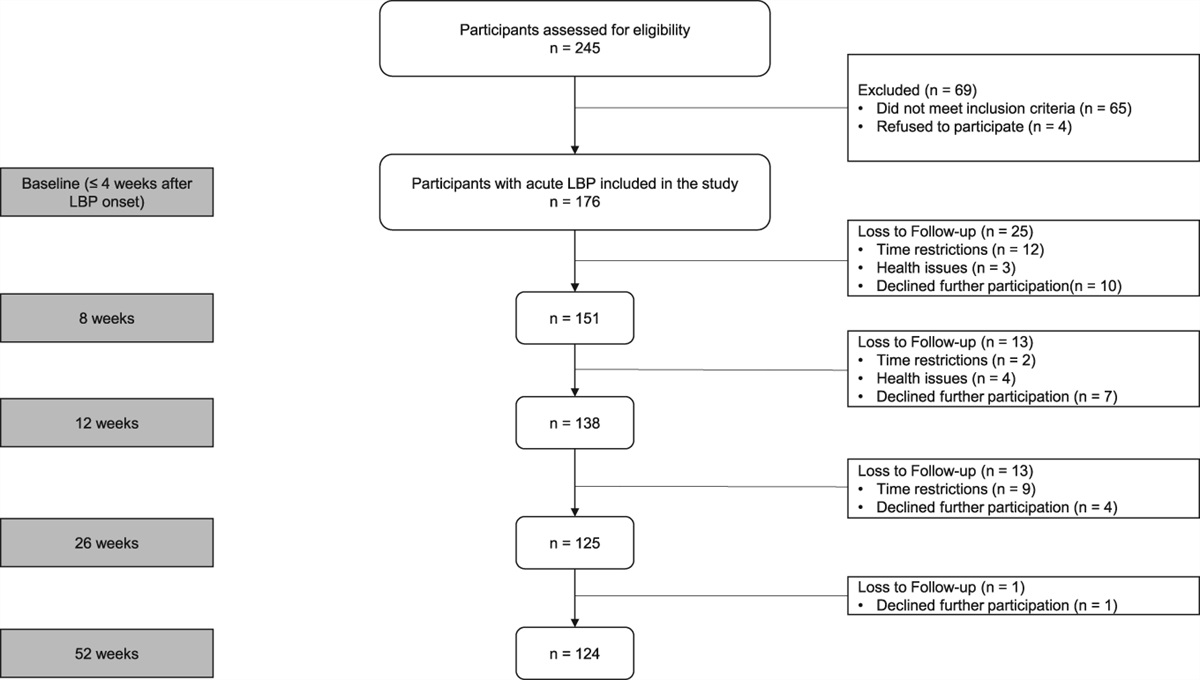
3. Results 3.1. Patient characteristicsFigure 1 shows an overview of the inclusion process. A total of 117 participants were included in this study. Twenty healthy controls (17%) were included, and in 49 patients with sarcoidosis (42%), there were no symptoms or clinical signs of SFN. Forty-eight patients with sarcoidosis (41%) were diagnosed with probable SFN based on symptoms, at least 2 clinical signs and normal nerve conduction studies.20
 Figure 1.:
 One patient showed a decreased vitamin B12 level, 4 patients showed decreased nerve conduction velocity, and 1 patient was diagnosed with neurosarcoidosis during the process. In the end, 117 participants were eligible for inclusion. SFN, small fiber neuropathy.
As expected, the SFNSL was higher in patients with probable SFN compared with patients without SFN (44 vs 25 respectively, P = 0.007), see Table 3. Patients with sarcoidosis without SFN were more likely to be men than patients with sarcoidosis and probable SFN (OR = 3.6). No further relevant differences could be found between the 3 groups. Small fiber neuropathy symptoms occurred or were diagnosed at a mean of 6.4 ± 5.3 years after the diagnosis of sarcoidosis.
Table 3 - Demographics in patients with sarcoidosis and healthy controls. Group n Age (y) Sex men (n (%)) Height BMI Disease duration sarcoidosis (y) SFNSL Healthy control 20 48 ± 12 10 (50%) 176 ± 9 23 ± 2 3 ± 4 Sarcoidosis without SFN 49 52 ± 11 36 (73%) 178 ± 9 26 ± 4 8 ± 6 25 ± 17 Sarcoidosis with probable SFN 48 52 ± 9 21 (44%) 176 ± 11 28 ± 6 9 ± 7 44 ± 11BMI, body mass index; SFNSL, small fiber neuropathy screening list.
Principal component analysis of all measurements at the test foot shows that patients with sarcoidosis and probable SFN could not be distinguished from participants without SFN by the TTT measurements (Fig. 2). Figure 2 also visualizes the correlation between the parameters. Cold detection threshold MLi, TSL, and WDT MLi determined 31.7% of the outcome. These vectors were situated close to each other, indicating a positive correlation, and were aligned with the x-axis, which represents principal component 1 (PC 1). The PHS vector diverges by 90° from the WDT MLi, which suggests no correlation. Moreover, PHS was aligned with the y-axis, which represents PC2 and therefore determines 17.9% of the outcome. Cold pain threshold and WDT MLi diverge by a large angle (close to 180°), which indicates a negative correlation.
 Figure 2.:
 Principal component analysis of thermal threshold testing (TTT) parameters for the test foot. Patients with sarcoidosis without small fiber neuropathy (SFN) are displayed as blue dots and patients with sarcoidosis with probable SFN are displayed as yellow triangles. Overall, results overlapped between participants with probable SFN and those without SFN. When 2 vectors are close, with a small angle between them, the 2 variables represent a positive correlation. An example is CDT MLe and HPT. If they are at an angle of 90° to each other, they were not likely to be correlated. An example is PHS and WDT MLi. When they diverged and formed a large angle (close to 180°), they are negatively correlated. An example is CPT and WDT MLi. CDT, cold detection threshold; CPT, cold pain threshold; HPT, heat pain threshold; MLe, method of levels; MLi, method of limits; WDT, warm detection threshold.
During TTT measurements, MLe could be time-consuming. In contrast with MLi, which always measured the CDT and WDT by a fixed number of 3 measurements, the number of levels required for MLe depended on the consistency of the participant's performance. Measuring time varied between 1 minute using 6 levels for successful measurements, up to 27 minutes and 25 levels for patients who seemed desensitized.
Figure 3 visualizes the distribution of abnormalities measured with MLi or MLe. Most participants showed no abnormalities with either of the methods. By far, the lowest proportion of participants showed corresponding abnormalities in both MLi and MLe. When comparing abnormalities measured with MLi only or MLe only, MLe found abnormal results more often than MLi (22% vs 17% for CDT and 11% vs 4% for WDT).
 Figure 3.:
 Distribution of abnormalities measured with both the method of levels (MLe) and the method of limits (MLi), with only MLe, with only MLi, or both detected as normal for (A) the cold detection threshold (CDT) and (B) the warm detection threshold (WDT).
Cold detection threshold and WDT were abnormal in at least 1 foot in 42% and 23% of patients with sarcoidosis and SFN, respectively. One healthy control showed abnormal CDT and another showed abnormal WDT at 1 foot. Cold pain threshold and HPT were abnormal in at least 1 foot in 4% and 8% of patients with sarcoidosis and SFN, respectively. Four healthy controls showed 1 abnormal pain parameter in at least 1 foot. Table 3 shows the percentage abnormalities for each parameter per group, measured at both feet. Method of levels showed by far the most abnormalities in patients with sarcoidosis without SFN and healthy controls.
According to the new Besta criteria,4 60% of patients with sarcoidosis and SFN showed abnormal QST. However, patients with sarcoidosis without SFN and healthy controls also showed large numbers of abnormal QST results, namely, 47% and 55%, respectively. All TTT parameters at both feet resulted in even larger numbers of abnormalities in all 3 groups, with even less discriminative power (TTT feet all). Because MLe showed the most abnormalities in healthy controls, we investigated whether the performance of all TTT parameters would improve without MLe. As seen in Table 4, “TTT feet without MLe” was better able to discriminate between the groups than “TTT feet all.”
Table 4 - Percentage abnormalities for each parameter per group, measured at both feet. Percentage abnormal Healthy controls (n = 20) Sarcoidosis without SFN (n = 49) Sarcoidosis with probable SFN (n = 48) CDT MLi 5% 16% 42% WDT MLi 5% 8% 23% CDT MLe 50% 29% 25% WDT MLe 30% 10% 15% TSL 5% 14% 35% PHS 30% 20% 44% CPT 10% 12% 4% HPT 15% 14% 8% New Besta (≥1 abnormal) 55% 47% 60% TTT feet all (≥1 abnormal) 70% 71% 73% TTT feet without MLe (≥1 abnormal) 40% 57% 67% TTT feet without MLe (≥2 abnormal) 25% 27% 64%Next, the percentage of abnormalities according to the new Besta criteria are displayed. The new Besta criteria are here defined as SFN based on symptoms of SFN in combination with at least 2 clinical signs of SFN and abnormal TTT. Abnormal TTT is defined as at least 1 abnormal parameter measured at both feet and WDT with the MLi and MLe.
CDT, cold detection threshold; CPT, cold pain threshold; HPT, heat pain threshold; MLe, method of levels; MLi, method of limits; PHS, paroxysmal heat sensation; SFN, small fiber neuropathy; TSL, thermal sensory limen; TTT, thermal threshold testing; WDT, warm detection threshold.
As shown by the results of all TTT measurements at both feet, over 70% of participants in all groups showed at least 1 abnormal parameter. Increasing the cutoff value from 1 to 2 abnormalities in all TTT parameters except for MLe in both feet improved the results to 64% abnormal QST in patients with sarcoidosis and SFN, 27% abnormal QST in patients with sarcoidosis without SFN, and 25% abnormal QST in healthy controls.
3.3. Diagnostic accuracyTable 5 shows the reliability of combining different QST parameters, based on the corresponding optimal cutoff value. Measuring TTT according to the new Besta criteria4 results in a sensitivity of 60% and a specificity of 55% when using the cutoff value of 1 abnormal parameter. Combining all TTT measurements at both hands and feet resulted in a minor improvement of specificity to 63% at a cutoff of 5 abnormalities. Measuring all parameters at both feet except for MLe reduced the labor intensiveness with a minor improvement of sensitivity to 65%, whereas specificity improved to 73% with a cutoff of 2 abnormalities. Measurements at the hands showed lower sensitivity and specificity and measuring 1 hand or foot also resulted in lower sensitivity and specificity (not displayed in Table 4). The SFNSL questionnaire had a sensitivity of 70% and specificity of 66%. Combining all TTT parameters measured at both feet, except for MLe, with the SFNSL improved the sensitivity to 73% and the specificity to 69%.
Table 5 - Results of receiver operating curve analysis at multiple measuring locations and parameter combinations sensitivity and specificity were displayed at the optimal cutoff value. Method Sensitivity Specificity Cutoff value TTT feet WDT and CDT MLi and MLe (Besta5) 8 measurements 60% 55% 1 TTT all parameters and measuring sites 28 measurements 63% 67% 5 TTT all parameters both feet 14 measurements 69% 63% 2 TTT both feet without method of levels 12 measurements 65% 73% 2 TTT both hands without method of levels 12 measurements 63% 51% 2 TTT test foot without method of levels 6 measurements 54% 59% 1 TTT contralateral foot without method of levels 6 measurements 60% 61% 1 TTT both feet CDT, WDT, and TSL 6 measurements 54% 78% 1 TTT both feet CDT, WDT, TSL, and PHS 8 measurements 66% 67% 1 SFNSL 70% 66% 34 SFNSL and TTT both feet without method of levels 73% 69% VariableCDT, cold detection threshold; MLe, method of levels; MLi, method of limits; PHS, paroxysmal heat sensation; SFNSL, Small Fiber Neuropathy Screening List; TSL, thermal sensory limen; TTT, thermal threshold testing; WDT, warm detection threshold.
Thermal threshold testing NOAs at both feet for all parameters except MLe showed more abnormalities in the group with probable SFN compared with the group without SFN and healthy controls (Fig. 4A). Thermal threshold testing NOAs ≥2 had the best sensitivity and specificity. In addition, a higher SFNSL score was found in the group with probable SFN (Fig. 4B). A significant correlation was found between TTT NOAs and the SFNSL score (Fig. 4C).
 Figure 4.:
 (A) Total number of abnormal thermal threshold test parameters (TTT NOA) was higher in patients with sarcoidosis and probable small fiber neuropathy (Prob. SFN) compared with patients without SFN (No SFN) and healthy controls (HCs). (B) SFNSL questionnaire also shows higher scores in the group with probable SFN. Note that there is a large dispersion in the group of patients with sarcoidosis without SFN. (C) Correlation was found between the number of abnormalities in thermal threshold testing (TTT NOAs) and the number of symptoms based on the SFNSL questionnaire.
4. DiscussionOur findings show that looking at TTT NOAs in all TTT parameters except for MLe at both feet should be considered as a new approach to improve the consistency and balance between the selection of TTT parameters, measuring sites, and definition of “abnormal QST.” We also demonstrate that using the MLe results in desensitization, further suggesting that the use of MLe in diagnosing SFN should be discouraged. Moreover, adding the SFNSL questionnaire could further improve diagnostic accuracy.
To begin with, the PCA showed that not all TTT parameters correlate with each other. Therefore, focusing only on the detection thresholds, as currently suggested, results in a loss of information. The fact that not all parameters correlate with each other could be because different specific functions are measured by different parameters. In addition, clusters consisting of patients with probable SFN showed a large overlap with clusters consisting of participants without SFN. Consequently, no specific parameter was consistently abnormal in patients with probable SFN. It was not only within TTT measurements that a lack of correlation was found, but a lack of correlation between other diagnostic methods was also reported in the literature.8 We therefore assumed that expanding the number of measurements increases the reliability of SFN diagnosis.
Our results confirmed that testing both feet did indeed represent a more accurate test side than the hands. To define a clinically applicable QST protocol, it was found to make sense to measure all TTT parameters and assess the NOAs. When CDT MLi, WDT MLi, TSL, PHS, CPT, and HPT were measured at both feet using a cutoff of at least 2 abnormal parameters, the specificity of QST increased by 15% compared with the combination suggested in the new Besta criteria.4 Moreover, these measurements can be performed at both feet within 30 minutes, making them easy to apply. Combining TTT with a simple SFNSL questionnaire improved the diagnostic accuracy even further. Moreover, a higher TTT NOAs and a higher SFNSL score were found in patients with sarcoidosis and probable SFN compared with patients with sarcoidosis without SFN and healthy controls. Finally, a correlation between TTT NOAs and SFNSL score suggested a relation between the number of abnormalities in QST and the severity of SFN.
Our study found 4 reasons for not measuring MLe. First of all, we found a high degree of variance in the total number of measurements required to determine a detection threshold. This suggested inconsistent reactions by the participants, which could be explained with desensitization. Method of levels searched for the lowest level which can be detected and needs confirmation with 2 times “yes” at the same lowest level. However, desensitization gradually increased the threshold, so the first “yes” at the lowest level changed to a “no” the second time. Consequently, more measurements were required to determine the detection threshold. This increasing number of measurements resulted in insensitivity of the skin to temperature stimuli, which could affect the measurements after the MLe measurements.
The second reason was that the MLe parameter showed a lack of specificity, resulting in high percentages of abnormalities in healthy controls. This suggested that not only patients with sarcoidosis, who often suffered from fatigue, were prone to desensitization but that fit healthy controls also struggled with this complex method.
Third, because MLe should correct for time dependency, it was expected that MLe would result in normal findings in some cases where MLi resulted into abnormal findings. When we looked at the distribution of normal and abnormal results with MLi and MLe, MLe unexpectedly classified more participants as abnormal than MLi. Cold detection threshold MLe measured 22% abnormal participants vs 17% with MLi and WDT MLe measured 11% vs 4% with MLi. A lack of correlation was also demonstrated by the low number of overlapping abnormal classifications found by the 2 methods. Only 8% of CDT measurements and 6% of WDT measurements were abnormal with both methods.
Fourth, the results presented in Tables 4 and 5 show that leaving MLe out of the calculations results in improved diagnostic accuracy. Moreover, comparing WDT MLi, CDT MLi, TSL, PHS, CPT, and HPT measurements at the test side with the contralateral side shows that a 5% lower sensitivity was found at the test side (Table 5). Because MLe was only performed at the test side, this could indicate that MLe had a negative impact on the sensitivity of the combined measurements at the test side.
To summarize, a high degree of variance in the number of levels required to determine a detection threshold, a low specificity, not improving MLi, a risk of desensitization, and decreased accuracy are reasons not to measure with MLe.
A minor limitation of our study was that patients were not age-matched and sex-matched during the inclusion process. Because the study was performed in a population with a combination of rare diseases and a challenging protocol for SFN diagnosis, the priority was to include a population with a pure diagnosis of sarcoidosis as well as SFN, and to minimize comorbidities. In addition, results from TTT measurements were corrected for age, sex, and measuring site using z transformation, which should limit the bias caused by the lack of age and sex matching.
A major limitation of our study was the lack of structural assessment with skin biopsy. The reason for this was that its complex and labor-intensive protocol would result in high costs and limited clinical feasibility.13 Because multiple Dutch hospitals are struggling with the implementation of skin biopsies for SFN diagnosis, this highlights the challenges of implementing 50 µm IENFD as a diagnostic standard for SFN.
Diagnostic accuracy measures the level of agreement between index test results and the outcome of a reference standard. Not using any diagnostic technique to classify SFN and therefore inverting the standard clinical approach impairs validity and reproducibility of the ROC analysis. Alternatively, we investigated methods to test for diagnostic accuracy when no gold standard is available,19 one of them being known as “validate index test results.” This method abandons the test accuracy paradigm and test results were related to other relevant clinical characteristics. Hence, we defined “probable SFN” as the reference standard to test the diagnostic accuracy of TTT measurements. To be able to use this method, we emphasize that we applied strict inclusion criteria, resulting in a pure study population with symptoms and at least 2 clinical signs of SFN. The high SFNSL scores of patients with sarcoidosis with probable SFN compared with patients with sarcoidosis without SFN confirm the strict patient selection method. Although “probable SFN” remains suboptimal for diagnostic accuracy calculations, it could still be used as an informative method to show the effects of different parameters and measuring site selections, rather than showing actual diagnostic accuracy. Moreover, those analyses nicely show how to determine a cutoff value for TTT NOAs and indicate which parameters show added values.
In contrast with articles proposing the assessment of detection thresholds with MLe, our study shows the limitations of MLe. Moreover, current diagnostic criteria suggest the use of decreased IENFD or abnormal QST for the definitive SFN diagnosis. However, inconsistent use of the term “abnormal QST” is seen between studies and the definition does not correct for the number of TTT measurements. The large number of parameters measured with TTT and the heterogenic results of individual parameters make it quite challenging to interpret QST, whereas TTT NOAs clearly relate to the severity of SFN, which is underlined by the good correlation between TTT NOA and SFNSL.
5. ConclusionThis study shows the limitations of MLe in TTT and calls for more homogeneity in the definition of “abnormal QST.” We propose the use of the number of abnormalities on TTT (TTT NOAs) to achieve an improved balance between the number of measurements and the measuring sites. According to our study, a NOAs ≥ 2, measured with all TTT parameters bilaterally at the feet without MLe, yields the optimal diagnostic accuracy in patients with sarcoidosis. However, future studies including skin biopsy are required for further validation.
DisclosuresThe authors have no conflict of interest to declare.
AcknowledgementsZonMW TopZorg 842002001. Each author declares that he or she has no commercial associations (eg, consultancies, stock ownership, equity interest, patent/licensing arrangement, etc.) that might pose a conflict of interest in connection with the submitted article.
Author contributions: L.R.M.R., M.V., J.C.G., and O.J.M.V. contributed to the study conception and design. Material preparation, data collection, and analysis were performed by L.R.M.R., M.V., M.D., and O.J.M.V. The first draft of the manuscript was written by L.R.M.R. and all authors commented on previous versions of the manuscript.
Data availability: Our data are available from the corresponding author.
Disclosure previous presentation of the research: Preliminary data: Poster session ERS Barcelona, September 4–6, 2022. Preliminary data: Poster session WASOG Sibiu, November 14–17, 2022.
References [1]. Bakkers M, Faber CG, Peters MJH, Reulen JPH, Franssen H, Fischer TZ, Merkies ISJ. Temperature threshold testing: a systematic review. J Peripher Nerv Syst 2013;18:7–18. [2]. Bakkers M, Faber CG, Reulen JPH, Hoeijmakers JGJ, Vanhoutte EK, Merkies ISJ. Optimizing temperature threshold testing in small-fiber neuropathy. Muscle Nerve 2015;51:870–6. [3]. Costabel U, Hunninghake GW, Statement S. ATS/ERS/WASOG statement on sarcoidosis. Eur Respir J 1999;14:735–7. [4]. Devigili G, Rinaldo S, Lombardi R, Cazzato D, Marchi M, Salvi E, Eleopra R, Lauria G. Diagnostic criteria for small fibre neuropathy in clinical practice and research. Brain 2019;142:3728–36. [5]. Devigili G, Tugnoli V, Penza P, Camozzi F, Lombardi R, Melli G, Broglio L, Granieri E, Lauria G. The diagnostic criteria for small fibre neuropathy: from symptoms to neuropathology. Brain 2008;131:1912–25. [6]. Drent M, Strookappe B, Hoitsma E, De Vries J. Consequences of sarcoidosis. Clin Chest Med 2015;36:727–37. [7]. Egenolf N, zu Altenschildesche CM, Kress L, Eggermann K, Namer B, Gross F, Klitsch A, Malzacher T, Kampik D, Malik RA, Kurth I, Sommer C, Üçeyler N. Diagnosing small fiber neuropathy in clinical practice: a deep phenotyping study. Ther Adv Neurol Disord 2021;14:1–13. [8]. Fabry V, Gerdelat A, Acket B, Cintas P, Rousseau V, Uro-Coste E, Evrard SM, Pavy-Le Traon A. Which method for diagnosing small fiber neuropathy? Front Neurol 2020;11:342. [9]. Galosi E, Falco P, Di Pietro G, Leone C, Esposito N, De Stefano G, Di Stefano G, Truini A. The diagnostic accuracy of the small fiber neuropathy symptoms inventory questionnaire (SFN-SIQ) for identifying pure small fiber neuropathy. J Peripher Nervous Syst 2022;27:283–90.
Comments (0)