
Remember me


Interleukin-6 (IL6) impacts the pathogenesis of insulin resistance and obesity, but its effects are incompletely understood. IL6 promotes both pro- and anti-inflammatory actions in mice and humans [1]. Specific actions of IL6 differ in transient versus chronic inflammatory settings [2].
Glucagon-like peptide 1 (GLP1) is an incretin hormone largely known for its beneficial antidiabetic and antiobesity properties. GLP1 analogs lower blood glucose and weight while conferring cardiovascular protection [3]. The interplay between IL6 and GLP1 may differ in the chronic versus acute setting, suggesting different mechanistic pathways [4–6].
Our recent randomized controlled trial (RCT) in prediabetic, obese humans showed that single-dose GLP1 analog therapy, versus placebo, increased plasma postprandial IL6 [7]. Similar acute meal challenges (comparable to the study’s placebo arm) do not increase IL6 [8,9]. However, the effects of chronic GLP1 therapy on inflammation and circulating IL6 remain unknown.
We now report an extension of our prior RCT to investigate the postprandial inflammatory effects of chronic GLP-1 therapy in prediabetic, obese humans.
MethodsThe protocol conformed to the Declaration of Helsinki and was approved by the Committee for the Protection of Human Subjects at The University of Texas (UT) Health Science Center at Houston. All subjects gave written informed consent. Exenatide extended release (ER) is indicated for the treatment of type 2 diabetes and was used off-label in this study.
Human subjectsEligible subjects were men and women, ages 30 to 70 years, with prediabetes (as defined by American Diabetes Association) [10] and BMI of 30-35 mg/kg2 (±1 mg/kg2). Women of childbearing age agreed to a nonhormonal pregnancy prevention method. On screening, the following laboratory values were required: hematocrit ≥ 34%, serum creatinine < 1.5 mg/dl in men and 1.4 mg/dl in women, AST < 2.5 times upper limit of normal (ULN), ALT < 2.5 times ULN, and alkaline phosphatase < 2.5 times ULN. Subjects were excluded for the use of non-statin lipid-lowering medications, metformin, DPP-IV inhibitors, GLP1 analogs, sodium-glucose cotransporter-2 (SGLT-2) inhibitors, thiazolidinediones, insulin, sulfonylureas, corticosteroids, hormone replacement therapy, and/or immunosuppressive therapy during the 3 months prior to study initiation. NSAIDs and antioxidant vitamins were discontinued 1 week prior to study start. Statins, ACE inhibitors, and angiotensin-receptor blockers were allowed at stable doses for at least the prior 3 months and for the duration of the study. Other exclusions were significant cardiac, hepatic, or renal disease, current tobacco use, active malignancy, diabetes mellitus, acute infectious conditions, prior history of pancreatitis, prior history of medullary thyroid cancer, and prior history of multiple endocrine neoplasia 2 (MEN2). Pregnant and breastfeeding women were excluded. Full inclusion and exclusion criteria were described previously [7,11].
Clinical study protocolAfter completing the aforementioned RCT [7], eight of the participating subjects joined this nonblinded extension study. The subjects self-administered exenatide ER 2 mg subcutaneously weekly for 6 weeks. Prior to beginning medication, a study physician provided education on home dosing and administration. Notably, exenatide ER reaches steady state concentration in 6 weeks [12].
Approximately 1 week after the final dose, each subject returned to the Clinical Research Unit (CRU) at 0800 after an overnight fast. All exenatide ER pens were returned to the investigators to verify adherence. An intravenous catheter was placed in a stable vein in an upper extremity. At 1100, subject began eating a standardized high-carbohydrate, high-fat test meal described previously [11]. Venous blood was collected prior to meal and 2 hours postmeal.
Plasma measurementsPlasma IL6 was determined by an ELISA kit (R&D Systems, Inc, Minneapolis, MN). Plasma total GLP1 was measured by an ELISA kit (EMD Millipore Co., St. Louis, MO). Plasma glucagon was assessed by an ELISA kit (R&D Systems, Inc, Minneapolis, MN). All other plasma measurements were described previously [11].
Statistical analysesFor this pilot study, all outcomes at two different times were compared by Wilcoxon signed-rank test. The primary outcome was plasma IL6, with related metabolic markers as secondary outcomes. All analyses were performed in SAS 9.4 software (Cary, NC) and Stata/IC 13.1 (StataCorp).
ResultsSeven of eight subjects completed the study. One withdrew due to severe nausea. Subjects were predominantly obese and Black, with near-equal numbers of males and females (Table 1). Two subjects had hypertension and were treated with a stable dose of either ACE-I or ARB. Four subjects had hyperlipidemia, one of which was treated with a stable dose of statin and three received no medication. There were no other relevant comorbidities per medical history.
Table 1 - Baseline clinical characteristics of study participants Variable n = 7 Ethnicity (Caucasian/Black/Hispanic/Pacific Islander) 0/6/1/0 Sex (M/F) 4/3 Age (years) 51 ± 4 Weight (kg) 96.8 ± 4.1 BMI (kg/m2) 33.3 ± 0.6 SBP (mm Hg) 140 ± 9 DBP (mm Hg) 84 ± 3 Fasting glucose (mg/dl) 89 ± 2 Fasting insulin (mIU/L) 6.5 ± 0.9 HOMA-IR 1.18 ± 0.22 Hemoglobin A1c (%) 6.01 ± 0.08 Triglycerides (mg/dl) 105 ± 11 Total cholesterol (mg/dl) 190 ± 18 HDL cholesterol (mg/dl) 53 ± 3 LDL cholesterol (mg/dl) 116 ± 17 AST (units/L) 21 ± 3 ALT (units/L) 23 ± 6 Creatinine (mg/dl) 1.04 ± 0.07 Hemoglobin (g/dl) 14.0 ± 0.5 Platelets (×109/L) 228 ± 15Data for ethnicity and sex are presented as absolute numbers. All other data are presented as mean ± SEM.
ALT, alanine aminotransferase; AST, aspartate aminotransferase; BP, blood pressure; HDL, high-density lipoprotein; LDL, low-density lipoprotein.
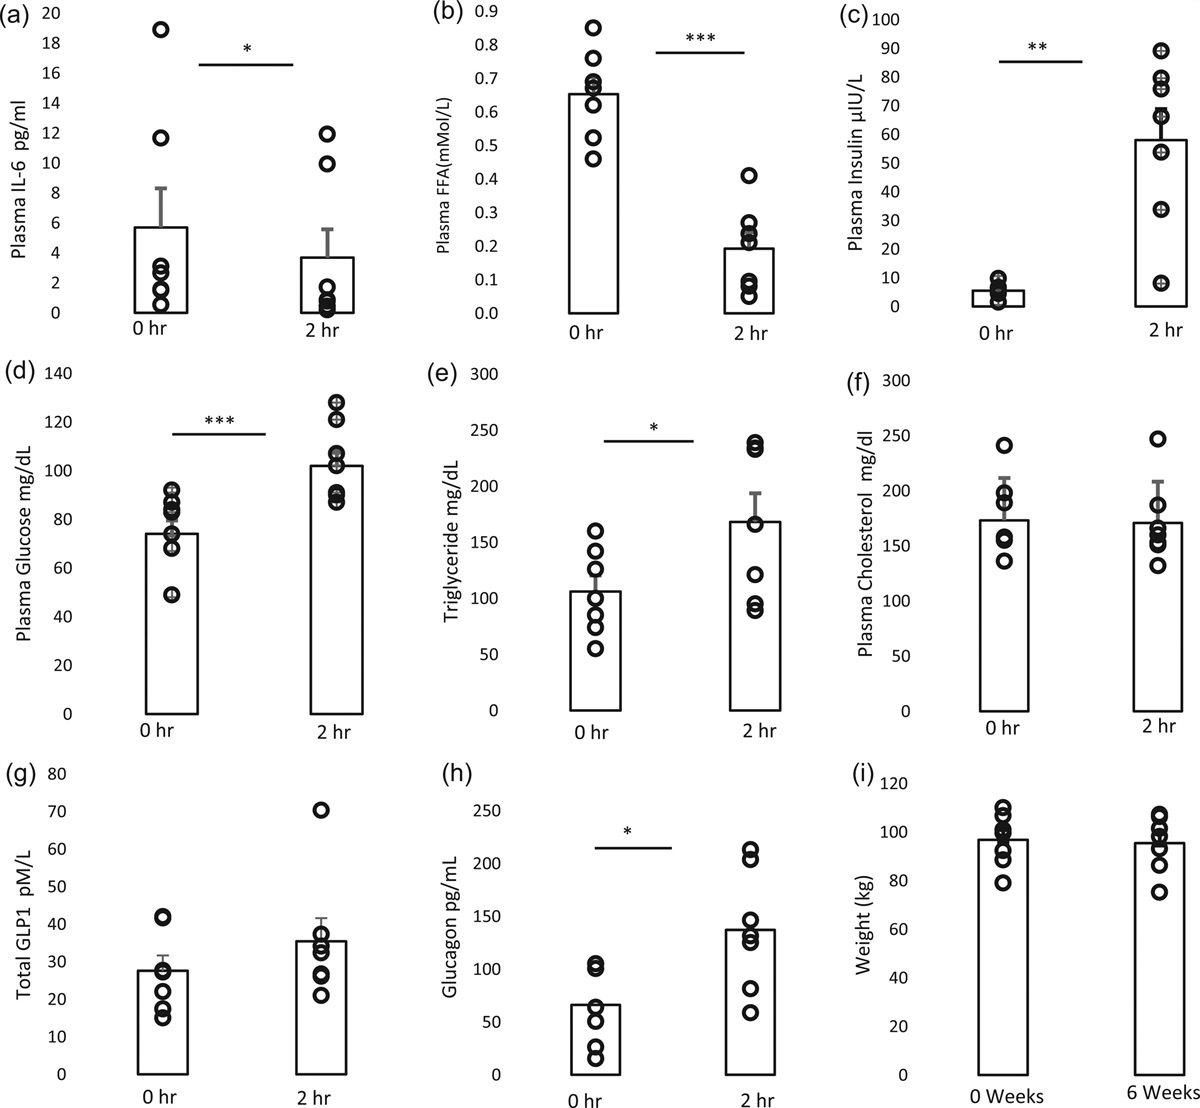
Plasma IL6 decreased from baseline to 2 hours postmeal (5.7 ± 2.6 to 3.7 ± 1.9 pg/ml, P = 0.016). Free fatty acids (FFA) also decreased postmeal (0.65 ± 0.05 to 0.19 ± 0.05 mMol/L, P < 0.001), with increases in plasma insulin (5.5 ± 0.9 to 58 ± 10.8 mIU/L, P = 0.002), plasma glucose (77 ± 6 to 104 ± 6 mg/dl, P < 0.0001), triglycerides (106 ± 14 to 168 ± 26 mg/dl, P = 0.0178), and plasma glucagon (66.0 ± 14.1 to 137.2 ± 21.7 pg/ml, P = 0.018). Compared to prior literature, this study’s baseline total GLP1 level measured as expected after 6 weeks of exenatide ER therapy [12] and showed a non-statistically significant postprandial increase (27.6 ± 4.1 to 35.4 ± 6.2 pM/L, P = 0.1763) at the expected magnitude [13]. No significant changes were seen with total cholesterol. As seen in a prior study [14], our data showed that 6 weeks of exenatide ER therapy did not change weight (Fig. 1).
 Fig. 1:
 The postprandial effect of 6 weeks of exenatide ER on plasma IL-6 (a), plasma FFA (b), plasma insulin (c), plasma glucose (d), plasma triglycerides (e), total cholesterol (f), plasma total GLP-1 (g), and plasma glucagon (h) before and after meal challenge, and weight (i) before and after treatment. The data are mean ± SEM. n = 7 *P < 0.05, **P < 0.01, ***P < 0.001.
DiscussionIn contrast to findings seen after acute GLP1 therapy in a prior study [7], we show for the first time that chronic GLP1 therapy decreases postprandial plasma IL6 in insulin-resistant humans. Subjects completed 6 weeks of chronic GLP1 therapy prior to postprandial challenge. As expected, 6 weeks of therapy did not change weight [14]. A small increase in GLP1 was seen after the meal. The expected changes in postprandial FFA, insulin, glucose, and glucagon were observed [15,16]. While glucagon increase was observed, the magnitude was likely blunted by GLP1 [16].
GLP1-IL6 interactions represent a novel area of investigation. We recently demonstrated that 1) GLP1 analogs activate human monocytes to secrete IL6, 2) GLP1 analogs acutely increase systemic IL6 circulation in humans, and 3) GLP1-IL6 axis induces adipose tissue browning in rodent models [7]. The type of tissue secreting IL6 may influence a pro- or anti-inflammatory effect [17]. Numerous tissues express IL6 receptor, which binds IL6 via canonical and/or trans-signaling [1].
The mechanism of IL6 induction by chronic GLP1 analog therapy remains unknown. A murine study shows the PKA/CREB pathway may play an important role in IL6 reduction in cartilage [18]. More studies are warranted in other tissues.
There are important limitations to these findings. The study focuses on IL6 changes in the postprandial state and does not address the fasting state. A comparison to acute postprandial state (i.e. after single dose of GLP1 treatment, and no prior therapy) can be made with our previous study [7]. A larger study examining postprandial GLP1-IL6 effects in human adipose, muscle, and soft tissues following chronic therapy is necessary to delineate novel mechanisms. Notably, chronic exenatide ER also slows gastric emptying [16], but at a magnitude less than acute exenatide [7]. The postprandial insulin, glucose, and FFA findings in this study, when compared to our prior study with acute exenatide [7], reflect less gastric emptying activity.
Notably, the majority of study subjects were Black (4 females and 2 males). African Americans, particularly females, generally exhibit higher baseline IL6 levels [19,20] and greater increases in postprandial inflammatory responses than matched Caucasian individuals [21,22]. African American women also generally have less visceral fat but more insulin resistance than Caucasian women [23]. Hence, ethnicity may potentially impact IL6 response.
The unexpected fall in postprandial plasma IL6 after chronic GLP1 calls for further investigation of the mechanisms underlying acute versus chronic GLP1-IL6 signaling.
AcknowledgementsWe thank Kathy Franco, Theresa Danczak, Meagan Olivares, Kayla Ruch, Monika Ruscheinsky, Vu Ta, Christine Wong, Sara Coverdale, Kayla Riggs, Jon Tyson, the UT Houston Clinical Research Unit, Memorial Hermann Hospital, and Quest Laboratories for clinical trial support, oversight, and laboratory assistance. We thank the UT Houston CCTS Biostatistics, Epidemiology, and Research Design group for statistical support.
Conflicts of interestThere are no conflicts of interest.
References 1. Mauer J, Denson JL, Bruning JC. Versatile functions for IL-6 in metabolism and cancer. Trends Immunol 2015; 36:92–101. 2. Sun K, Gao Z, Kolonin MG. Transient inflammatory signaling promotes beige adipogenesis. Sci Signal 2018; 11:eaat3192. 3. Goldman JD. Cardiovascular safety outcomes of once-weekly GLP-1 receptor agonists in people with type 2 diabetes. J Clin Pharm Ther 2020; 45(Suppl 1(Suppl 1):61–72. 4. Ellingsgaard H, Seelig E, Timper K, Coslovsky M, Soederlund L, Lyngbaek MP, et al. GLP-1 secretion is regulated by IL-6 signalling: a randomised, placebo-controlled study. Diabetologia 2020; 63:362–373. 5. Lang Lehrskov L, Lyngbaek MP, Soederlund L, Legaard GE, Ehses JA, Heywood SE, et al. Interleukin-6 delays gastric emptying in humans with direct effects on glycemic control. Cell Metab 2018; 27:1201–1211.e3. 6. Lehrskov LL, Christensen RH, Wedell-Neergaard AS, Legaard GE, Dorph E, Larsen MK, et al. Effects of exercise training and IL-6 receptor blockade on gastric emptying and GLP-1 secretion in obese humans: secondary analyses from a double blind randomized clinical trial. Front Physiol 2019; 10:1249. 7. Gutierrez AD, Gao Z, Hamidi V, Zhu L, Saint Andre KB, Riggs K, et al. Anti-diabetic effects of GLP1 analogs are mediated by thermogenic interleukin-6 signaling in adipocytes. Cell Rep Med. 2022; 3:100813. 8. Manning PJ, Sutherland WH, McGrath MM, de Jong SA, Walker RJ, Williams MJ. Postprandial cytokine concentrations and meal composition in obese and lean women. Obesity (Silver Spring) 2008; 16:2046–2052. 9. Parvaresh Rizi E, Baig S, Shabeer M, Teo Y, Mok SF, Loh TP, et al. Meal rich in carbohydrate, but not protein or fat, reveals adverse immunometabolic responses associated with obesity. Nutr J 2016; 15:100. 10. ElSayed NA, Aleppo G, Aroda VR, Bannuru RR, Brown FM, Bruemmer D, et al., on behalf of the American Diabetes Association. 2 Classification and diagnosis of diabetes: standards of care in diabetes-2023. Diabetes Care 2023; 46:S19–S40. 11. Hamidi V, Riggs K, Zhu L, Bermudez Saint Andre K, Westby C, Coverdale S, et al. Acute exenatide therapy attenuates postprandial vasodilation in humans with prediabetes: a randomized controlled trial. Metab Syndr Relat Disord 2020; 18:225–233. 12. Fineman M, Flanagan S, Taylor K, Aisporna M, Shen LZ, Mace KF, et al. Pharmacokinetics and pharmacodynamics of exenatide extended-release after single and multiple dosing. Clin Pharmacokinet 2011; 50:65–74. 13. Kim SH, Abbasi F, Nachmanoff C, Stefanakis K, Kumar A, Kalra B, et al. Effect of the glucagon-like peptide-1 analogue liraglutide versus placebo treatment on circulating proglucagon-derived peptides that mediate improvements in body weight, insulin secretion and action: A randomized controlled trial. Diabetes Obes Metab 2021; 23:489–498. 14. Guja C, Frias JP, Somogyi A, Jabbour S, Wang H, Hardy E, et al. Effect of exenatide QW or placebo, both added to titrated insulin glargine, in uncontrolled type 2 diabetes: The DURATION-7 randomized study. Diabetes Obes Metab 2018; 20:1602–1614. 15. Koska J, Lopez L, D’Souza K, et al. Effect of liraglutide on dietary lipid-induced insulin resistance in humans. Diabetes Obes Metab 2018; 20:69–76. 16. Jones KL, Huynh LQ, Hatzinikolas S, Rigda RS, Phillips LK, Pham HT, et al. Exenatide once weekly slows gastric emptying of solids and liquids in healthy, overweight people at steady-state concentrations. Diabetes Obes Metab 2020; 22:788–797. 17. Han MS, White A, Perry RJ, Camporez J-P, Hidalgo J, Shulman GI, et al. Regulation of adipose tissue inflammation by interleukin 6. Proc Natl Acad Sci U S A 2020; 117:2751–2760. 18. Que Q, Guo X, Zhan L, Chen S, Zhang Z, Ni X, et al. The GLP-1 agonist, liraglutide, ameliorates inflammation through the activation of the PKA/CREB pathway in a rat model of knee osteoarthritis. J Inflamm (Lond) 2019; 16:13. 19. Morimoto Y, Conroy SM, Ollberding NJ, Kim Y, Lim U, Cooney RV, et al. Ethnic differences in serum adipokine and C-reactive protein levels: the multiethnic cohort. Int J Obes (Lond) 2014; 38:1416–1422. 20. Carroll JF, Fulda KG, Chiapa AL, Rodriquez M, Phelps DR, Cardarelli KM, et al. Impact of race/ethnicity on the relationship between visceral fat and inflammatory biomarkers. Obesity (Silver Spring) 2009; 17:1420–1427. 21. Olenick AA, Pearson RC, Shaker N, et al. African American females are less metabolically flexible compared with caucasian american females following a single high-fat meal: a pilot study. Int J Environ Res Public Health 2022; 19:12913. 22. Pearson RC, Olenick AA, Shaker N, Blankenship MM, Tinius RA, Winchester LJ, et al. High-fat meal increases peripheral blood mononuclear cell pro-inflammatory cytokine expression in African-American women. Appl Physiol Nutr Metab 2021; 46:661–668. 23. Lovejoy JC, de la Bretonne JA, Klemperer M, Tulley R. Abdominal fat distribution and metabolic risk factors: effects of race. Metabolism 1996; 45:1119–1124.
Comments (0)