
Remember me
The HIV epidemic is a public health concern in sub-Saharan Africa, where HIV is the leading cause of death and 67% of people with HIV worldwide live (UNAIDS, 2022b). In sub-Saharan Africa, adolescent girls and young women (AGYW) are disproportionately affected by HIV, accounting for 63% of new infections (Murewanhema et al., 2022; UNAIDS, 2022b). AGYW's vulnerability stems from a variety of social and structural factors, including a lack of knowledge about HIV, unprotected sex, difficulties in advocating for safe sexual practices, low education level, gender-based violence, and early marriage (Darteh, 2020; Gourlay et al., 2021; Mwale & Muula, 2018). Cameroon, located in Sub-Saharan Africa, has a remarkable disparity in HIV prevalence between male and female adolescent and young people (UNAIDS, 2022a). As a result, it is important to develop, test, and implement theory-informed and culturally tailored interventions among AGYW to promote HIV testing, prevention, and treatment in Cameroon (Frimpong et al., 2021; Saul et al., 2018).
Mobile Health (mHealth) is the use of portable electronic devices with software applications (apps) to provide health services and management of patient information (Betjeman et al., 2013; Chowdhury & Sharmin Jahan, 2014; Khan & Alotaibi, 2020; Ni et al., 2018,2022). Thanks to the rapid increase in smartphone use in low- and middle-income countries (Marcolino et al., 2018), mHealth can provide high-quality health care and supplementary health services to vulnerable populations (Chowdhury & Sharmin Jahan, 2014; Krishnan et al., 2015). In the field of HIV, the primary use of mHealth often involves using mobile apps to educate users thus strengthening health promotion and preventive health care services (Shrestha et al., 2017; Visser et al., 2020). Also, mHealth provides a unique and affordable opportunity for the diffusion of communications for behavioral change and decision-making support (Gagnon et al., 2016; Schnall et al., 2015a; Schnall et al., 2015b; Schnall, Mosley, et al., 2015cSchnall, Mosley, et al., 2015).
Studies have shown that mHealth is effective in promoting users' knowledge about HIV and behavioral change as well as increasing their access to sexual and reproductive health services (Betjeman et al., 2013; Daher et al., 2017; Feroz et al., 2021). However, there is a knowledge gap on the topics of the feasibility, acceptability, and effectiveness of mHealth interventions in promoting HIV testing, prevention, and treatment among AGYW in Cameroon. To date, there have been only a few studies conducted in Cameroon that evaluate effectiveness of mHealth interventions on adherence to or retention in HIV (Bigna et al., 2014; Mbuagbaw et al., 2012; Nsagha et al., 2016; Wirsiy et al., 2019) and tuberculosis treatments (Bediang et al., 2018; Wirsiy et al., 2019), as well as reproductive health education (Wirsiy et al., 2019,2022). Results from the above studies showed effectiveness in improving knowledge and instigating behavior change but were inconclusive in improving adherence to treatment and retention in care, notably HIV and tuberculosis treatments. More so, none of these studies focused on AGYW and the mHealth interventions employed were primarily short messaging service and phone calls. Understanding the feasibility and acceptability of using mobile apps among AGYW is a crucial first step in developing mHealth interventions and advocating for their testing and implementation among health professionals and policy makers. This study was thus conducted with the primary objective of investigating the feasibility and willingness of AGYW to use mobile apps for HIV testing, prevention, and treatment in Cameroon.
Methods Study Design and ParticipantsA cross-sectional study was conducted between February and June 2023 among 637 AGYW in Yaounde, the metropolitan capital of Cameroon, where residents come from across the country. Participants' inclusion criteria were as follows: (a) at least 18 years of age; (b) cisgender girls or women; (c) mentally healthy for voluntary and informed consent; (d) able to understand and answer questions.
Participants were recruited using a combined method of multistage cluster and snowball sampling techniques, ensuring the inclusion of a diverse group of participants from different regions of origin. At the first stage of cluster sampling, we randomly selected four health districts, Biyem Assi, Cité Verte, Djoungolo, and Efoulan, from the six centralized districts of Yaounde, and one health district, Soa, from the five bordering health districts. At the second stage of cluster sampling, we randomly selected a minimum of two health areas from each of the above five health districts (each composed of 4–12 health areas). The next phase of sampling used the snowball technique where two well-trained data collectors recruited, by convenience, participants from the above selected health areas. An online survey was administered by the two data collectors using their phones while meeting participants at a safe and quiet place to ensure participants' confidentiality. The consenting participants were then invited to refer their friends whom they thought would be interested in the study. To reduce selection bias, the maximum number of referrals per participant was five, and of those AGYW, only two randomly selected participants could further refer potential participants. Although this sampling technique was nonprobabilistic, it was culturally tailored and advantageous in recruiting hard-to-reach AGYW in Cameroon and those who were shy about participating in studies involving a sensitive topic, such as sexuality.
The published formula (Bland, 2000), n=Z2 p(1‐p)/d2 was used to calculate the estimated study sample size. In the formula, p stands for the presumptive proportion of AGYW who would accept using mobile apps for HIV testing, prevention, and treatment, which was set at 50% given the statistic was unknown for Cameroon. The letter Z represents the Z score, which was set at 1.96, and d stands for the acceptable type I error margin, which was set at 5%. According to the formula, the minimum sample size was 385.
Ethical ConsiderationsThis study was conducted on ethical approval, in Cameroon, from the Centre Regional Ethics Committee for Human Health Research (Initial: CE No 02058/CRERSHC/2022 and Extension: CE No 02058/CRERSHC/2023) and administrative authorization from the Centre Regional Delegation for Public Health. Also, this study was approved by the Yale University Institutional Review Board (IRB ID: 2000033713). The study questionnaire was only administered to persons who had voluntarily consented to participate. Consenting was done only after the data collector (with the help of a study information sheet) explained to the potential participant what the study was about, the importance of collecting their data, and how these data would be archived and used to ensure their privacy.
Data Collection and MeasuresStudy data were collected with the assistance of the two trained data collectors using an online Qualtrics questionnaire that consists of two sections. The first section of the questionnaire collected information about participants' sociodemographic characteristics, access to mobile phones, use of mobile technologies, sexual orientation, HIV testing, awareness of pre-exposure prophylaxis (PrEP), history of sexually transmitted infections (i.e., chlamydia, gonorrhea, syphilis, and hepatitis B and C), and HIV vulnerability, which was assessed as a composite score of participants' chance of condomless sex in any one of the following three scenarios: (a) with multiple partners, (b) with someone whose serological status is unknown, or (c) with someone HIV+ but not on treatment or whose treatment status is unknown. The second section of the questionnaire assessed AGYW's willingness to use mobile apps for HIV testing, PrEP service, and HIV treatment. Also, participants were questioned about the underlying reasons for their choices for mobile app use. It is worth noting that, to ensure data privacy and confidentiality, only pseudonymized data were keyed on Qualtrics and only traceable to identifiers of participants known only to study data collectors who were actively implicated in field work and J.J.N.N. who is in possession of the signed informed consents. To encourage true responses, the data collectors provided opportunity for participants to answer sensitive questions themselves by handing over their phones to participants. For those questions, participants could thus choose on their own without discussing their response with data collectors.
Feasibility in this study was assessed by taking into consideration phone ownership, type of phone, and routine habits with phone. Phone ownership was measured as a proportion where the numerator was the number of study participants who owned a mobile phone (with priority given to phones with internet) and the denominator was the total number of study participants. However, participants' routine habits with mobile technology (with priority given to internet browsing, social networking, and app use) were measured as proportions where, in each case, the numerator was number of participants who used the phone for a specified activity and the denominator was the total number of study participants.
Willingness was measured as a proportion where the numerator was the number of participants willing to use a mobile app for HIV testing, PrEP, or treatment services and the denominator was the total number of study participants in each case.
Statistical AnalysesThe research data were downloaded from Yale Qualtrics and cleaned on Microsoft Excel 2016. All data analyses were conducted using statistical software R version 4.3.1 where continuous variables were presented in median and interquartile range, and categorical variables were presented as overall and cross-tabulated frequencies. To determine factors associated with the willingness to use mobile apps for any one of HIV testing, PrEP services, and HIV care services, the binomial logistic regression—general linear model function—was used where the factors were initially identified through univariate logistic regression analyses with significance set at 10% (p < .1) and then adjusted for each other's effect in a multivariate logistic regression model. To assess the influence of participants' region of origin on the above acceptability, the above multivariate model was also adjusted for geographical zones. The level of significance in the multivariate logistic regression model was set at 5% (p < .05).
Results Participant CharacteristicsA total of 807 AGYW were approached, of whom 637 (78.9%) consented and participated in the study. Participants' median age was 22 years (interquartile range: 21–24), more than half (n = 362; 56.8%) of them were between 22 and 25 years old and more than three-fourths (n = 485; 76.1%) of them were unmarried (Table 1). Of the 637 AGYW, most (n = 608; 95.6%) were living with their family members and/or friends, 82.3% (n = 428) had an average monthly revenue less than 50,000 XAF (equivalent to 82 USD), 71.8% (n = 457) were students, and 66.5% (n = 424) had received secondary education. The study succeeded to recruit participants whose origins were from all 10 regions of Cameroon although it should be noted that those from the grand west zone of Cameroon accounted for 66.5% (n = 426) of all study participants. Most participants (n = 599; 94%) were heterosexual. Although 34.4% (n = 219) of them reported potential vulnerability to HIV, only 16.1% (n = 102) of them had tested for HIV in the past 3 months. Among the participants, 81.5% (n = 519) were not aware of PrEP, 31.2% (n = 199) had never tested for HIV, and 20.3% (n = 129) had been diagnosed with a sexually transmitted infection (STI) within the past 6 months.
Table 1. - Participants' Baseline Characteristics (N = 637) Variable n (%) Variable n (%) Age group Marital status 18–20 years 154 (24.2) Divorced/widowed 7 (1.1) 21–25 years 362 (56.8) Married/partnered 145 (22.8) 26–30 years 121 (20) Unmarried 485 (76.1) Average monthly revenuea 520 Living situation 636 Less than 50,000 XAF (82 USD) 428 (82.3) Living alone 28 (4.4) 50,000–100,000 XAF (82–165 USD) 73 (14%) Live with others 608 (95.6) More than 100,000 XAF (165 USD) 19 (3.7) Education level Occupationb Uneducated/primary 96 (15.1) Unemployed 44 (6.9) Secondary 424 (66.5) Student 457 (71.8) Diploma/degree 95 (14.9) Informal sector 78 (12.2) Masters/PhD 22 (3.5) Formal sector 58 (9.1) Geographical zone of originc Situation with HIV testing Grand West 426 (66.9) Never tested 199 (31.2) Grand South 170 (26.7) Tested in more 12 months 229 (35.9) Grand North 13 (2.0) Tested in 3–12 months 107 (16.8) Foreigner/not provided 28 (4.4) Tested within last 3 months 102 (16.1) Sexual orientation Aware of PrEP Heterosexual/straight 599 (94) No 519 (81.5) Bisexual/lesbian/other 38 (6) Yes 118 (18.5) Potential HIV vulnerability History of an STI in 6 months No 418 (65.6) No 508 (79.7) Yes 219 (34.4) Yes 129 (20.3)Note. PrEP = pre-exposure prophylaxis; STI = sexually transmitted infection.
aXAF is the currency used by countries of Central Africa (CFA Francs).
bInformal sector; work without health insurance cover and/or pension (e.g. hairdresser, tailor, sales agent etc).
cGeographical zones are as thus: Grand West; Northwest, Southwest and West regions, Grand South; South, Littoral, Centre, and East regions, Grand North; Far North, North, and Adamawa regions.
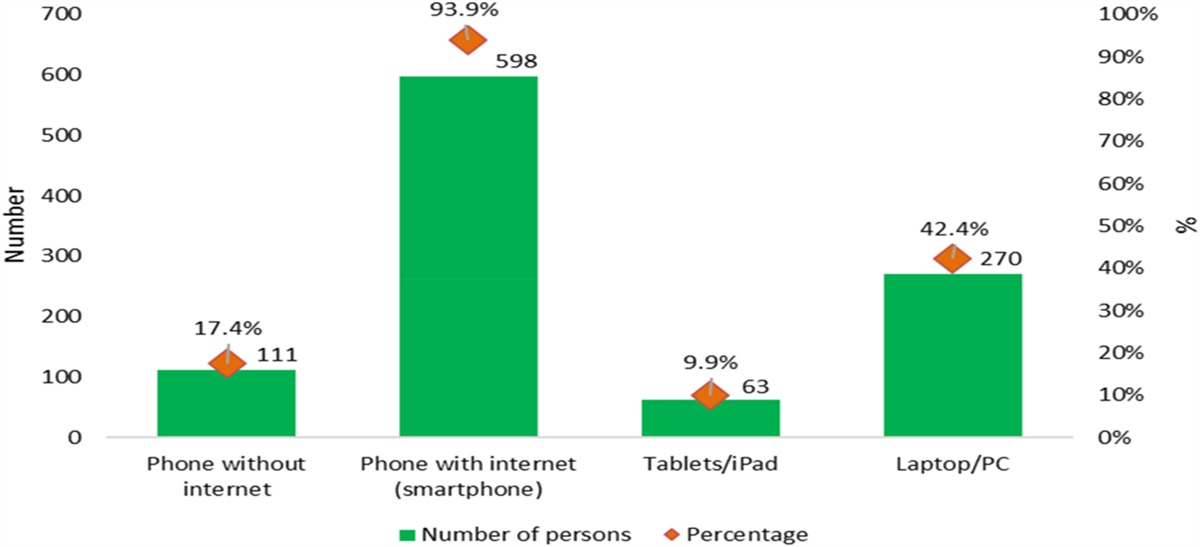
Of the 637 AGYW, 93.9% (n = 598) had a phone with internet (smartphone), 42.4% (n = 270) had a personal laptop or computer, 17.4% (n = 111) owned a phone without Internet (feature phone), and 9.9% (n = 63) had a tablet or iPad (Figure 1). Participants' habits with mobile technology is summarized in Table 2. The total percentages of AGYW who used mobile technology “sometimes”, “often”, and “all the time” to make/receive phone calls, send/receive text messages, browse websites and apps, and for online networking were 98.4% (n = 627), 97.4% (n = 621), 92.5% (n = 589), and 90.9% (n = 579), respectively. Similar popularity was reported on taking pictures (n = 568; 89.1%), listening to music (n = 545; 85.5%), recording videos (n = 533; 83.7%), and playing games (n = 469; 73.7%). Nearly half (n = 315; 49.5%) of the participants searched health-related information on their phones, 48.9% (n = 312) of them used health-related apps and send/receive emails (n = 182; 28.6%). Of the 637 AGYW, 15.1% (n = 96) downloaded/watched pornographic videos/pictures, 11.3% (n = 72) had phone sex, and 16.8% (n = 61) had video sex.
 Figure 1.:
 Participants' ownership or access to mobile technology (N = 637).
Table 2. - Participants' Habits With Mobile Technology (N = 637) Variable NeveraPhone sex: A conversation held over the telephone in which people describe sex acts to one another for sexual pleasure.
bVideo sex: Similar above except for the video component where the individuals watch each other do the acts for sexual pleasure.
The overall willingness of AGYW to use mobile apps for any one of HIV testing, PrEP, and treatment services was 89.8% (n = 572). Specifically, the percentages of AGYW willing to use mobile apps for HIV testing, PrEP, and HIV treatment were 87.9% (n = 560), 84.4% (n = 538), and 84.9% (n = 541), respectively (Figure 2).
 Figure 2.:
 Participants' willingness to use mobile app for health (N = 637).
The main reported reasons for AGYW's willingness to use mobile apps were that they believed that mobile apps were convenient, could protect their privacy, and improve their knowledge on HIV (Table 3). The main reported reasons that AGYW were not willing to use mobile apps were that they had no access to the internet or a smartphone, had concerns of the elevated internet cost, and privacy or confidentiality breach. Moreover, not being able to read or use Android system and the perception of not being vulnerable to HIV/AIDS were mentioned by some AGYW.
Table 3. - Reasons for Participants' Choice on Mobile App for Health (N = 637) Reasons HIV testingNote. PrEP = pre-exposure prophylaxis.
In univariate logistic regression analyses (Table 4), we found that AGYW's willingness to use mobile apps for HIV testing, PrEP, and HIV treatment was significantly associated with their age, education, heterosexual orientation, access to a smartphone or tablet, previous use of a health app or a phone to search for health-related information, being aware of PrEP, and having tested for HIV, and being diagnosed with an STI in the past 6 months. After adjusting for each variable's effect in a multivariate logistic regression model, the factors that remained significantly associated with AGYW's acceptability of using mobile apps were increased age, particularly those aged 21–25 years (aOR [CI]: 2.4 [1.23–4.57], p = .022) compared with those aged 18–20 years; had used a health-related app or searched health information by a phone (aOR [CI]: 2.0 [1.04–4.01], p = .038); and had tested for HIV, particularly those who tested less than 12 months ago (aOR [CI]: 3.8 [1.41–10.14], p = .026) compared with those who never tested.
Table 4. - Factors Associated to Participants' Acceptability to Use a Mobile App for Health (n = 637) Variable Total Willing to useNote. aOR = adjusted odd ratio; CI = confidence interval; OR = unadjusted odd ratio; PrEP = pre-exposure prophylaxis; STI = sexually transmitted infection.
Understanding the feasibility and willingness to use mobile apps for HIV testing, prevention, and treatment is a necessary step before developing future mHealth interventions. However, this important information in the context of Cameroon is unknown. To our best knowledge, this study is the first to investigate the feasibility and willingness among AGYW in Cameroon and found that feasibility and willingness are high among AGYW in Cameroon. For example, 93.9% (n = 598) of AGYW living in Yaounde, Cameroon had access to a smartphone, and 89.8% (n = 572) of AGYW demonstrated high acceptance to use mobile apps for HIV testing, PrEP, and HIV treatment. This study lays a foundation for future mHealth studies in Cameroon, and its findings are consistent with similar studies conducted in other sub-Saharan African countries, such as Ghana and Botswana, where at least 8 of 10 adolescents and young adults owned a mobile phone, and over three-fourths expressed interest in using mobile technology (Alhassan et al., 2019; Lavoie et al., 2023). This research finding indicates that developing mHealth interventions has potential for mitigating HIV in sub-Saharan Africa, and therefore, mHealth interventions should be developed
Comments (0)