
Remember me


What Is Known
It has been said that the thickness of the paretic side lateral femoral cartilage is less in stroke patients.What Is New
This is the first study to compare femoral cartilage thickness by grouping stroke patients according to the presence of knee hyperextension. It has been shown that paretic side femoral cartilage thicknesses are lower in stroke patients with knee hyperextension than in those without knee hyperextension. In addition, in stroke patients with knee hyperextension, the thickness of the femoral cartilage on the paretic side was less than on the nonparetic side.Gait disorders are observed in approximately 80% of stroke patients.1 These disorders increase the risk of falling, and accordingly, the patients’ physical activity levels decrease, and their daily living activities are negatively affected.2,3
Hemiparesis that develops in patients after stroke causes asymmetry in gait. The main causes of asymmetric gait are poor selective control, delayed and impaired balance reactions, and less weight transfer to the paretic side.4 Patients develop compensatory mechanisms for this problem to maintain ambulation.5 A compensatory mechanism frequently developing after stroke is knee hyperextension during the stance phase of gait. Thus, the knee can be mechanically locked by compensating for the decreased extensor moment while carrying the load in the stance phase of the hemiplegic limb during walking.6
According to the literature, approximately 65% of stroke patients have knee hyperextension during the stance phase.7 Weakness in the eccentric control of the knee extensors, spasticity in the quadriceps and gastrocnemius muscles, weakness in the hamstrings, and proprioceptive deficiencies can be considered possible etiological causes of knee hyperextension.8 Although stroke patients gain an advantage by walking with knee hyperextension, the biomechanical structure of the knee may be altered. Thus, the risk of injury to the capsular and ligamentous structures is greater. Injuries to these tissues cause pain, ligamentous laxity, and bone deformities.9 In addition, this biomechanical disorder in the knee disturbs the normal gait pattern, adversely affecting the balance of patients, increasing their energy consumption, decreasing their gait speed and capacity, and causing deformities.9,10
Immobilization of limbs after stroke causes articular cartilage degeneration. Because the synthesis of the matrix components of the articular cartilage by chondrocytes is stimulated by loading and mechanical stimulation, a lack of loading may increase cartilage destruction. Likewise, because patients tend to transfer weight to the nonparetic limb, a load difference occurs between the lower limb joints. Therefore, it is thought that femoral cartilage thickness will be affected in stroke patients.11–13 Only one study14 in the literature examines femoral cartilage thickness in stroke patients. However, in that study, the patients were not grouped; only paretic and nonparetic side femoral cartilage thicknesses were compared.
Considering this information, it is thought that the femoral cartilage thickness will differ between the paretic and nonparetic limbs and between stroke patients with and without knee hyperextension in the stance phase.
AIMS AND HYPOTHESISThe first aim of this study was to measure knee hyperextension and femoral cartilage thickness (paretic and nonparetic side) in stroke patients. The second aim was to compare femoral cartilage thickness in the paretic and nonparetic limbs in stroke patients with and without knee hyperextension. The hypotheses of our study are as follows:
H0: There is no difference in femoral cartilage thickness between stroke patients with and without knee hyperextension. H1: There is a difference in femoral cartilage thickness between stroke patients with and without knee hyperextension. METHODS Study Design and ParticipantsThe study was conducted with a cross-sectional design, registered at ClinicalTrials.gov (NCT05513157). It was performed following the Declaration of Helsinki, and ethical approval was granted by the Atılım University Human Research Ethics Board (E-59394181-604.01.02-37185). This study conforms to all STrengthening the Reporting of OBservational studies in Epidemiology guidelines and reports the required information accordingly (see Supplementary Checklist, Supplemental Digital Content 1, https://links.lww.com/PHM/C133). Forty hemiparetic stroke patients (20 men and 20 women) were enrolled in the study. After motion analysis, the stroke patients with knee hyperextension were included in the study group for statistical analysis, while those without knee hyperextension were included in the control group. Participant assessment started in August 2022 and ended in November 2022 at Hacettepe University Biomechanics Research Laboratory and Atılım University. All participants signed the ethics committee–approved informed consent form.
To avoid bias in the analysis results, the inclusion and exclusion criteria were carefully determined to ensure that the patients had similar characteristics. The inclusion criteria for the study were as follows: (1) at least 6 mos had passed since the stroke,15 (2) modified Rankin score 0–3, (3) age 40–65 yrs old,15 Standardized Mini Mental Test score >24, and (4) able to walk at least 500 meters independently (walking independently without using any assistive device, brace or orthosis). The exclusion criteria were as follows: (1) history of more than one stroke,15 (2) known presence of dementia, (3) known additional orthopedic, psychiatric, or other neurological diseases,15 (4) history of surgery involving the lower limbs and gait, (5) history of knee trauma, and (6) orthopedic problems that may cause movement limitations (fracture, osteoporosis, or inflammatory arthritis).
Sample SizeThe study’s sample size was calculated with the G*Power 3.1 analysis system. The initial analysis was based on the results of a study that included two groups with different knee joint biomechanics similar to our study.16 Considering the femoral cartilage thicknesses (effect size, 1.81) in that study,16 it was determined that the number of patients to be included in each group should be at least 10 for the study to have a power of 95%. Considering the data loss, it was planned to recruit 20 patients for each group meeting the study criteria. When the power of the study sample was calculated, the study’s effect size was 0.89, the α value was 0.05, and the power was 0.85.
ProceduresThe demographic and clinical characteristics of the patients, including age, sex, and body mass index, were recorded.
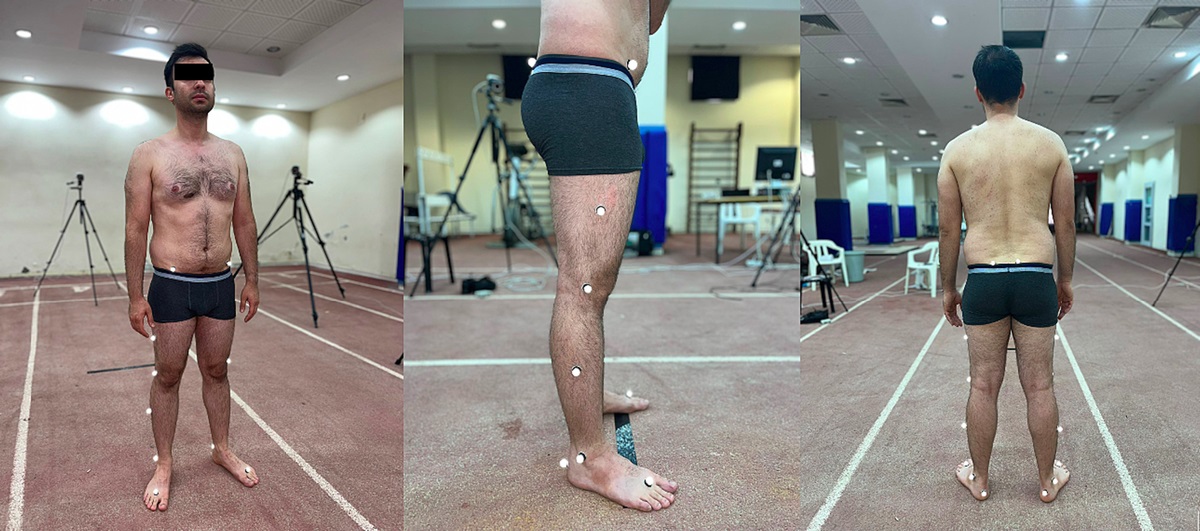
Motion AnalysisThe Conventional Gait Model, which provides reliable lower-body kinematic modeling,17,18 was used as the skeleton labelling template. Following the Plug-in Gait template, 16 reflective markers were positioned on each patient’s pelvis and lower limbs (Fig. 1). A motion capture system (Vicon Ltd, Bilston, West Midlands England) with eight near-infrared optical cameras (Bonita model) was used to record motion. The motion capture area was calibrated using a 5-point calibration wand. Patients with reflective markers were asked to walk at normal walking speed in a 5-meter walking area. Knee hyperextension analysis were taken while the patients were not using any orthosis or assistive device. The patients walked at a normal walking speed. After two test walks, movements during the third were video recorded using Blade software (version 2.6.1; Vicon Ltd) at 240 frames per second.
 FIGURE 1:
 Reflective markers.
Blade software’s full-body skeleton labelling template consisting of 53 markers was customized and adapted to match the 16-marker lower-body Conventional Gait Model. Then, the three-dimensional spatial coordinates of the markers were reconstructed and labeled using the built-in operators of Blade software. Then, the segments were defined, and joint angles were obtained using the built-in inverse kinematics solver in the software. The maximum knee extension angle during the stance phase of the affected limb was recorded. A maximum knee extension angle beyond 0 degrees was considered hyperextension.19
Ultrasonographic Cartilage MeasurementsUltrasonography is a valid and reliable method for measuring femoral cartilage thickness. Ultrasonographic measurements were made using linear probes (7- to 12-MHz Logiq P5, GE Medical Systems, WI; 6- to 18-MHz MyLab series, Esaote Biomedica, Italy). While the patients sat comfortably on the examination table with their knees in maximum flexion, the probe was placed in an axial position on the suprapatellar area. Cartilage thickness was measured at the central points of the right medial condyle, right lateral condyle, right intercondylar area, left medial condyle, left lateral condyle, and left the intercondylar area. The distance between the thin hyperechoic line at the synovial space-cartilage interface and the sharp hyperechoic line at the cartilage-bone interface was the cartilage thickness (Fig. 2).20
 FIGURE 2:
 Ultrasonography images.
Statistical AnalysisIBM SPSS Statistics 22 was used for the statistical analysis. After the data were processed, frequency analyses were used to determine the demographic characteristics, and descriptive statistics such as median, minimum value, maximum value, arithmetic mean, and SD were used to define the measured phenomena. The paretic and nonparetic femoral cartilage thicknesses of the groups were investigated by Wilcoxon signed rank test. Maximum knee extension and femoral cartilage thickness of the groups were evaluated with the Mann-Whitney U test. The statistical significance level was set at P = 0.05.
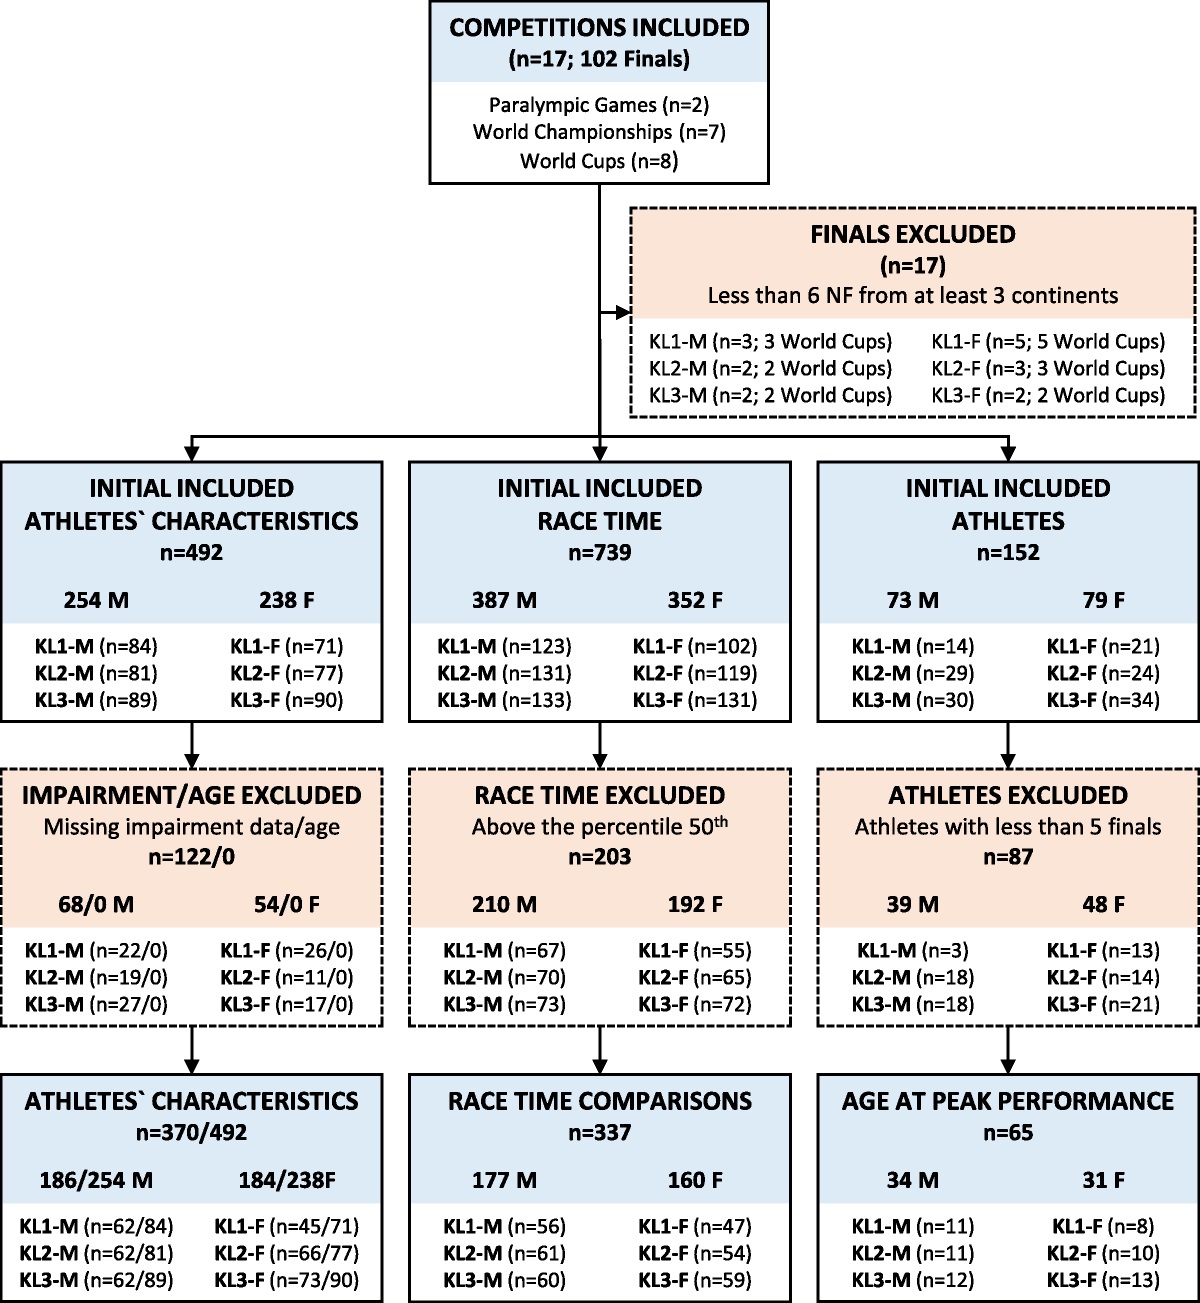
RESULTSInitially, 43 individuals with chronic stroke were included in the study. Two were excluded because of a history of hip arthroplasty surgery, and one because of a history of lower-limb fracture. As a result, the evaluations and statistical analyses were performed with 40 individuals (Fig. 3).
 FIGURE 3:
 Flow diagram.
Demographic and Clinical CharacteristicsWhile 21 stroke patients evaluated by motion analysis had knee hyperextension, 19 did not. For analysis, the stroke patients with knee hyperextension were included in the study group (10 female, 11 male), while the stroke patients without knee hyperextension were included in the control group (10 female, 9 male). The demographic and clinical data of the patients are shown in Table 1. The groups were similar in terms of age, sex, body mass index, duration of stroke, dominant side, and paretic side (P > 0.05). Maximum knee extension during the stance phase evaluated by motion analysis was higher in the study group (P < 0.05) (Table 1).
TABLE 1 - Demographic and clinical characteristics Control Group Study Group Pª X―± SS X ̃ (Min–Max) X―± SS X ̃ (Min–Max) Age, yr 52.47 ± 7.97 54 (40 to 64) 51.48 ± 8.47 49 (40 to 65) 0.664 Duration of stroke, yr 3.84 ± 2.73 3 (1 to 10) 4.52 ± 2.67 5 (1 to 10) 0.396 BMI, kg/m2 24.96 ± 2.93 25.53 (18.73 to 29.76) 26.28 ± 2.85 27.71 (20.55 to 29.41) 0.126 Maximum knee extension, deg 5.96 ± 1.69 5.72 (3.32 to 9.32) −7.52 ± 7.04 −6.92 (−22.13 to −0.02) <0.001 n % n % Pb Sex Female 10 52.6 10 47.6 0.752 Male 9 47.4 11 52.4 Dominant side Right 16 84.2 20 95.2 0.331 Left 3 15.8 1 4.8 Paretic side Right 9 47.4 8 38.1 0.554 Left 10 52.6 13 61.9Expressions in boldface express statistically significant P < 0.05.
a Mann-Whitney U test.
b χ2 test.
X― ± SS, mean ± SD; X̃ (min–max), median (min–max); BMI body mass index.
After the data analysis, the medial femoral cartilage (MFC), lateral femoral cartilage (LFC), and intercondylar (ICA) thicknesses of the paretic and nonparetic sides of the individuals divided into two groups were compared. In the control group, the MFC, ICA, and LFC thicknesses were similar on the paretic and nonparetic sides (P > 0.05). In the study group, the MFC, ICA, and LFC thicknesses were less on the paretic side than on the nonparetic side (P < 0.05) (Table 2).
TABLE 2 - Comparison of femoral cartilage thickness measurements Control Group Study Group Pª X―± SS X ̃ (Min–Max) X―± SS X ̃ (Min–Max) MFC Paretic side 2.14 ± 0.23 2.17 (1.76–2.53) 1.89 ± 0.37 1.95 (1.04–2.90) 0.010 b Nonparetic Side 2.22 ± 0.34 2.18 (1.72–3.10) 2.14 ± 0.39 2.09 (1.61–3.00) 0.424 Pc 0.107 <0.001 b ICA Paretic side 2.54 ± 0.30 2.56 (2.05–3.02) 2.18 ± 0.49 2.23 (1.57–3.60) 0.002 b Nonparetic Side 2.60 ± 0.32 2.62 (2.09–3.11) 2.68 ± 0.55 2.41 (1.83–3.66) 0.839 Pc 0.061 <0.001 b LFC Paretic side 2.12 ± 0.27 2.17 (1.73–2.62) 1.94 ± 0.43 1.83 (1.23–2.90) 0.056 Nonparetic Side 2.15 ± 0.26 2.12 (1.78–2.68) 2.16 ± 0.35 2.13 (1.65–3.20) 0.935 Pc 0.058 0.004 bExpressions in boldface express statistically significant P < 0.05.
a Mann-Whitney U test.
b P < 0.05.
c Wilcoxon signed rank test.
X―± SS, mean ± SD; X̃ (min–max), median (min–max).
When the femoral cartilage thickness of the nonparetic limbs of the two groups was compared, the thicknesses of the MFC, ICA, and LFC were similar (P > 0.05). Examination of the paretic limb femoral cartilage thicknesses of the two groups revealed that the MFC and ICA thicknesses were less in the study group (P < 0.05). However, although the LFC thickness was less in the study group, there was no significant difference between the two groups (P > 0.05) (Table 2).
DISCUSSIONIn the present study, kinematic analysis was performed with a three-dimensional motion analysis system to detect the presence and degree of knee hyperextension in the stance phase. Ultrasonography was used to measure the thickness of the femoral joint cartilage. Current is the first study to compare femoral cartilage thickness by grouping stroke patients according to whether they had knee hyperextension. The study aimed to examine the effect of knee hyperextension on femoral cartilage thickness during the stance phase in stroke patients. Our study showed that paretic side femoral cartilage thicknesses were lower in stroke patients with knee hyperextension than those without knee hyperextension. However, in stroke patients with knee hyperextension, the thickness of the femoral cartilage on the paretic side was less than that on the nonparetic side. In stroke patients without knee hyperextension, paretic and nonparetic side femoral cartilage thicknesses were similar.
Knee hyperextension in the stance phase is common in stroke patients. This hyperextension disrupts the biomechanical structure of the knee.7,9 In our study, while the paretic and nonparetic side femoral cartilage thicknesses were similar in the stroke patients without knee hyperextension, the paretic side femoral cartilage thicknesses were less than those on the nonparetic side in the stroke patients with knee hyperextension. This suggested that biomechanical changes caused by knee hyperextension rather than asymmetry due to hemiparesis affected femoral cartilage thickness in stroke patients.
Dynamic mechanical loading, especially intermittent hydrostatic pressure, is necessary to maintain the integrity of the articular cartilage, which plays an important role in the distribution of contact stresses within the knee joint.21,22 In the literature, it has been stated that there is a general relationship between immobilization and joint cartilage thickness. There are many studies stating that a decrease in the thickness of the femoral cartilage might occur because of the reduction in load due to immobilization or long-term static loading.13,14,23,24 In our study, the paretic side MFC and ICA cartilage thicknesses were lower in stroke patients with knee hyperextension than in those without it. This difference is likely to occur as a result of static loading of the cartilage structure instead of intermittent hydrostatic pressure due to knee hyperextension during walking in stroke patients.
Aula et al.25 stated that MFC is the most stressed articular cartilage in the knee joint during walking in healthy individuals. In the study by Wise et al.,26 it was stated that because the center of gravity passes medial to the knee joint, more load is placed on the medial compartment during normal standing and walking. Considering this information, it is not surprising that we found a difference in MFC cartilage thickness in our study.
In a previous study,14 when the paretic and nonparetic side femoral cartilage thicknesses were compared in stroke patients, it was reported that the MFC and ICA thicknesses were similar in both knees, while the LFC thickness was less on the paretic side. In our study, the MFC, ICA, and LFC thicknesses were similar in both knees in the stroke patients without knee hyperextension, whereas the MFC, ICA, and LFC thicknesses on the paretic side were less than those on the nonparetic side in the stroke patients with knee hyperextension. Although knee hyperextension may temporarily stabilize an unstable knee in stroke patients, long-term hyperextension has disadvantages. Laxity in the posterior capsule, looseness in the anterior cruciate ligament, and changes in the length-tension relationship impair the biomechanics of the knee, and degenerative changes are observed.8 It is an expected result that these biomechanical changes in the knee affected all three cartilage thicknesses in our study. The reason for the difference in results between our study and the other study14 is that we examined the stroke patients in two groups according to whether they had knee hyperextension.
The limitation of our study is that cartilage volume was not evaluated during the examination of cartilage thickness in the patients by ultrasonography. The strengths of our study are that it is the first study in which femoral cartilage thicknesses were compared by grouping stroke patients according to the presence or absence of knee hyperextension. The other strengths of our study are the use of a valid and reliable method, such as a three-dimensional motion analysis system in grouping the patients and the evaluation of the joint cartilage thickness with a valid method, such as ultrasonography.
CONCLUSIONSThe presence of knee hyperextension during walking in stroke patients is an important factor that causes loss of femoral cartilage thickness. In addition, considering our results, it was thought that biomechanical changes caused by knee hyperextension rather than asymmetry due to hemiparesis and impaired loading patterns might affect femoral cartilage thickness in stroke patients. Considering orthopedic problems such as joint degeneration and osteoarthritis caused by changes in cartilage thickness in the knee joint, it is important to evaluate knee hyperextension in stroke patients and to include preventive approaches in the rehabilitation program. Our study is expected to lead to research examining interventions affecting knee hyperextension and femoral cartilage thickness. In addition, knowing the effects of knee hyperextension, common during walking in stroke patients, on joint cartilage thickness will provide important information for clinicians regarding the ambulation processes of these patients and their rehabilitation approaches.
ACKNOWLEDGMENTSThe authors thank all the individuals who participated in the study. The authors dedicate this article to our dear teacher, the late Prof Dr Kadriye Armutlu, who contributed to all stages of this article and passed away on December 25, 2022. May our teacher rest in peace.
REFERENCES 1. Algurén B, Lundgren-Nilsson Å, Sunnerhagen KS: Functioning of stroke survivors—a validation of the ICF core set for stroke in Sweden. Disabil Rehabil 2010;32:551–9 2. Nonnekes J, Goselink RJ, Růžička E, et al.: Neurological disorders of gait, balance and posture: a sign-based approach. Nat Rev Neurol 2018;14:183–9 3. Beyaert C, Vasa R, Frykberg GE: Gait post-stroke: pathophysiology and rehabilitation strategies. Neurophysiol Clin 2015;45(4–5):335–55 4. Roth EJ, Merbitz C, Mroczek K, et al.: Hemiplegic gait. Relationships between walking speed and other temporal parameters. Am J Phys Med Rehabil 1997;76:128–33 5. Oken O, Yavuzer G: Spatio-temporal and kinematic asymmetry ratio in subgroups of patients with stroke. Eur J Phys Rehabil Med 2008;44:127–32 6. Moseley A, Wales A, Herbert R, et al.: Observation and analysis of hemiplegic gait: stance phase. Aust J Physiother 1993;39:259–67 7. Knutsson E, Richards C: Different types of disturbed motor control in gait of hemiparetic patients. Brain 1979;102:405–30 8. Dalal KK, Joshua AM, Nayak A, et al.: Effectiveness of prowling with proprioceptive training on knee hyperextension among stroke subjects using videographic observation- a randomised controlled trial. Gait Posture 2018;61:232–7 9. Cooper A, Alghamdi GA, Alghamdi MA, et al.: The relationship of lower limb muscle strength and knee joint hyperextension during the stance phase of gait in hemiparetic stroke patients. Physiother Res Int 2012;17:150–6 10. Woolley SM: Characteristics of gait in hemiplegia. Top Stroke Rehabil 2001;7:1–18 11. Yalçın S, Kara M, Öztürk GT, et al.: Ultrasonographic measurements of the metacarpal and talar cartilage thicknesses in hemiplegic patients after stroke. Top Stroke Rehabil 2017;24:1–4 12. Trudel G, Uhthoff H, Laneuville O: Knee joint immobility induces Mcl-1 gene expression in articular chondrocytes. Biochem Biophys Res Commun 2005;333:247–52 13. Ando A, Suda H, Hagiwara Y, et al.: Reversibility of immobilization-induced articular cartilage degeneration after remobilization in rat knee joints. Tohoku J Exp Med 2011;224:77–85 14. Tunç H, Öken Ö, Kara M, et al.: Ultrasonographic measurement of the femoral cartilage thickness in hemiparetic patients after stroke. Int J Rehabil Res 2012;35:203–7 15. Wild LB, de Lima DB, Balardin JB, et al.: Characterization of cognitive and motor performance during dual-tasking in healthy older adults and patients with Parkinson's disease. J Neurol 2013;260:580–9 16. Kusiak M, Kawczynski A: Ultrasonographic assessment of articular cartilage of the femoral condyle in patients with an increased Q-angle. J Ultrason 2018;18:181–5 17. Davis RB, Õunpuu S, Tyburski D, et al.: A gait analysis data collection and reduction technique. Hum Mov Sci 1991;10:575–87 18. Kadaba MP, Ramakrishnan HK, Wootten ME: Measurement of lower extremity kinematics during level walking. J Orthop Res 1990;8:383–92 19. Lamontagne A, Malouin F, Richards CL: Locomotor-specific measure of spasticity of plantarflexor muscles after stroke. Arch Phys Med Rehabil 2001;82:1696–704 20. Adiguzel E, Tok F, Ata E, et al.: Ultrasonographic assessment of femoral cartilage thickness in patients with cerebral palsy. PM R 2018;10:154–9 21. Glaser C, Putz R: Functional anatomy of articular cartilage under compressive loading quantitative aspects of global, local and zonal reactions of the collagenous network with respect to the surface integrity. Osteoarthr Cartil 2002;10:83–99 22. Li G, Park SE, DeFrate LE, et al.: The cartilage thickness distribution in the tibiofemoral joint and its correlation with cartilage-to-cartilage contact. Clin Biomech (Bristol, Avon) 2005;20:736–44 23. Vanwanseele B, Lucchinetti E, Stussi E: The effects of immobilization on the characteristics of articular cartilage: current concepts and future directions. Osteoarthr Cartil 2002;10:408–19 24. Babayeva N, Donmez G, Ozcakar L, et al.: Mean femoral cartilage thickness is higher in athletes as compared with sedentary individuals. Knee Surg Sports Traumatol Arthrosc 2021;29:1206–14 25. Aula AS, Toyras J, Tiitu V, et al.: Simultaneous ultrasound measurement of articular cartilage and subchondral bone. Osteoarthr Cartil 2010;18:1570–6 26. Wise BL, Niu J, Yang M, et al.: Patterns of compartment involvement in tibiofemoral osteoarthritis in men and women and in whites and African Americans. Arthritis Care Res (Hoboken) 2012;64:847–52
Comments (0)