
Remember me


Multiple myeloma (MM) with clonal proliferation of malignant bone marrow (BM) plasma cells is a common hematological malignancy in elderly patients.[1–3] Although there has been significant progress in the treatment of MM in recent years, it remains an incurable disease, and the majority of patients eventually relapse, making treatment extremely challenging.[4,5] Therefore, further molecular characterization is required to accurately identify and thwart high-risk MM.
Single-cell technologies are extending the ability to define the complete cellular and molecular makeup of patients, which enables detailed characterizations of tumor cells and their microenvironments.[6–8] Ledergor et al[6] initiated the use of single-cell RNA sequencing (scRNA-seq) to resolve MM and devise a detailed molecular profile of tumor cells in symptomatic and asymptomatic patients. Cohen et al[7] integrated scRNA-seq in clinical trials to characterize patients with highly resistant MM and found that peptidylprolyl isomerase A (PPIA) is an effective therapeutic target for MM. Zavidij et al[8] found that natural killer (NK) cells were frequently more abundant in the early stages of MM and associated with an altered expression of chemokine receptors. A study with a mouse model found that, early in smoldering MM, there was a loss in granzyme K+ memory cytotoxic T cells, along with a loss of their critical role in MM immune surveillance.[8] In addition, the authors reported dysregulation of the major histocompatibility complex (MHC) class II in CD14+ monocytes, leading to T cell suppression in vitro.[8] However, the role of immune cells, especially monocyte/macrophage populations, requires in-depth molecular characterization to stratify and treat at-risk patients more effectively.
In the present study, we used scRNA-seq, bulk-RNA-seq, and flow cytometry to provide insight into the function of immune cells, especially macrophages, in the BM microenvironment of MM patients. Significantly, IFN-induced NK/T cells, terminally differentiated effector memory (TEMRA) cells, ISG+ T-helper (Th) cells, IFN-responding exhausted T cells, MRC1+ dendritic cells (DCs), IFN-responding DCs, MHCII+ DCs, and immunosuppressive monocytes/macrophages were found to be enriched in patients with MM, resulting in an immunosuppressive status. In conclusion, our study deepens the understanding of the immune cell status of the BM microenvironment of MM. In particular, monocytes/macrophages may play a critical role in the development of MM.
Methods Ethical approvalThe study was conducted in accordance with the Chinese Ethical Standards of Human Experimentation and the Declaration of Helsinki 1975 (revised in 2000). This study was approved by the ethics committee at the Affiliated Cancer Hospital of Zhengzhou University and the First Affiliated Hospital of Zhengzhou University (No. 2021-KY-0575-002). Written informed consent was obtained from all participants.
ScRNA-seq analysisScRNA-seq data sets of seven MM BM cells and nine healthy control (HC) BM cells were acquired from the Gene Expression Omnibus (GEO) database (GSE124310), and 10X Genomic scRNA-seq data were acquired from seven MM samples and nine normal BM (NBM) samples reported by Zavidij et al.[8] The study flowchart is shown in Supplementary Figure 1, https://links.lww.com/CM9/B991. Briefly, we combined single-cell data from patients with MM and healthy donors using the merge function in version 3.2.2 of the Seurat R package (version 3.0, https://www.satijalab.org/seurat. Massachusetts, USA), as previously described.[9,10] Cells with more than 200 and fewer than 3000 detected genes, as well as cells with a mitochodrial fraction below 10%, were retained for downstream analyses. The merged data set was normalized using the Seurat “NormalizedData” function with the “LogNormalize” global scaling normalization method, which was multiplied by a scale factor (10,000 by default). It was then scaled through performing the Seurat “ScaleData” function, with a regression of the variation of “nCount_RNA” and “percent.mt.” The Seurat “JackStrawPlot” and “ElbowPlot” functions aided in the selection of suitable dimensionality. The Seurat “RunPCA” function was used to perform a dimension reduction analysis, and the Seurat “RunUMAP” function was used to perform non-linear dimensional reduction. The FindClusters function was performed with a resolution of 0.5, and the RunUMAP function was then used to generate clusters. The FindAllMarkers function (arguments: min. pct = 0.25, logFC threshold = 0.25) was used to find markers through comparing each cluster with all the others; furthermore, the FindMarkers function was used to identify different genes in two identities. A feature plot and a heatmap visualization of gene expression were generated using the Seurat functions FeaturePlot and DoHeatmap, respectively.[10] Clusters consisting of NK/T cells, DCs, T cells, and monocytes/macrophages were extracted and processed again, as described above. Each cell type was further divided into subclusters. Marker genes of each cell type were identified by comparing MM subclusters with NBM subclusters, and an adjusted P value <0.05 was regarded as the cut-off criterion. The marker genes of each cell type were incorporated as differentially expressed genes (DEGs). The cell–cell communication tool Cell Chat was used in the present study to identify the major signals of each of the cell groups and outgoing, incoming, and global communication patterns, as previously described.[11]
Study populationEight HC BM donors and 13 treatment-naïve patients with MM from the Affiliated Cancer Hospital of Zhengzhou University were enrolled in this study. First, 3–5 mL of BM was extracted from the patients with MM and HC donors. All enrolled patients had been pathologically diagnosed with MM and had not received any anticancer treatments.
Preparation of single-cell suspension of mononuclear cellsMononuclear cell suspensions were obtained by removing mature red blood cells from the BM of patients with MM and healthy BM donors with the use of lymphocyte separation medium, as previously described.[12–14] A portion of the obtained mononuclear cells was used for flow cytometry, while another portion was used for the enrichment of CD163+ monocytes/macrophages.
Enrichment of CD163+ monocytes/macrophagesA human CD163 MicroBead Kit (Miltenyi Biotec, Bergisch-Gladbach, Germany) was used to isolate CD163+ monocytes/macrophages from six MM samples and four HC BM samples. We followed the manufacturer’s instructions regarding the specific enrichment of CD163+ monocytes/macrophages. A portion of the enriched CD163+ monocytes/macrophages was subjected to cytospins to observe cell morphology and activity and determine sorting purity. Another portion was subjected to RNA-seq.
RNA-seq analysisTotal RNA was extracted from CD163+ monocytes/macrophages enriched with magnetic beads from six MM patients and four healthy BM donors. This was followed by purification using Qiagen (Düsseldorf, Germany) RNeasy purification columns and the detection of high RNA quality. Next, polyA+ RNA and sequencing libraries were prepared using Oligo (dT) magnetic beads (Cat# 61002, California, USA) for sequencing with an Illumina HiSeq sequencer (San Diego, CA, USA). The library construction and sequencing were entrusted to the Beijing Genomics Institute (BGI). Finally, a comparative analysis was performed using bioinformatics software (Seurat R package), and the up- and down-regulated genes were subjected to a clustering analysis and a Kyoto Encyclopedia of Genes and Genomes (KEGG) pathway analysis using Database for Annotation Visualization and Integrated Discovery (DAVID), as previously described.[12–17]
Flow cytometry staining and analysisEight HC BM donors and 13 treatment-naïve patients with MM were sent for flow cytometry to check the expression of CD14 and CD16 in monocytes/macrophages. The cells were washed once with phosphate buffered saline (PBS) buffer (containing 1% bovine serum albumin [BSA]) and blocking solution (PBS + 0.5% BSA + 1.0% human serum) for 10 min and then stained on ice for 30 min with the appropriate dose of antibodies (anti-human PerCP-CD14 and PE-CY7-CD16 antibodies, used as previously described).[13] The cells were resuspended in 800 μL of PBS buffer (containing 1% BSA); dead cells were removed by adding 4',6-Diamidino-2-phenylindole dihydrochloride (DAPI), and the data were processed using a BD AIR III flow assay. Thereafter, the data were analyzed using the FlowJo software package (BD Bioscience, New York State, USA).[12–14]
Cytospinning and Wright–Giemsa stainingCD163+ monocytes/macrophages from patients with MM and healthy BM donors were enriched with magnetic beads at 0.05 × 10⁶. They were washed once with PBS, resuspended with 200 μL of PBS, placed in a flotation machine (Shandon Cytospin, Thermo Scientific, Massachusetts, USA), and then centrifuged at 280 revolution per minute (rpm) for 10 min. The shakes were removed and dried before Wright–Giemsa staining was performed, as previously described.[12–14] The stained cells were photographed using a microscope to sort for purity determination and the observation of morphological differences between MM and healthy donor cells.
Statistical analysisGraphPad Prism 9.0 (GraphPad Software, Inc., San Diego, USA) was used to perform the statistical analysis. The quantification of CD14 and CD16 percentages was performed using a t test; P <0.05 was used for all data to indicate a statistically significant difference.
Results ScRNA-seq census of MM CD45+ CD138− cell types compared with HCsTo obtain an enhanced understanding of the changes that occur in the tumor microenvironment (TME) of patients with MM (n = 7) compared with HCs (n = 9), we first reanalyzed the 10X Genomic scRNA-seq data from Zavidij et al.[8] The authors reported the scRNA-seq data of monoclonal gammopathy of undetermined significance (MGUS) (n = 5), low-risk smoldering multiple myeloma (SMM) (SMM-low; n = 3), high-risk SMM (SMM-high; n = 8), and newly diagnosed MM (n = 7), as well as those of nine healthy donors (NBM; n = 9), in the original paper.[8] They found that, at the MGUS stage, the populations of NK cells, T cells, and non-classical monocytes increased significantly, and, at the SMM stage, an early accumulation of regulatory and gamma delta T cells, loss of CD8+ memory T cells, and elevation of IFN signaling were observed. Finally, the authors found that, at the MM stage, CD14+ monocytes dysregulated the expression of MHC type II genes, lost the antigen presentation function, and induced a T cell suppressive phenotype. To characterize the dynamic changes in immune cell states at more refined levels between MM and HC, we downloaded and explored the relevant data sets from GSE124310.[8] The present study performed the scRNA-seq of data from 17,663 BM CD45+ CD138– cells of seven patients with MM and nine HCs. We used the Seurat R package to perform the downstream analysis,[8] and applied a principal component analysis and a graph-based clustering approach to categorize individual cells into distinct clusters. Thereafter, Uniform Manifold Approximation and Projection (UMAP) was used to reduce the dimensionality and visualize the cell distribution. To build on this, we assigned the clusters to 11 major cell lineages through well-recognized marker genes [Supplementary Figure 2A,B, https://links.lww.com/CM9/B991]. The marker genes for the immune cell clusters (T, B, NK, and DC cells and monocytes/macrophages) are presented in Supplementary Figure 2C, https://links.lww.com/CM9/B991. We next analyzed the compositions of immune cells from patients with MM and HCs. There was a tendency for the proportions of T, B, and NK cells to increase and the proportions of DCs and monocytes/macrophages to decrease; however, no statistically significant differences were found between the T, B, NK, and DC cells or monocyte/macrophage populations of patients with MM and HCs [Supplementary Figure 2D, https://links.lww.com/CM9/B991]. Supplementary Figure 2E, https://links.lww.com/CM9/B991 illustrates that the patient-specific immune cell compositions, which suggest different grades of MM, might influence immune cell infiltration in the microenvironment. Of the seven patients with MM, patient 8 had an extremely different type of immune cells and exhibited higher proportions of monocytes/macrophages and DC cells. Moreover, B cells accounted for more than 50% of the cells in patient 1 [Supplementary Figure 2E, https://links.lww.com/CM9/B991].
Increase of IFN-induced NK/T cells in MM microenvironmentTo uncover the heterogeneous role of NK/T cells in the MM microenvironment and compare it with HCs, we used UMAP to recluster 977 NK/T cells [Supplementary Figure 3A, https://links.lww.com/CM9/B991] and obtained three clusters. The UMAP plot shows the subcluster distribution between NBM and MM [Supplementary Figure 3B, https://links.lww.com/CM9/B991]. We next calculated the proportion of each cell type in NBM and MM and found that only cluster 2 increased significantly in the MM group of patients compared with the NBM controls [Supplementary Figure 3C, https://links.lww.com/CM9/B991]. The FeaturePlot of the marker genes for each cluster is displayed in Figure 2D. It is noteworthy that cluster 2 highly and specifically expressed the IFN-inducible genes IFN induced protein 44 like (IFI44L), IFI6, and IFN induced transmembrane protein 1 (IFITM1) [Supplementary Figure 3D, E, https://links.lww.com/CM9/B991]. All marker genes of these three clusters are listed in Supplementary Table 1, https://links.lww.com/CM9/B990. Collectively, our data indicate that IFN signaling in this context occurs in NK/T cells in the MM microenvironment.
TEMRA, ISG+ Th cells, and IFN-responding exhausted T cells enriched in the MM microenvironmentTo comprehensively analyze the functional roles of T cells in MM and NBM, we used UMAP to identify T subsets with more detail and obtained 10 clusters [Supplementary Figure 4A, https://links.lww.com/CM9/B991]. The subcluster distribution between NBM and MM is depicted in Supplementary Figure 4B, https://links.lww.com/CM9/B991. Thereafter, we calculated the proportion of each cluster in NBM and MM. Significantly, the cell proportion of clusters 0, 4, 6, 7, 8, and 9 increased in the MM group compared to the NBM group [Supplementary Figure 4C, https://links.lww.com/CM9/B991]. A heatmap of the top five marker genes for each cluster is presented in Supplementary Figure 4D, https://links.lww.com/CM9/B991. All marker genes of the 10 clusters are listed in Supplementary Table 2, https://links.lww.com/CM9/B990. Supplementary Figure 4E, https://links.lww.com/CM9/B991 depicts the representative marker genes from clusters 0, 4, 6, and 9. Based on the marker genes, we defined the function of each cluster, as previously described.[18,19] Cluster 0 consisted of TEMRA cells, which highly expressed granulysin (GNLY), granzyme H (GZMH), natural killer cell granule protein 7 (NKG7), CCL5, granzyme A (GZMA), cystatin F (CST7), fibroblast growth factor binding protein 2 (FGFBP2), and granzyme B (GZMB). Cluster 1 consisted of CCL5+ memory T cells (Tm) or CCL5, which expressed granzyme K (GZMK), GZMA, ID2, CXCR4, ZFP36, CCL4, CD69, and ZFP36L2. Cluster 2 consisted of naïve T (Tn) cells that expressed TPT1 and eukaryotic translation elongation factor 1 beta 2 (EEF1B2). Cluster 3 consisted of Tn cells that expressed IL7R, TPT1, and MAL. Cluster 4 consisted of ISG+ Th cells, which expressed IFI44L, MX1, ISG15, and IFI6. Cluster 5 consisted of Tm cells, which expressed CXCR4, chemokine receptor (CCR7), ZFP36L2, TCF7, EEF1A1, CD69, CD55, and G protein-coupled receptor 183 (GPR183). Cluster 6 consisted of IFN-responding exhausted T cells, which expressed GZMK, GZMA, IFITM1, CCL5, CCL4, GZMB, HLA-DRB1, CD74, interferon regulatory factor 1 (IRF1), interferon alpha inducible protein 27 like 2 (IFI27L2), interferon gamma inducible protein 16 (IFI16), IFITM2, and ISG20. Clusters 7 and 8 consisted of double cells and uncharacterized cells, respectively. Cluster 9 consisted of Tn cells that expressed CCR7, lymphoid enhancer binding factor 1 (LEF1), MAL, actinin alpha 1 (ACTN1), eukaryotic translation elongation factor 1 alpha 1 (EEF1A1), TCF7, Fms related receptor tyrosine kinase 3 ligand (FLT3LG), and lymphotoxin beta (LTB). Thus, overall, TEMRA, ISG+ Th, and IFN-responding exhausted T cells were enriched in the MM microenvironment.
MRC1+ DCs, IFN-responding DCs, and MHCII+ DCs increased in the MM microenvironmentTo delve deeper into the DC cell subtypes and states, we performed additional subclustering at a higher resolution using genes variably expressed among DC cells. This resulted in five subclusters [Supplementary Figure 5A, https://links.lww.com/CM9/B991]. Supplementary Figure 5B, https://links.lww.com/CM9/B991 indicates that clusters 0, 2, and 3 were from patients with MM, while clusters 1 and 4 were from NBM patients. Next, we calculated the cell proportion of distinct DC cell subtypes. Supplementary Figure 5C, https://links.lww.com/CM9/B991 illustrates that, of the five clusters, the proportions of clusters 0, 2, and 3 increased in patients with MM compared with NBM controls. A heatmap of the top 10 marker genes for each cluster is depicted in Supplementary Figure 5D, https://links.lww.com/CM9/B991. All marker genes of these five clusters are listed in Supplementary Table 3, https://links.lww.com/CM9/B990. Based on the differentially expressed marker genes, we defined cluster 0 as MRC1+ DCs, cluster 2 as IFN-responding DCs, and cluster 3 as MHCII+ DCs. Therefore, MRC1+ DCs, IFN-responding DCs, and MHCII+ DCs increased in the MM microenvironment.
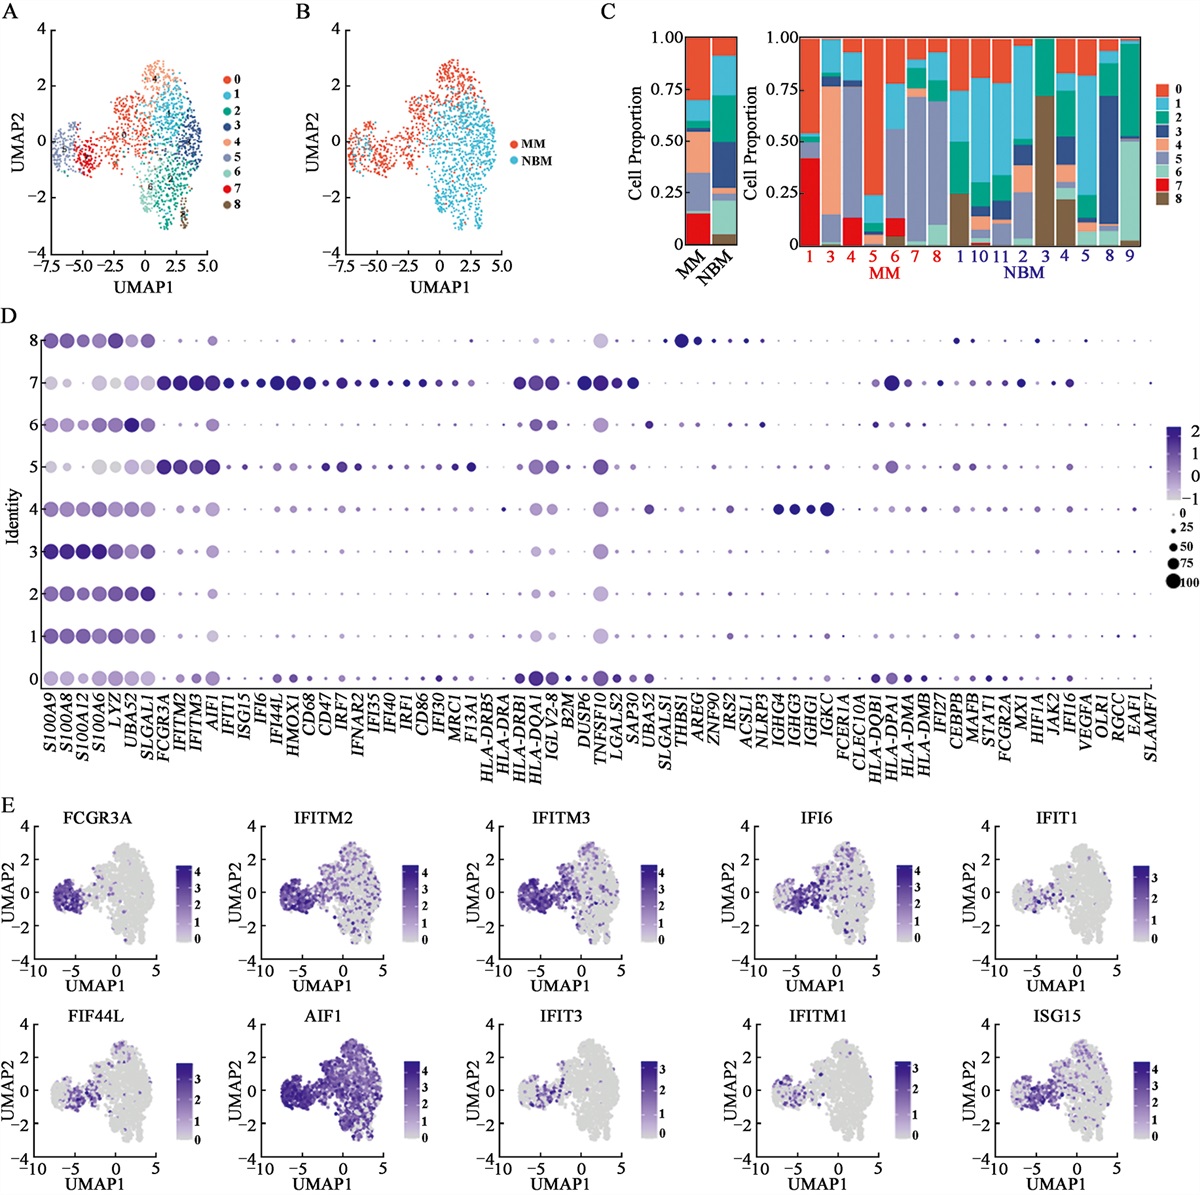
Heterogeneous composition of monocytes/macrophages in the MM microenvironmentTo enhance the understanding of the heterogeneity of monocytes/macrophages in and across patients with MM and HCs, we extracted and clustered this population using UMAP and obtained nine subsets [Figure 1A]. As illustrated in Figure 1A,B, clusters 0, 4, 5, and 7 were defined from MM, while the majority of the cells from other clusters were from NBM. We then calculated the cell proportion of each cluster. It is noteworthy that clusters 0, 4, 5, and 7 increased significantly in patients with MM compared with the NBM controls [Figure 1C]. A feature plot of marker genes for each cluster is presented in Figure 1D. All the marker genes of these 10 clusters are listed in Supplementary Table 4, https://links.lww.com/CM9/B990. Cluster 0 expressed major histocompatibility complex, class II, DR beta 5 (HLA-DRB5), major histocompatibility complex, class II, DR alpha (HLA-DRA), major histocompatibility complex, class II, DR beta 1(HLA-DRB1), major histocompatibility complex, class II, DQ alpha 1(HLA-DQA1), major histocompatibility complex, class II, DP alpha 1(HLA-DPA1), major histocompatibility complex, class II, DQ alpha 1(HLA-DQA1), major histocompatibility complex, class II, DP beta 1(HLA-DPB1), major histocompatibility complex, class II, DQ beta 1(HLA-DQB1), and major histocompatibility complex, class II, DM alpha (HLA-DMA). Cluster 1 expressed S100A9, S100A8, and S100A12. Cluster 2 expressed lysozyme (LYZ) and galectin 1 (LGALS1). Cluster 3 expressed folate receptor gamma (FOLR3), C-X-C motif chemokine ligand 8 (CXCL8), S100A4, and S100A6. Cluster 4 expressed immunoglobulin heavy constant gamma 4 (IGHG4), immunoglobulin heavy constant gamma 3 (IGHG3), immunoglobulin kappa constant (IGKC), hemoglobin subunit alpha 1 (HBA1), hemoglobin subunit beta (HBB), hemoglobin subunit alpha 2 (HBA2), immunoglobulin heavy constant gamma 1 (IGHG1), hemoglobin subunit delta (HBD), and hemoglobin subunit mu (HBM). Cluster 5 uniquely or highly expressed Fc gamma receptor 3A (FCGR3A), IFITM2, IFITM3, allograft inflammatory factor 1 (AIF1), IFITM1, LILRB2, leukocyte immunoglobulin like receptor A1 (LILRA1), LILRA5, IFI30, leukocyte immunoglobulin like receptor B1 (LILRB1), heme oxygenase 1 (HMOX1), CD68, CD47, and CD86. Cluster 6 expressed IL1B and NLR family pyrin domain containing 3 (NLRP3). Cluster 7 expressed FCGR3A, IFIT3, interferon induced protein with tetratricopeptide repeats 1 (IFIT1), IFI44L, IFITM3, ISG15, IFI6, IFITM2, IFITM3, MX1, IRF7, IFI27, IFIT2, ISG20, IFI44, AIF1, and IFI35. Cluster 8 expressed THBS1, Amphiregulin (AREG), and LYZ [Figure 1D]. The representative marker genes for clusters 0, 4, 5, and 7 are presented in Figure 1E. Based on the marker genes, we defined cluster 0 as an MHCII+ monocyte/macrophage subpopulation, and the class II molecules presented epitopes on CD4+ T cells. Cluster 4 consisted of double cells, cluster 5 consisted of FCGR3A+ “don’t eat me” monocytes/macrophages, and cluster 7 consisted of IFN-induced monocytes/macrophages. Overall, our results demonstrated that protumorigenic monocyte/macrophage subsets increase significantly in MM patients.
 Figure 1:
 Clustering and analysis of monocytes/macrophages in MM patients and HC donors. (A) UMAP plots for the monocyte/macrophage type of high-quality single cells from MM patients and HC donors. (B) The UMAP plots of MM and HC. (C) The proportion of each monocyte/macrophage cluster in MM and HC. (D) Dot plot of DEGs in each cluster. (E) The UMAP plot of FCGR3A, IFITM2, IFITM3, IFI6, IFIT1, IFI44L, AIF1, IFIT3, IFITM1, and ISG15 expressions in MM and HCs. DEGs: Differentially expressed genes; HC: Healthy control; MM: Multiple myeloma; UMAP: Uniform Manifold Approximation Projection.
Monocytes/macrophages are key players in treatment-naive MMTo address the cell–cell communication in treatment-naïve MM, we performed cell–cell communication analysis, as previously described. First, we examined the differences in signaling pathways in NBM and treatment-naïve MM. Figure 2A, B demonstrate that both the number of inferred interactions and the interaction strength increased in treatment-naïve MM compared with NBM. Significantly, the interactions between monocytes/macrophages and other cell types presented in this study also increased in treatment-naïve MM [Figure 2C, D]. Thereafter, we analyzed the overall signaling pathways of each cell population in MM and NBM. Figure 2E illustrates that the signaling pathways in treatment-naïve MM included MHC-II, Amyloid beta precursor protein (APP), BAFF, CD45, integrin subunit beta 2 (ITGB2), intercellular adhesion molecule (ICAM), interleukin 16 (IL16), GALECTIN, and chemokine ligand (CCL). The incoming signaling patterns of monocytes/macrophages in treatment-naïve MM included migration inhibitory factor (MIF), GALECTIN, ANNEXIN, APP, CD99, ITGB2, platelet and endothelial cell adhesion molecule 1 (PECAM1), and ICAM [Figure 2F], and the outgoing signaling patterns of monocytes/macrophages in treatment-naïve MM included MHC-I, MIF, GALECTIN, MHC-II, CD99, ANNEXIN, BAFF, CD45, ITGB2, ICAM, and PECAM1 [Figure 2G]. Collectively, our study suggests that monocytes/macrophages may play an important role in treatment-naïve MM.
 Figure 2:
 Cell-cell communication analysis of cells in treatment-naive MM BM (A) The number of inferred interactions between NBM and treatment-naïve MM patients. (B) The interaction strength between NBM and treatment-naïve MM. (C,D) The number of inferred interactions for NBM and treatment-naïve MM. (E) The overall information flow of each signaling pathway between NBM and treatment-naïve MM. (F) The incoming signaling of each cell population between NBM and treatment-naïve MM. (G) The outgoing signaling of each cell population between NBM and treatment-naïve MM. CMP: Common myeloid progenitor; DCs: Dendritic cells; MEP: Megakaryocytic-erythroid progenitors; MM: Multiple myeloma; NBM: Normal bone marrow; NK: Natural killer.
SLAMF7 and CD16 upregulated in monocytes/macrophages in treatment-naïve MM compared with HCsAs 10X Genomic single-cell sequencing lacks sequencing depth, some low- to medium-expressed genes may go undetected. Therefore, we performed bulk RNA sequencing of CD163+ monocytes/macrophages from patients with MM and from the HCs’ BM microenvironment. CD163+ monocytes/macrophages were isolated through magnetic bead sorting of the BM samples from six patients with MM and four HCs before being sent for bulk RNA sequencing to validate the changes observed in the scRNA-seq data. As expected, in the principal component analysis, the CD163+ monocytes/macrophages of MM clustered distinctly differently from the CD163+ monocytes/macrophages of HCs [Figure 3A]. We then performed a pairwise comparison of DEGs. A heatmap of the differential expression of genes is presented in Figure 3B. A total of 478 genes were differentially expressed, of which 209 were upregulated and 269 were downregulated in the CD163+ monocytes/macrophages of MM vs. those of HCs [Figure 3C]. All DEGs are listed in Supplementary Table 5, https://links.lww.com/CM9/B990. A KEGG analysis of the DEGs showed that the upregulated pathways in patients with MM included responses to type I interferon, interferon beta, and interferon alpha [Figure 3D]. In contrast, the downregulated pathways in patients with MM included cell recognition, phagocytosis recognition, and phagocytosis engulfment [Figure 3E]. We next analyzed the expression of Fc receptors, “don’t eat me”-related genes, IFN-induced genes, cytokines, chemokines, and phagocytosis-correlated genes. We found that the expression of the Fc receptors FCGR3A (CD16), FCGR3B, FCGR1A, FCGR1B, and FCGR1C [Figure 3F]; the “don’t eat me”-related genes SLAMF7, LILRB1, and SIGLEC10 [Figure 3G]; the IFN-induced genes IFITM1, IFITM2, IFITM3, IFIT1, interferon induced with helicase C domain 1 (IFIH1), and STAT1 [Figure 3H]; the cytokines Gas6 [Figure 3I]; the chemokines CXCL9 and CXCL10 [Figure 3I]; and the phagocytosis-correlated genes complement C1q A chain (C1QA), complement C1q B chain (C1QB), and C2 [Figure 3J] was significantly increased in patients with MM. Our results suggest that monocytes/macrophages promote the progression of MM through several distinct mechanisms.
 Figure 3:
 Bulk-RNA-seq of CD163+ monocytes/macrophages from MM and HC. (A) Principal component analysis. (B) Heatmap of the DEGs. (C) Volcano of the DEGs. (D) Upregulated pathways in MM monocytes/macrophages. (E) Downregulated pathways in MM monocytes/macrophages. (F) The FPKM value of FCGR3A, FCGR3B, FCGR1A, FCGR1B, and FCGR1C in MM and HC. (G) The FPKM value of SLAMF7, LILRB1, and SIGLEC10 in MM and HC. (H) The FPKM value of IFITM1, IFITM2, IFITM3, IFIT1, IFIH1, and STAT1 in MM and HC. (I) The FPKM value of Gas6, CXCL9, and CXCL10 in MM and HC. (J) The FPKM value of C1QA, C1QB and C2 in MM and HC. CXCL: C-X-C motif chemokine ligand; C1QA: Complement C1q A chain; C1QB: Complement C1q B chain; C2: Complement C2; DEGs: Differentially expressed genes; FCGR1A: Fc gamma receptor Ia; FCGR1B:Fc gamma receptor Ib; FCGR1C: Fc gamma receptor Ic; FCGR3A: Fc gamma receptor IIIa; FCGR3B: Fc gamma receptor IIIb; FPKM: Fragments per kilobase of exon model per million mapped fragments; Gas6: Growth arrest specific 6; HC: Healthy control; IFITM1: Interferon induced transmembrane protein 1; IFITM2: Interferon induced transmembrane protein 2; IFITM3: Interferon induced transmembrane protein 3; IFIT1: Interferon induced protein with tetratricopeptide repeats 1; IFIH1: Interferon induced with helicase C domain 1; LILRB1: Leukocyte immunoglobulin like receptor B1; MM: Multiple myeloma; NBM: Normal BM; SIGLEC10: Sialic acid binding Ig like lectin 10; SLAMF7: SLAM family member 7; STAT1: Signal transducer and activator of transcription 1.
CD16+ monocytes/macrophages increased in treatment-naïve MMChronic inflammation as a risk factor for cancer development is partly driven by CD14+ CD16+ monocyte/macrophages, which exhibit protumorigenic activity in many cancers.[20] Our scRNA-seq and bulk-RNA-seq demonstrated that FCGR3A (CD16) expression was significantly elevated in the monocytes/macrophages of patients with MM. To further validate this finding at the protein level, we performed flow cytometry to check the proportion of BM CD16+ monocytes/macrophages in patients with MM and NBM controls. Figure 4A displays a representative flow cytometry plot of CD14 and CD16 from NBM controls and patients with MM. The quantitative analysis indicated that the proportion of CD14+/CD16+ monocyte/macrophages increased in patients with MM [Figure 4B]. We then observed the morphology of monocyte/macrophages from the NBM controls [Figure 4C] and patients with MM [Figure 4D]. The results indicate that monocytes/macrophages were morphologically different in NBM and MM, which suggests the distinct functions of monocytes/macrophages in NBM and MM.
 Figure 4:
 CD14+CD16+ monocytes/macrophages increased in MM patients compared with HCs. (A) Representative flow cytometry image of CD14 and CD16 expression in MM and HCs. (B) Quantitative analysis of CD14+ CD16+ monocytes/macrophages in MM and HC. (C) Representative cytospin images of HC. (D) Representative cytospin images of MM. The slides were stained with Wright–Giemsa staining. Original magnification ×100. HC: Healthy control; MM: Multiple myeloma; NBM: Normal BM.
DiscussionZavidij et al[8] have demonstrated the dynamic immune changes between NBM healthy donors, precursor stages, monoclonal gammopathy of unknown significance, smoldering MM, and MM with the use of scRNA-seq. It is noteworthy that an increase in NK cells, which is associated with the altered expression of chemokines, often occurs during the early stages. Furthermore, the authors found that CD14+ monocytes with dysregulated MHC class II suppress T cells in vitro. De Mel et al[21] identified a shift in the ratio of T cells to CD14 monocytes from 5.7 at diagnosis to 0.6 at relapse which suggested a major change in the BM immune microenvironment in bortezomib resistant MM. Botta et al[22] have indicated that CD27– T cells are potential MM-reactive T cells and that their abundance in the immune microenvironment of patients newly diagnosed with MM may be prognostic. Recently, Lv et al[23] reported that disordered amino acids and lipid metabolism in immune cells under the microenvironment of MM promote the dysfunction of immune cells and defective immune response in MM with the use of scRNA-seq data from seven healthy donors and 12 newly diagnosed MM patients. Despite these findings, the changes in the immune cell function, especially monocytes/macrophages in the BM microenvironment of treatment-naïve MM patients, still require further in-depth analyses.
Using scRNA-seq data from Zavidij et al,[8] we compared the changes in NK cell subclusters of NBM and MM patients. Our results revealed that only a proportion of cluster 2 was elevated in patients with MM compared with the NBM group. It is noteworthy that cluster 2 highly expressed IFN-responsive genes, which suggests an enhanced IFN response in a subpopulation of NK cells in MM. Previous studies have demonstrated that IFNγ can phosphorylate different phosphorylation sites of signal transducer and activator of transcription 1 (STAT1) signaling in NK cells and exhibit opposite effects. Studies have shown that Tyr701-phosphorylated STAT1 is required for NK cell maturation, which suggests tha
Comments (0)