
Remember me
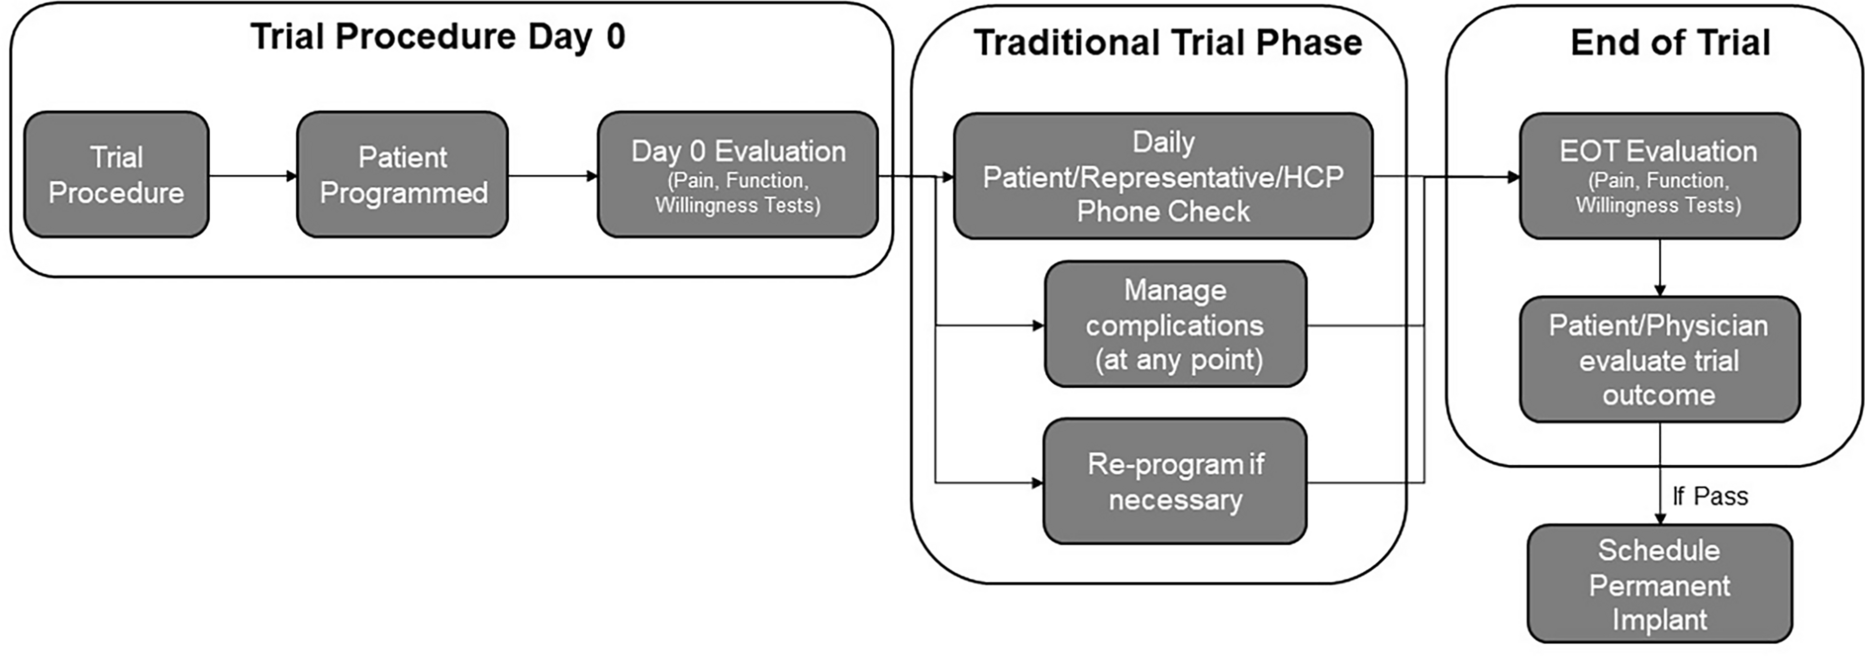

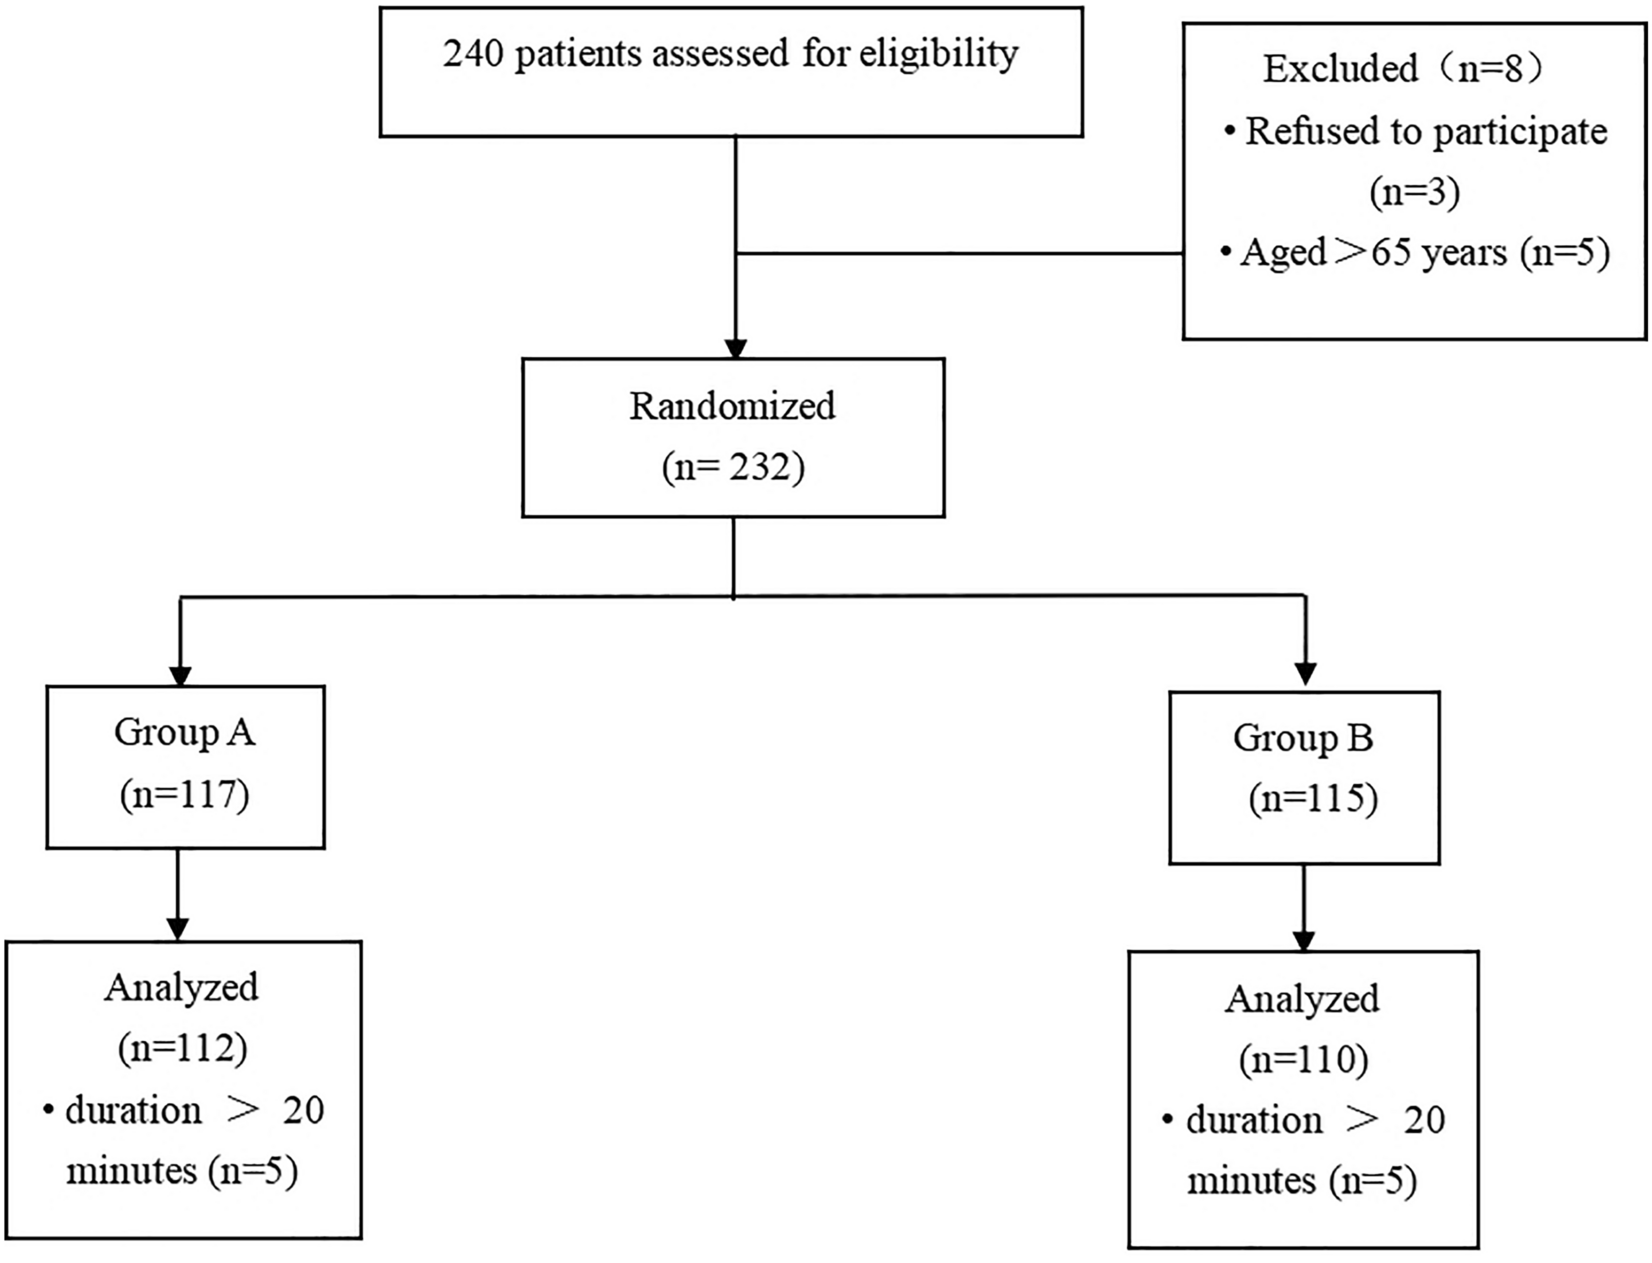
Of 34,192 survey respondents, 1482 patients met the inclusion and exclusion criteria and were included in this cNP study (Fig. 2).
Fig. 2
Inclusion/exclusion flow diagram
The distribution for gender was uniform, with 42.85% males and 57.15% females. The average age (± standard deviation) when injured and when treated with HWDS were 45.96 ± 12.63 and 46.74 ± 12.67 years, respectively. The average duration of pain chronicity and H-Wave® device usage was 285.94 ± 173.93 and 97.67 ± 64.05 days, respectively. These data are summarized in Table 1.
Table 1 Characteristics of H-Wave® device stimulation (HWDS) intervention cohortDevice UsageOf 1482 patients, 1440 reported using the device almost twice daily (1.84 ± 0.04) and 1438 reported using it for almost 5.5 days/week (5.40 ± 1.72). Of 1465 patients, over half (54.68%) used the device for sessions lasting 30–45 min.
Insurance MixThis cNP study cohort involved workers’ compensation (n = 784, 52.90%), personal injury (n = 499, 33.67%), auto-injury (n = 198, 13.36%), and Tricare (n = 1, 0.07%) claimants.
Concomitant Home Exercise ProgramOf 1431 patients, two-thirds (n = 960, 67.09%) reported active involvement in a home exercise program, while the rest (n = 471, 32.91%) did not.
SafetyNo adverse or severe adverse events associated with HWDS use were reported by any study participant throughout the duration of the study.
Primary Outcome MeasuresPain ReductionThe pre-treatment VAS score reported for 1472 patients was 7.47 ± 1.88 [95% confidence interval (CI): 7.37, 7.56), whereas the post-treatment score reported for 1467 was 4.33 ± 2.17 (95% CI: 4.22, 4.44). The difference between the pre-treatment and post-treatment scores reported for 1465 patients was 3.13 ± 1.88 (95% CI: 3.03, 3.23). A difference of 3 or more points in VAS score was found to be statistically significant (p = 0.004) (Fig. 3; Table 2). Approximately 50% (n = 424) of HWDS patients reported their pre-treatment VAS score to be 8 or higher, which dropped to 5 or less post-treatment.
Fig. 3
Pain reduction post-treatment with H-Wave® device stimulation. A difference of 3 or more points was statistically significant (p = 0.004)
Table 2 Analysis of primary and secondary outcome measuresApplying 20% pain reduction as a liberal estimate for minimal clinically important difference (MCID), of 1482 patients, 1283 (86.6%) reported pain relief of at least 20% compared to their baseline (p < 0.0001) (Fig. 4).
Fig. 4
Pain relief of at least 20% post-treatment with H-Wave® device stimulation, which was statistically significant (p < 0.0001)
Function/ADL ImprovementOf 1418 patients (after exclusion of 64 missing survey data), 1364 (96.19%) reported statistically significant improvement (p < 0.0001) in function/ADL after treatment with HWDS (Fig. 5; Table 2).
Fig. 5
Improvement in function/ADL post-treatment with H-Wave® device stimulation, which was statistically significant (p < 0.0001)
Medication Usage DecreaseOf 1128 patients (after exclusion of 354 missing survey data), 738 (65.42%) reported statistically significant (p < 0.0001) decrease or elimination of pain medications usage. Specifically, 621 patients (55.05%) decreased and 117 (10.37%) completely stopped use of pain medications (Fig. 6; Table 2).
Fig. 6
Decrease or elimination in use of pain medications post-treatment with H-Wave® device stimulation. Decreased + eliminated versus no effect was statistically significant (p < 0.0001)
Sleep ImprovementOf 1482 patients, 895 (60.39%) reported statistically significant (p < 0.0001) improvement in their sleep quality (Fig. 7; Table 2).
Fig. 7
Improvement in quality of sleep post-treatment with H-Wave® device stimulation, which was statistically significant (p < 0.0001)
Secondary Outcome MeasuresWork Status and PerformanceOf 1308 patients (after exclusion of 174 missing survey data), almost half (649, 49.62%) were not working when starting HWDS treatment, while 323 (24.69%) were doing modified work and 336 (25.69%) were fully working. Of the 649 patients who were not working, 390 specifically reported their injury to be the reason. Of these 390 off-work patients, 164 (42.05%) reported that HWDS had helped them return to work.
Of the 597 patients (after exclusion of 62 missing survey data) on full or modified duty, 506 (84.76%) reported statistically significant (p < 0.0001) improvement in their work performance after treatment with HWDS (Fig. 8; Table 2). Further subgroup analysis demonstrated that HWDS is more likely to improve work performance in individuals whose pain level was reduced by at least 20% following treatment with HWDS (odds ratio = 5.918; 95% CI 3.108, 11.112).
Fig. 8
Improvement in work performance in patients on full or modified duty post-treatment with H-Wave® device stimulation, which was statistically significant (p < 0.0001)
Prior Treatment and Preference for HWDSOf 1482 patients, almost all (1464, 98.78%) reported use of other treatment modalities prior to starting HWDS (p < 0.0001). Of 1419 patients (after exclusion of 63 missing survey data), 915 (64.48%) reported that HWDS helped them significantly (p < 0.0001) more than prior treatments, whereas 475 (33.47%) reported similar efficacy and only 29 (2.04%) reported less effectiveness (Table 2).
Patient ExpectationsOf 1418 patients (after exclusion of 64 missing survey data), 1359 (95.84%) reported that HWDS use exceeded or met their expectations. Specifically, 503 patients (35.47%) reported exceeded and 856 (60.37%) reported met expectations, being statistically significant (p < 0.0001) compared to those whose expectations were not met (Fig. 9; Table 2).
Fig. 9
Level of patient expectations, where the proportion reporting H-Wave® device stimulation either exceeded or met expectations was statistically significant (p < 0.0001)
Patient Satisfaction with ServiceOf 1432 patients (after exclusion of 50 missing survey data), 1427 (99.65%) reported that service provided by H-Wave® team was excellent or satisfactory. Specifically, 1228 patients (85.75%) reported excellent and 199 (13.90%) reported satisfactory service, being statistically significant (p < 0.0001) compared to those who reported poor service (Fig. 10; Table 2).
Fig. 10
Level of patient satisfaction with service, where the proportion reporting H-Wave® device stimulation instruction to be excellent or satisfactory was statistically significant (p < 0.0001)
Patient Confidence in Device UseOf 1432 patients (after exclusion of 50 missing survey data), 1420 (99.16%) reported their confidence in device usage to be excellent or satisfactory. Specifically, 1097 patients (76.60%) reported excellent and 323 (22.56%) reported satisfactory confidence in device use, being statistically significant (p < 0.0001) compared to those who reported poor confidence (Fig. 11; Table 2).
Fig. 11
Level of patient confidence in device use, where the proportion reporting H-Wave® device stimulation use on their own being excellent or satisfactory was statistically significant (p < 0.0001)
Outcomes Based on Treatment Length PeriodsSurvey patients were further stratified into three subgroups based on number of days they used HWDS, with a “trial period” ranging from 22 to 35 days (3–5 weeks), an “early treatment period” from 36 to 98 days (5–14 weeks), and a “late treatment period” from 99 to 365 days (14–52 weeks). Sample size in the trial period, early treatment period, and late treatment period included 373 (25.46%), 333 (22.73%), and 759 (51.81%) patients, respectively.
Subgroup comparison analysis results were generally consistent without any major deviation, although using the device for longer periods resulted in better outcomes of pain relief, medication elimination, sleep improvement, and work performance (Table 3).
Table 3 Effect of treatment duration on outcome measuresThese observations were confirmed with statistical significance by supplementary multiple regression analyses, where duration of device usage, participation in a home exercise program, and full or modified work are all vital positive variables to consider when evaluating the efficacy of HWDS. Negative variables to consider include longer pain chronicity and older patient age when injured. Specific statistically significant inferences of interest include the following:
Longer device usage results in more pain relief (p < 0.0001).
Pain reduction is better for those working than not working (p = 0.0046).
A higher pain level prior to the treatment is related to more significant pain relief (p < 0.0001).
Longer pain chronicity leads to less pain reduction (p < 0.0001).
Comments (0)