
Remember me


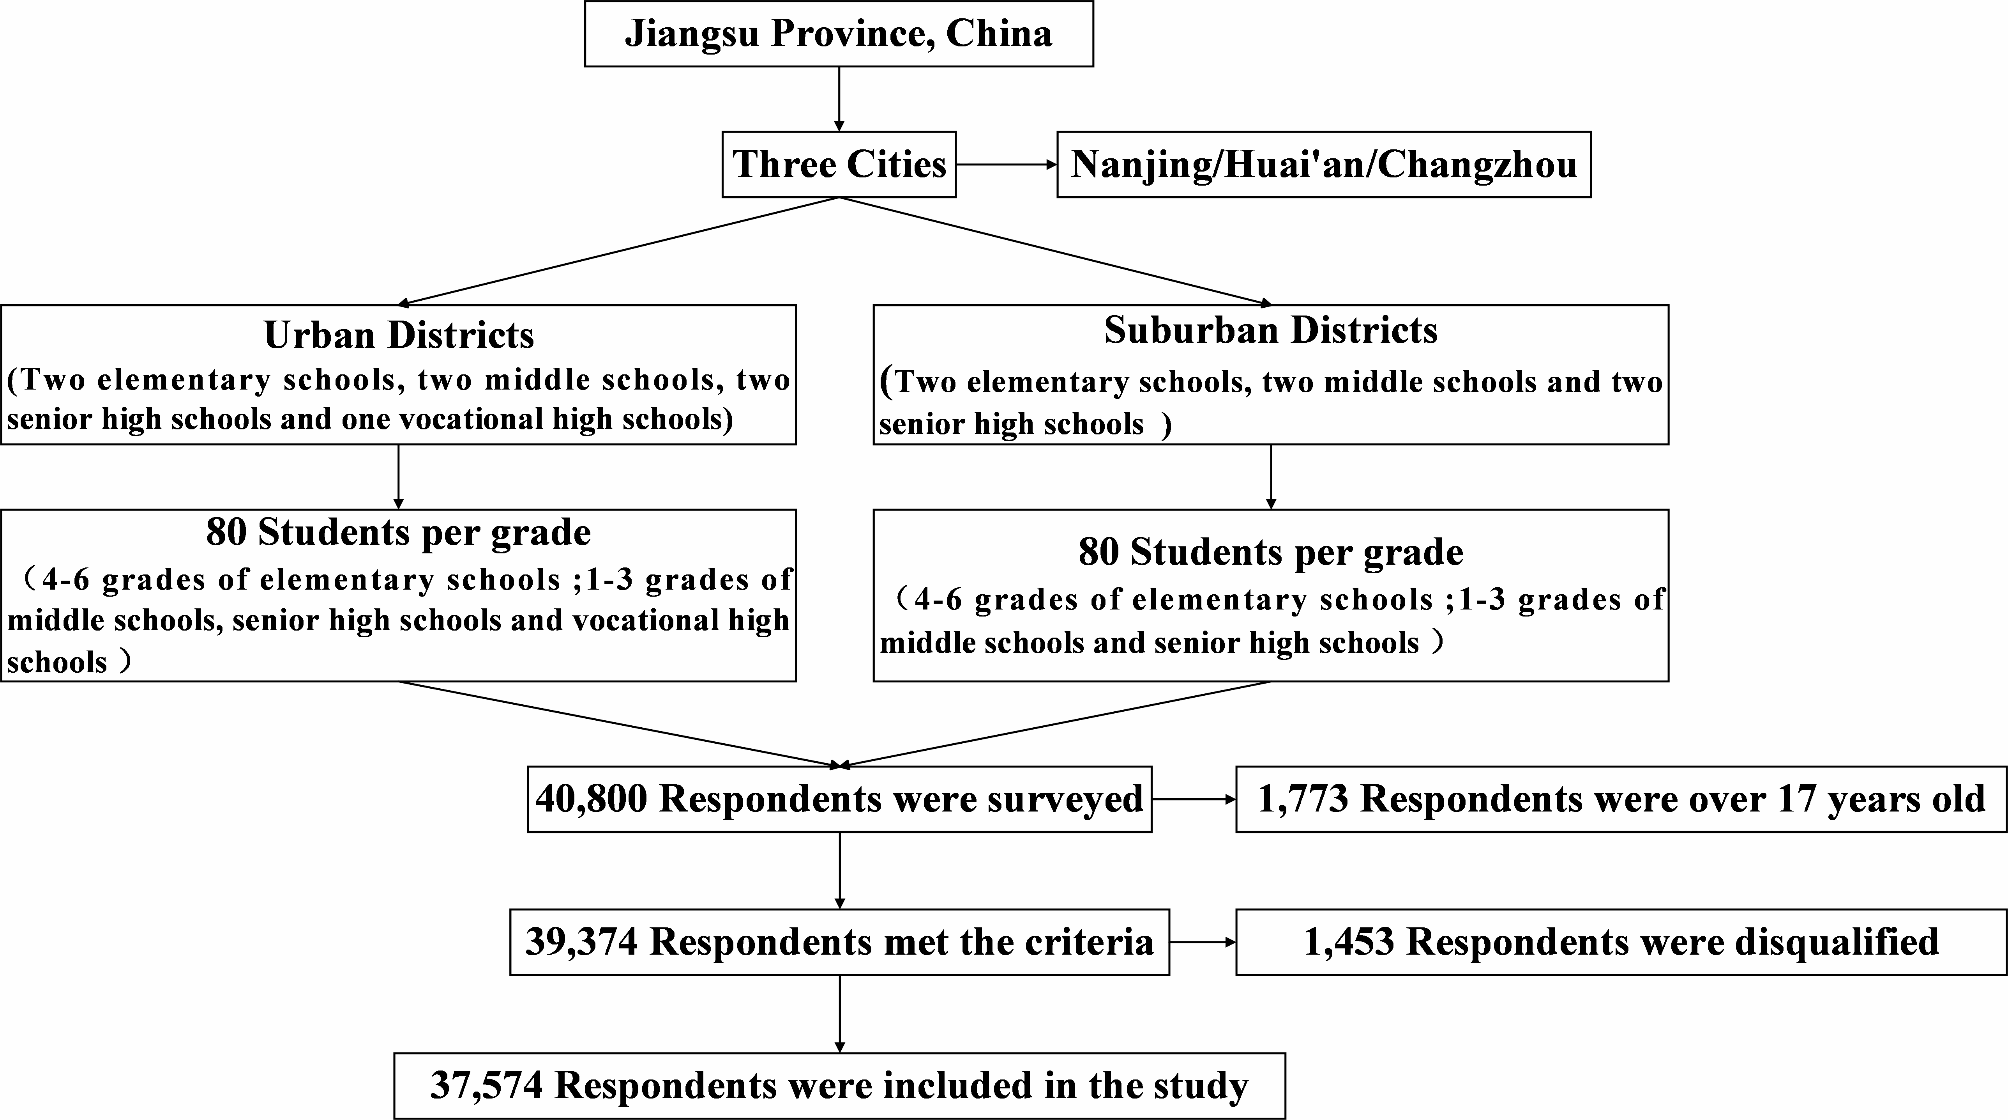
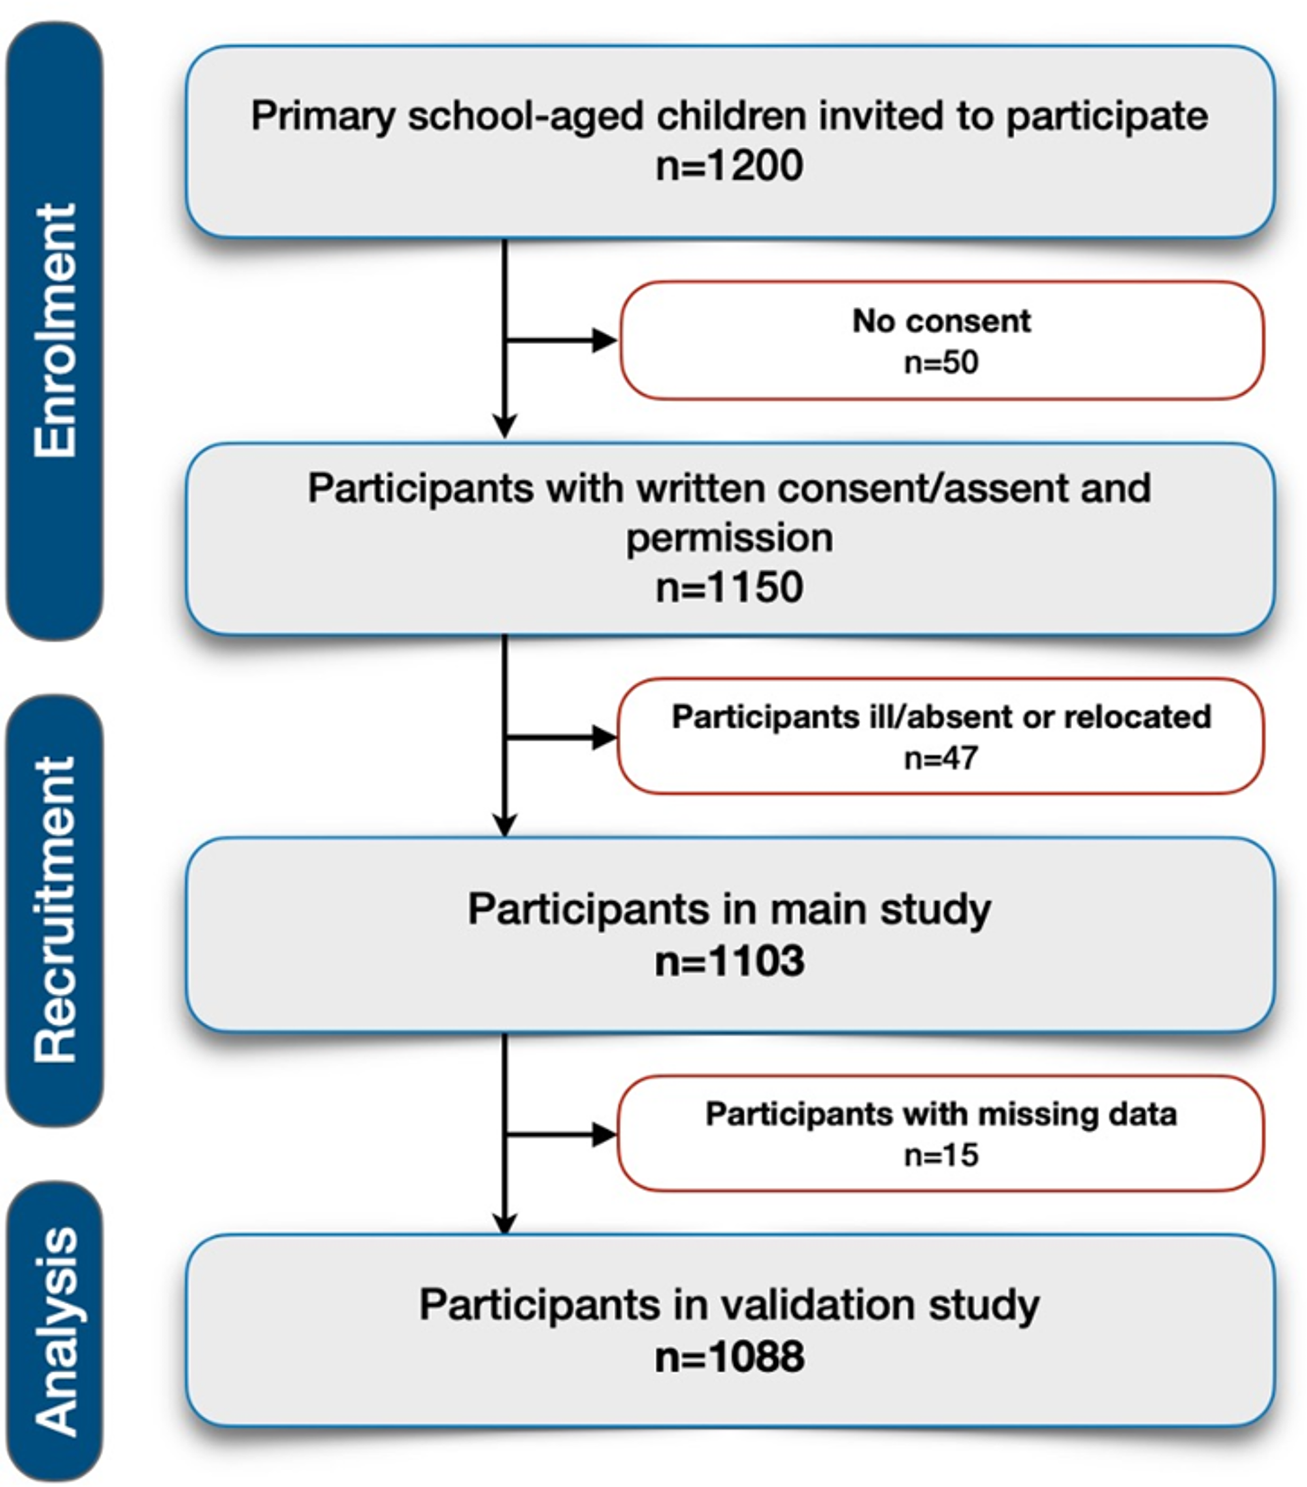
Public primary school-aged (above 5 and under 10 years) boys and girls (n = 1,200) were invited to participate in the study. Participation was voluntarily and almost 96% (n = 1,150) provided written assent or consent along permission from the primary caregivers of the child. At the time of screening, 47 children were ill/absent or had relocated. All the participants in the main study (n = 1,103) were eligible for, and included in, this validation study. However, 15 children had missing data on all the variables reported in this analysis. Therefore, a total of n = 1,088 was included in this validation study (Fig. 1).
Fig. 1
The ExAMIN Youth SA study design and number of included and excluded participants
The characteristics of the participants included in this study are shown in Table 1. There were more females (n = 590) than males (n = 496) included in the final sample. Most of the children were either 7 (n = 364) or 8 (n = 322) years old. The children mainly spoke either Afrikaans (n = 444) or Setswana (n = 390), with isiZulu and languages not specified spoken the least, with only 8 children indicating each. The children were spread across four grades: Grade R – 161; Grade 1–360; Grade 2–366; and Grade 3–102.
Table 1 Characteristics of the participants (n = 1088)Confirmatory and exploratory factor analysisThe KINDLR was used as the starting point for evaluating fit to the data. The results are reported in Table 2. Most of the fit indices did not meet the criteria for acceptable fit; the CFI and TLI values, were low. The reported reliability coefficients of the original factors could not be reproduced in this data set. The Cronbach’s alphas were found to be as follows: Physical well-being: α = 0.60; Emotional well-being: α = 0.54; Self-esteem: α = 0.78; Family: α = 0.49; Friends: α = 0.59; and Everyday Functioning (school): α = 0.46.
Since none of the four models achieved acceptable fit, we conducted an EFA on all items, and in order to obtain as much information as possible, we included the additional items, thus a total number of 46 items. Any variable should preferably contain at least three items, meaning that there might possibly have been up to 15 factors present in the data. To determine the optimal number of possible factors, Eigen-values were used, with values above 1.00 indicating that a certain number of items have enough in common to possibly represent one factor. These values showed that only 11 factors would be viable and an EFA was specified in Mplus 8.6 to extract possible solutions from one to eleven factors.
The resulting possible factor structures were evaluated for theoretical validation and a final possible factor structure was suggested/approved by a team of experts. Only items 29 and 38 were excluded, due to their extremely low loadings on all possible factors. This factor structure was used in a CFA to confirm whether it would fit the data. The final proposed factor structure consisted of seven factors: Positive everyday functioning (items 12, 21, 22, 33, 38, 43); Negative affect (emotional wellbeing; items 6, 7, 8, 15, 16, 20, 25, 28, 31, 34, 36, 39, 44, 45, 46); Physical well-being (items 1, 2, 3, 41); Positive affect (emotional wellbeing; items 4, 5, 13, 14, 26, 29, 30, 32, 37, 40, 42); Self-esteem (items 9, 10, 11); Friends (items 17, 18, 19, 27, 35); and Negative everyday functioning (items 23, 24), summarised in Table 3.
Table 2 Fit statistics of CFAs with original factor structuresTable 3 Summary of the newly developed sub-scales of the KINDLR in a South African contextModel fit indicesThe proposed factor structure was specified in Mplus (Muthén & Muhén, 1998–2022) for estimation in a CFA. As can be seen in Table 4, only the TLI incremental fit index originally did not reach its cut-off value of 0.90. Factor loadings and modification indices were inspected for possible issues. No problems were found with any factor loadings, as they were all above the cut-off value of 0.35. Two modification indices indicated that two sets of items had a lot in common: Items 18 and 19, and items 31 and 45. Their error variances were allowed to correlate, and the final model achieved acceptable fit, without any further items having to be left out.
Correlations and internal consistencyThe final 7-factor structure was used to determine descriptive statistics, reliability, and correlations. These are reported in Table 5. The means of all the factors were quite close to each other, except Factor 6: Friends that had a higher mean, and Factors 1 to 5 had acceptable standard deviations (between − 1.00 and + 1.00), meaning that the participants’ scores on these factors were closely distributed around the mean. Only Factor 7 had a lower mean and a large standard deviation (M = 3.53, SD = 1.19), thus indicating less similarity in their points of view. Both the Cronbach’s alpha and the Omega coefficients of reliability were calculated, as alpha is based on the weights of items being equal, while Omega accounts for different weights items might add to the measurement of a specific factor. Overall, the reliability coefficients were extremely close in their measurement of internal consistency, and good reliability (> 0.70) were indicated for most factors. The only factor that did not display the preferred level of reliability was Factor 7: Negative everyday functioning, with α = 0.68.
Between Factors 1 to 5, all correlations were found to be either significant (p < 0.05) or highly significant (p < 0.01). The relationships with the largest effects were between Factor 4: Positive affect and Factor 5: Self-esteem (r = 0.83), Factor 4: Positive affect and Factor 6: Friends (r = 0.82), and Factor 1: Positive everyday functioning and Factor 4: Positive affect (r = 0.79). Factor 7: Negative everyday functioning was indicated as having the least significant number of relationships with the other factors, specifically with factors 1: Positive everyday functioning (r=-0.02), 4: Positive affect (r=-0.06), and 5: Self-esteem (r=-0.02). Other significant correlations were shown to have only a small effect, with the smallest being between Factor 6: Friends and Factor 7: Everyday negative functioning (r = 0.17), and Factor 1: Positive everyday functioning and Factor 3: Physical well-being (r = 0.17).
Table 4 Fit statistics of CFA: proposed factor structure and final factor structureTable 5 Descriptive statistics, reliability coefficients, and correlations
Comments (0)