
Remember me


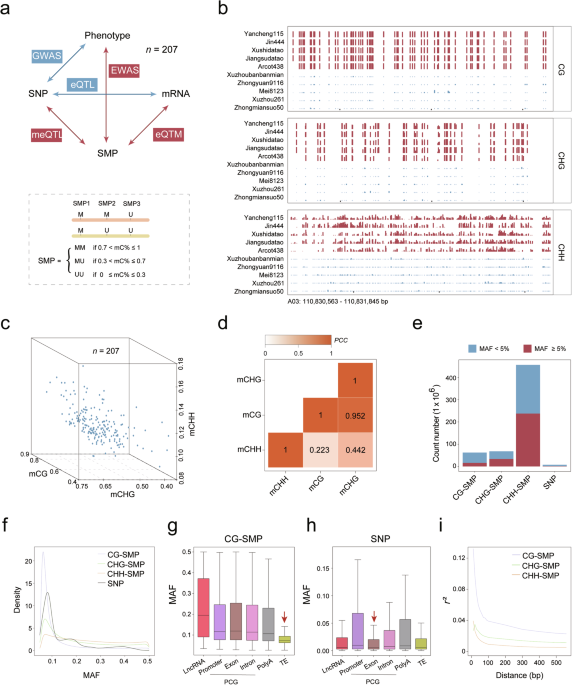
A core germplasm upland cotton population (CUCP1)1,33 with 207 accessions was employed for this multi-omics integrative study (Fig. 1a). All plants were grown in Hangzhou, China in 2021, and 20-DPA fibers at the secondary cell wall (SCW) thickening stage were harvested for whole-genome bisulfite sequencing (WGBS), and transcriptome sequencing (RNA-seq) in parallel. Samples for high-quality genome, methylome, and transcriptome analyses were obtained for all accessions. WGBS and RNA-seq generated 54 billion and 4.42 billion clean reads, respectively, for a total of 17.76 trillion base pairs (Supplementary information, Fig. S1a, b and Tables S1, S2). Methylome reads were mapped against the upland cotton reference genome TM-1 version2.1 (v2.1),34 achieving an average mapping rate of 74.90% ± 3.55%. All sequenced methylomes had an average coverage depth exceeding 15 folds (Supplementary information, Table S1). After strict data processing and quality control, 62.32 million (M), 66.06 M, and 433.01 M methylated cytosines were quantified in CG, CHG, and CHH contexts, respectively (Supplementary information, Fig. S1c‒e and Table S1). The RNA-seq profiling was conducted using two biological replications for each accession. The Pearson correlation coefficients (PCCs) of paired biological replicate transcriptomes were significantly higher than those of randomly selected samples (Wilcox test, P < 2.2 × 10‒16), confirming the high quality of our data (Supplementary information, Fig. S1f). In parallel, 3.05 trillion-base pair whole-genome sequencing (WGS) of the accessions generated 1,282,390 biallelic high-quality SNPs (minor allele frequency (MAF) > 0.05 and missing ratio < 20%), which were used for expression quantitative trait loci (eQTL) and expression quantitative trait methylation (eQTM) mapping (Fig. 1a). The collected datasets provide a comprehensive study of accession-specific gene expression and DNA methylation status in upland cotton, enabling an investigation into the influence of DNA methylation on agronomic traits.
Fig. 1: Extensive variation pattern of DNA methylation in a natural population.
a Workflow of the multiple-omics association. The bottom panel refers to the definition of SMP. b An example of genomic regions exhibiting DNA methylation diversity among different accessions. Each track represents a distinct accession. c 3D plot illustrating the diversity of DNA methylation among different accessions. d The correlation among three different DNA methylation contexts. e Bar plot demonstrating the number and portion of SMP with MAF greater than 0.5. f Density plot showing MAF distributions for CG, CHG, CHH-SMPs and SNPs. g, h Box plots showing the distribution of MAFs of SMP (g) and SNP (h) for CG sites across different genomic features. i Comparison of LD decay among different DNA methylation contexts (vertical axis: LD level; horizontal axis: pairwise distance).
Methylome data generated from the 207 accessions showed that the cotton genome is highly methylated, especially in heterochromatin regions (Supplementary information, Fig. S2). The genome-wide DNA methylation was about 72%, 55%, and 11% in contexts of CG, CHG, and CHH sites, respectively (Supplementary information, Table S1). The CG methylation ratio in our study is consistent with previous estimates in cotton,14 higher than that in orange fruit (CG: 41%),18 while lower than that in barley (CG: 94.7%).35 The 207 accessions also exhibited genome-wide variation in cytosine methylation (CG-interquartile range (IQR) = 8.08%; CHG-IQR = 6.75%, and CHH-IQR = 1.37%) (Fig. 1b, c). Genome-wide CG DNA methylation exhibited a strong correlation with CHG DNA methylation levels (PCC = 0.95, P < 2.2 × 10‒16), while a low correlation with CHH DNA methylation levels (PCC = 0.22, P = 0.0012) (Fig. 1d). Within each accession, the genome-wide distribution of DNA methylation followed a binomial distribution (Supplementary information, Fig. S3), reflecting that each site is either completely methylated or unmethylated. This characteristic justifies the conversion of methylation levels (%) at each cytosine to binary values to represent methylation variation, the feasibility of which has been validated in a previous human study.36 Therefore, the definition of a single methylation polymorphism (SMP) was adopted as the DNA methylation variation on each allele of homologous chromosomes at a specific cytosine location. Three epi-alleles can be identified for an SMP: both methylated (MM allele, 70% < mC% ≤ 100%), both unmethylated (UU allele, 0 ≤ mC% ≤ 30%), and heterozygosis (MU allele, 30% < mC% ≤ 70%) (Fig. 1a).
Phylogenetic analysis based on SMPs grouped the 207 accessions into four clades (Supplementary information, Fig. S4). Clade II included American landraces Stoneville 2B (STV2B) and 86-1, and modern cultivars developed from STV2B collected from the Chinese Yellow River cotton-growing area. Clade III contained American landrace Deltapine 15 (DPL15), and cultivars developed primarily from DPL15 planted in all three cotton-growing areas of China (Supplementary information, Fig. S4).
The number of common SMPs (MAF ≥ 0.05, 16.15 M for CG, 33.41 M for CHG, and 237.74 M for CHH) in the cotton genome is much larger than the number of SNPs (1.28 M) (Fig. 1e). The MAF of CHH-SMPs is 0.22, larger than the values obtained for CHG-SMPs (MAF = 0.11), CG-SMPs (MAF = 0.05) and SNPs (MAF = 0.14) (Fig. 1f).
MAF values of SMPs vary across different genomic features (Fig. 1g; Supplementary information, Fig. S5a and Table S3). The CG-SMP MAF value of TEs is half of that of protein-coding genes (PCGs) that include exons and promoters (Fig. 1g), while the MAF value of SNPs was similar among TEs and PCGs (Fig. 1h). In the cotton genome, many repetitive sequences are located in exon regions. CG-SMPs located within exons can be classified as either TEs or non-TEs. The MAF of CG-SMPs located within TEs was significantly lower than those not in repetitive sequences (Wilcox test, P = 6.8 × 10‒4) (Supplementary information, Fig. S5b). It was interesting to note that the CG-SMP MAF was significantly lower in TEs, although TEs are usually highly methylated. Notably, common CG-SMPs (MAF ≥ 0.05) were three times more enriched in intragenic regions compared to other SMP types (CG-SMP: 27.53%, CHG-SMP: 9.78%, and CHH-SMP: 10.49%) (Supplementary information, Fig. S5c). This result is consistent with a previous report in Arabidopsis, demonstrating that varied genic methylation tends to occur in the CG context within the transcribed region.37
To characterize the relationships between adjacent DNA methylation loci,38 the concept of linkage disequilibrium (LD) was applied to DNA methylation, henceforth termed methylation disequilibrium (MD). The average distance at which MD decayed to half of its maximum value was about 50 bp (Fig. 1i), consistent with previous estimations in humans and Arabidopsis.22,36 Notably, the decay of MD was significantly faster than LD (Supplementary information, Fig. S5d), which was reported to span over 300 kb in the same population.1 In addition, the MD of CHH was lower than those of CHG and CG (Fig. 1i), suggesting that methylation at the symmetrical CG and CHG sequences might be preferentially maintained across mitotic and meiotic cell divisions.39 Thus, DNA methylation is an important source of variation in intragenic regions.
Genetic variations in gene-enriched regions have major impacts on the methylomeTo characterize the genetic impacts on DNA methylation, we mapped the genetic variants that affect DNA methylation. First, a genome-wide random sampling of 50,000 CG-SMPs, CHG-SMPs, and CHH-SMPs, accounting for 0.31%, 0.15%, and 0.021% of each SMP type, respectively, was selected to reassess meQTL in both cis- and trans-effects, in parallel. We define meQTL as cis-meQTL if the distance between the SNP and the associated SMP is within 1 Mb. 119,685, 37,831, and 24,683 meQTLs were identified in CG, CHG, and CHH contexts, respectively. Although a large number of trans-meQTLs were identified through the meQTL analysis (Fig. 2a), cis-meQTLs exhibited greater levels of significance compared to trans-meQTLs (Fig. 2b).
Fig. 2: The genetic basis of three contexts of DNA methylation.
a The genomic distribution of SMP and their associated SNPs. The x-axis indicates the genomic positions of the significant SNPs, while the y-axis shows the genomic positions of the corresponding SMPs. 50,000 SMPs of CG, CHG and CHH were chosen for genome-wide meQTL analysis. b Box plot showing the distribution of ‒log10(P) of cis- and trans-meQTL. Boxes show the medians and IQRs. c UpsetR plots illustrating the proportions of shared cis-meQTLs among different DNA methylation contexts (Fisher’s exact test, ***P < 0.001). d The distance between DMR and the significant SNP. e The genomic distribution of cis-meQTL across the genome. f Enrichment and depletion of cis-meQTLs across different genomic features.
To minimize false positives and reduce the computational burden, only cis-meQTLs were chosen for further analysis. In parallel, all SMPs (n = 287.30 M) were subjected to cis-meQTL analysis via the software fastQTL.40 In total, 5,426,782 cis-meQTLs were identified including 940,794 CG-cis-meQTLs, 883,280 CHG-cis-meQTLs, and 3,602,708 CHH-cis-meQTLs. Only a small proportion of DNA methylation loci (5.82%, 2.64%, and 1.52% of CG, CHG, and CHH sites, respectively) were found to be involved in cis-meQTLs. A proportion of cis-meQTLs of three DNA methylation contexts (CG, CHG, and CHH) showed co-localization (Fig. 2c). Additionally, the distance between the SNP and its associated SMP of CG-cis-meQTLs exhibited shorter spans in comparison to those observed in the CHG and CHH contexts (Fig. 2d).
The distribution of cis-meQTL is uneven across the genome, showing a higher density near the chromosome ends (Fig. 2e; Supplementary information, Fig. S6). To assess the pattern of cis-meQTL enrichment in different genomic features, we explored distribution bias using Fisher’s exact test, comparing the observed frequency with the expected frequency. The results showed that cis-meQTLs were significantly enriched in intragenic regions (Fisher’s exact test, P < 2.2 × 10‒16), but significantly depleted in TEs (Fisher’s exact test, P < 2.2 × 10‒16) (Fig. 2f).
The involvement of SMPs in expression regulationGiven that cis-meQTLs are enriched in PCGs across natural populations (Fig. 2e, f), exploring the relationship between DNA methylation and gene expression holds significance. Thus, we investigated the impact of DNA methylation on local gene expression through eQTM analysis using transcriptomes from the same harvested tissues (Fig. 3a; Supplementary information, Table S2). The population-wide transcriptome analysis was performed against the reference genome of TM-1 v2.0 annotated with 71,994 PCGs.34 In total, 21,181 long noncoding RNAs (lncRNAs) were annotated in this study. 41,632 PCGs and 5469 lncRNAs expressed in more than 5% of the population were retrieved for determining eQTL and eQTM. A total of 5078 cis-eQTMs were identified via fastQTL software,40 consisting of 3505 PCG-eQTMs and 1573 lncRNA-eQTMs (Fig. 3b). They were mapped to 2619 genes, representing 5.69% of the PCGs and 29% of the lncRNAs expressed in 20-DPA fiber (Fig. 3c; Supplementary information, Table S4). The cis-eQTMs genes showed enrichment in processes including long-chain fatty acid metabolism, trichome branching, and glucose homeostasis, likely related to fiber development by Gene Ontology (GO) analysis (Supplementary information, Table S5). In addition, it is common to observe simultaneous association of cis-eQTMs genes among different methylation contexts (Fig. 3d). For example, cis-eQTMs genes associated with all three methylation contexts account for a large portion of all cis-eQTMs genes (30.85% for PCGs and 60.24% for lncRNAs) (Fig. 3d). The analysis revealed that the majority of eQTM genes were associated with CG methylation, comprising 91% and 96% of eQTM PCGs and lncRNAs, respectively (Fig. 3d). This indicates that CG methylation plays a more crucial role in gene regulation compared to the other two types of methylation. At the population level, 90% of cis-eQTMs were biased to positions upstream of PCGs and lncRNAs (Fig. 3e). Furthermore, we observed that methylation levels of CG-eQTMs and CHG-eQTM located in the proximal promoter were negatively correlated with gene expression compared to eQTMs located in distal gene regions and gene bodies (Supplementary information, Fig. S7).
Fig. 3: Gene expression variations influenced by DNA methylation.
a Workflow of the eQTL analysis. b Number of cis-eQTMs identified in PCGs and lncRNAs. c Percentage of PCGs and lncRNAs influenced by DNA methylation. d UpsetR plots of overlapping and specific cis-eQTM genes. Right: PCGs; left: lncRNAs. Cis-eQTMs related to CG are labeled in red; others are painted in blue. e Distance of lead SMPs to the associated transcription start site. Left: PCGs; right: lncRNAs. f Scatter plot of high-confidence eSNP-expression associations. Each dot represents a detected eQTL. Expression of eGenes is plotted on the y-axis and eSNPs on the x-axis. g Pie plot showing the number of cis- and trans-eQTLs. h Characterization of eQTM genes identified in both eQTM and meQTL analyses. These loci were categorized into three groups. Genetic & cis-epigenetic regulated (type I), genetic & trans-epigenetic regulated (type II) and epigenetic regulated only (type III).
eQTL mapping was subsequently performed by Efficient Mixed Model Analysis Expedited (EMMAX) using the obtained SNPs and expression profiles. A total of 9157 eQTLs were detected, involving 5921 eSNPs and 7398 eGenes (PCG, n = 5197; lncRNA, n = 1014) (Fig. 3f; Supplementary information, Table S6). They were further subdivided into 926 cis-eQTLs and 8231 trans-eQTLs according to relative eGene (genes regulated by eQTL) location using an empirical distance threshold (1 Mb) (Fig. 3g).41,42 A set of 67 genes encoding critical proteins in DNA methylation establishment were further investigated, from which we identified cis-eQTL and cis-eQTM for De Novo 2 (IDN2), a gene involved in RNA-directed DNA methylation (Supplementary information, Fig. S8a and Table S7).
We adopted a strategy similar to that of Meng et al.,43 to cluster the patterns of genomic regulation for eQTM genes into three categories (Fig. 3h), genetic/cis-epigenetic regulated (type I), genetic/trans-epigenetic regulated (type II), and epigenetic regulated only (type III). Regarding the SMP of eQTM, we carried out meQTL analysis. The eQTM genes from type II constituted a small portion (less than 20%) of the total eQTM genes (Fig. 3h). The eQTM genes characterized as type III account for 33.63%‒38.14% of the share (Fig. 3h), indicating an active role of DNA methylation involved in gene expression regulation. The co-regulated genes showed enrichment in organonitrogen compound biosynthetic process (Fisher’s exact test, P = 3.6 × 10‒8), sulfur compound biosynthetic process (Fisher’s exact test, P = 5.29 × 10‒7), and acetyl-CoA biosynthetic process (Fisher’s exact test, P = 1.62 × 10‒4) (Supplementary information, Fig. S8a‒c).
Epigenome-wide association studies for agronomic traits revealed a large number of elite epi-allelesOur cis-meQTL analysis revealed that the majority of SMPs were not associated with genetic variations, consistent with a previous study reporting that DNA methylation variation in Arabidopsis occurs independently of genetic variation.22 This suggests that epigenetic associations may not be captured by SNP-based markers. Using common SMPs (MAF ≥ 0.05) across the genome, instead of SNPs, we performed an epigenome-wide association study (EWAS) for nine traits using EMMAX software,44 which yielded 848 CG-EWAS loci (P = 6.52 × 10‒8), 467 CHG-EWAS loci (P = 3.09 × 10‒8), and 400 CHH-EWAS loci (P = 4.42 × 10‒9) (1715 in total) (Fig. 4a; Supplementary information, Table S8). Of these loci, 1010 were associated with yield-related traits, and 705 with fiber qualities (Supplementary information, Fig. S9a, b). When considering different contexts, the majority of EWAS loci were independent of each other, except for the 22 loci shared by at least two sequence contexts (Fig. 4b).
Fig. 4: EWAS locus distribution and accumulative effects on agronomic traits.
a Distribution of EWAS loci associated with agronomic traits. Fiber yield traits included lint percentage (LP); fiber quality: fiber length (FL), strength (FS), elongation (FE), micronaire (FM), and uniformity (FU). The loci associated with each were indicated by black vertical lines in the chromosome map. b UpsetR plot illustrating the overlap between CG-EWAS, CHG-EWAS, and CHH-EWAS. c Proportions of EWAS loci having a flanking gene within less than 2-kb and 5-kb regions. d Manhattan plot for the LP trait from EWAS analysis. The red arrow indicates the signal in Chr. A11. e Zoomed-in plot showing that the lead SMP represents the EWAS locus for LP on Chr. A11 and the signal coordinates are in the same methylation disequilibrium block. f LP of different epi-alleles for the locus shown in e (Student’s t-test, ***P < 0.001). g Heatmap showing haplotype distribution in the natural population according to CG-, CHG-, and CHH-EWAS loci, and also GWAS loci. Elite alleles are indicated in red. Each column represents an accession, and each row refers to a locus in the genome. h Characterization of loci identified in both EWAS and GWAS. These loci were categorized into four groups. Epigenetic regulated only (type I), genetic regulated only (type II), genetic/cis-epigenetic regulated (type III), and genetic/trans-epigenetic regulated (type IV).
Approximately 27.67% of CG-EWAS loci, 19.92% of CHG-EWAS loci, and 16.19% of CHH-EWAS loci were located within a 2-kb flanking region of a protein-coding or lncRNA gene (Fig. 4c). Figure 4d and e present an example of an EWAS signal associated with the yield trait (lint percentage, LP) that occurred in the promoter of a gene encoding a nucleoporin interacting component (Nup93). Further, different epi-alleles corresponded to varying LP values (Two-tail unpaired Student’s t-test, P < 2.2 × 10‒16) (Fig. 4f).
To analyze the relationship between the genetic and epigenetic variance in trait variation, we constructed a map that combines EWAS loci with GWAS loci across all 207 accessions (Fig. 4g). GWAS identified 187 loci associated with nine traits related to fiber quality and yield.1 EWAS further identified a total of 1715 trait-associated epigenetic loci, of which only 16 (0.93%) were located near GWAS loci (< 20 kb) (Supplementary information, Table S8). For example, the epi-allele of the EWAS locus on chromosome A11 was significantly associated with LP, but no GWAS signal was detected at that locus (Supplementary information, Fig. S9c). Representative examples of EWAS loci that overlap with GWAS loci are shown in Supplementary information, Fig. S9d, e. In sum, these results illustrate that DNA methylation provides an additional layer of regulation to agronomic traits. Further, in our analysis of the EWAS loci that did not coincide with GWAS loci, we identified 992 loci with trans-meQTL effects, out of which 20 were associated with GWAS loci (Fig. 4h; Supplementary information, Table S8).
To assess the pyramiding effects of elite epi-alleles of EWAS loci for each trait of interest in the Gossypium hirsutum (G. hirsutum) germplasm, we compared traits among accessions carrying multiple elite epi-allelic combinations. The result revealed that accessions with more elite alleles consistently exhibit better trait performance (Supplementary information, Fig. S10). Since SNPs and SMPs represent different types of molecular information potentially associated with the phenotypes, utilizing a combination of SNPs and SMPs, we can improve the predictive performance for agronomic traits related to fiber yield and quality (Supplementary information, Fig. S11).
Identification of fiber-related genes through multi-omics association analysisOur multi-omics association analyses yielded 187 GWAS loci, 9157 eQTLs, 1715 EWAS loci, 5078 cis-eQTMs, and 5,426,782 cis-meQTLs. To examine the gene regulatory network (GRN) that complements the GWAS/EWAS loci, we constructed the GRN of gene expression by integrating the GWAS loci and eQTLs based on LD blocks (Fig. 5a).
Fig. 5: Genetic and epigenetic regulation networks associated with fiber development.
a Analytical workflow for the construction of a functional GRN. Both eQTM and eQTL analyses were conducted to obtain causal sites in EWAS and GWAS loci, respectively. Loci within the same LD block (r2 > 0.1) were merged into one lead SNP, and eGenes within an LD block were clustered into a GRN. The same steps were also conducted for EWAS loci. b Gene networks regulating cotton fiber traits. Right: genetic variation-dependent network constructed by integrating GWAS and eQTL; left: epigenetic regulation network constructed by integrating EWAS and eQTM. c Heatmap showing candidate genes identified by colocation analysis. d Expression levels and LP of CIPK10 across different epi-alleles. e Image illustrating the performance of gene editing (CRISPR knockout, CR-KO) on the eQTM gene GhCIPK10, which regulates fiber traits. f Fiber length in two CIPK10CR-KO lines (Student’s t-test, **P < 0.01, n = 6).
51 GWAS loci were found to co-localize with 376 eQTLs within the same LD block (r2 > 0.1). The corresponding GRN for six fiber traits comprised 634 connections among 397 genes. Within this GRN, 77 (19.40%) eQTL genes were also eQTM genes, indicating co-regulation of gene expression by DNA methylation and genetic variation. Networks associated with four fiber traits (fiber yield (LP), strength (FS), length (FL), and micronaire (FM)) were depicted in Fig. 5b, including multiple genes known to be involved in fiber elongation, such as genes encoding Expansion A4,45 cellulose-synthase-like (CSL),46 ACTIN1,47 TCP transcription factors,48 bHLH transcription factors, and uridine diphosphate (UDP)-glucose.
An epigenetic regulation network, referred to as the epigenetic GRN, was established by integrating EWAS loci and eQTMs (Fig. 5a). In addition, an alternative epigenetic GRN was constructed using 47 eQTMs that co-localized with EWAS loci (Fig. 5b; Supplementary information, Table S9). A comparison between these two networks revealed only four genes in common, encoding trypsin protein and RIBOSOMAL PROTEIN EL8Y, GH_A06G1022, and aldehyde dehydrogenase (Fig. 5c; Supplementary information, Table S9). The minimal overlap between the two networks demonstrated the complex regulatory mechanisms governing fiber traits.
An EWAS locus (A03:4217197) associated with LP was located in the promotor of CIPK10 that encodes a CBL-interacting protein kinase (Supplementary information, Table S8), which is a candidate fiber development gene in a Gossypium barbadense population.2 We also identified it as an eQTM gene, with DNA methylation status at a CG-SMP (A03:4217260) associated with both CIPK10 expression (Student’s t-test, P = 2.5 × 10‒4) and LP (Student’s t-test, P = 2.5 × 10‒4) (Fig. 5d). Knocking out CIPK10 through CRISPR/Cas9 gene editing system49 (Supplementary information, Fig. S12) resulted in shorter FL (CIPK10 CRKO-1, 25.0 ± 0.8 mm; CIPK10 CRKO-2, 24.22 ± 0.5 mm) compared to wild type (31.00 ± 0.4 mm) (Student’s t-test, CIPK10 CRKO-1, P = 3.72 × 10‒4; CIPK10 CRKO-2, P = 5.06 × 10‒5) (Fig. 5e, f).
Prediction of functional CG methylation based on DNA sequence using DeepFDMLDeciphering the functional impacts of regulatory elements poses a crucial challenge in functional genomic studies for advancing next-generation crop breeding strategies. Deep learning models have been applied to uncover functional patterns in genetic elements by integrating genomic sequences with molecular features such as non-coding region transcription50 and cis-elements within promoters.51 However, such an approach for predicting functional epi-modification loci has not yet been developed.
Here, we developed a deep learning model named Deep Functional DNA Methylation Loci (DeepFDML) to predict functional SMPs, which are SMPs associated with variations in gene expression. The DeepFDML model was trained on genomic sequences corresponding to functional CG sites, namely the 2336 non-redundant CG loci associated with 2423 CG-eQTMs (i.e., positive samples). To ensure the balance of training data, another set of 2336 CG-SMPs was randomly selected as the negative group. The flanking sequences of each CG-SMP locus were transformed via one-hot encoding (Fig. 6a).
Fig. 6: A convolutional neural network for functional CG site prediction.
a Schematic diagram showing the pipeline of the proposed deep learning method. It mainly contains four components: input sequence, backbone, feature selection, and output layer. Each input was a one-hot-encoded DNA sequence of 8192 bp centered at the CG site. The backbone was from the pre-trained Enformer model. In feature selection, features of the middle eight positions were utilized. The output layer, a fully connected layer, was a binary classifier. b Receiver operating characteristic (ROC), curve measured on the whole dataset. c Precision-recall curve, measured on the whole dataset.
To evaluate the impact of DNA methylation on gene expression, we first built a convolutional model consisting of a convolutional layer (kernel size of 11 and channel of 128) and a fully connected layer (Fig. 6a). The models were evaluated using a five-fold cross-validation approach, and the accuracy of our model reached 0.65 in both receiver operating characteristic curve (ROC) and the precision-recall curve (PRC) (Fig. 6b). Subsequently, a more complex DeepFDML model was constructed to improve the accuracy, adopting an architecture similar to the pre-trained Enformer model as its backbone.52 This advanced DeepFDML model contains a convolution part of seven convolution-pool blocks and a transformer part with 11 transformer encoding layers (Fig. 6a). The model achieved an ROC of 0.82 and an PRC of 0.78, significantly surpassing the performance of the convolutional model (Fig. 6b, c). Based on these results, we conclude that functional SMPs can be identified based on DNA sequence patterns through predictive models using deep learning approaches.
Comments (0)