
Remember me
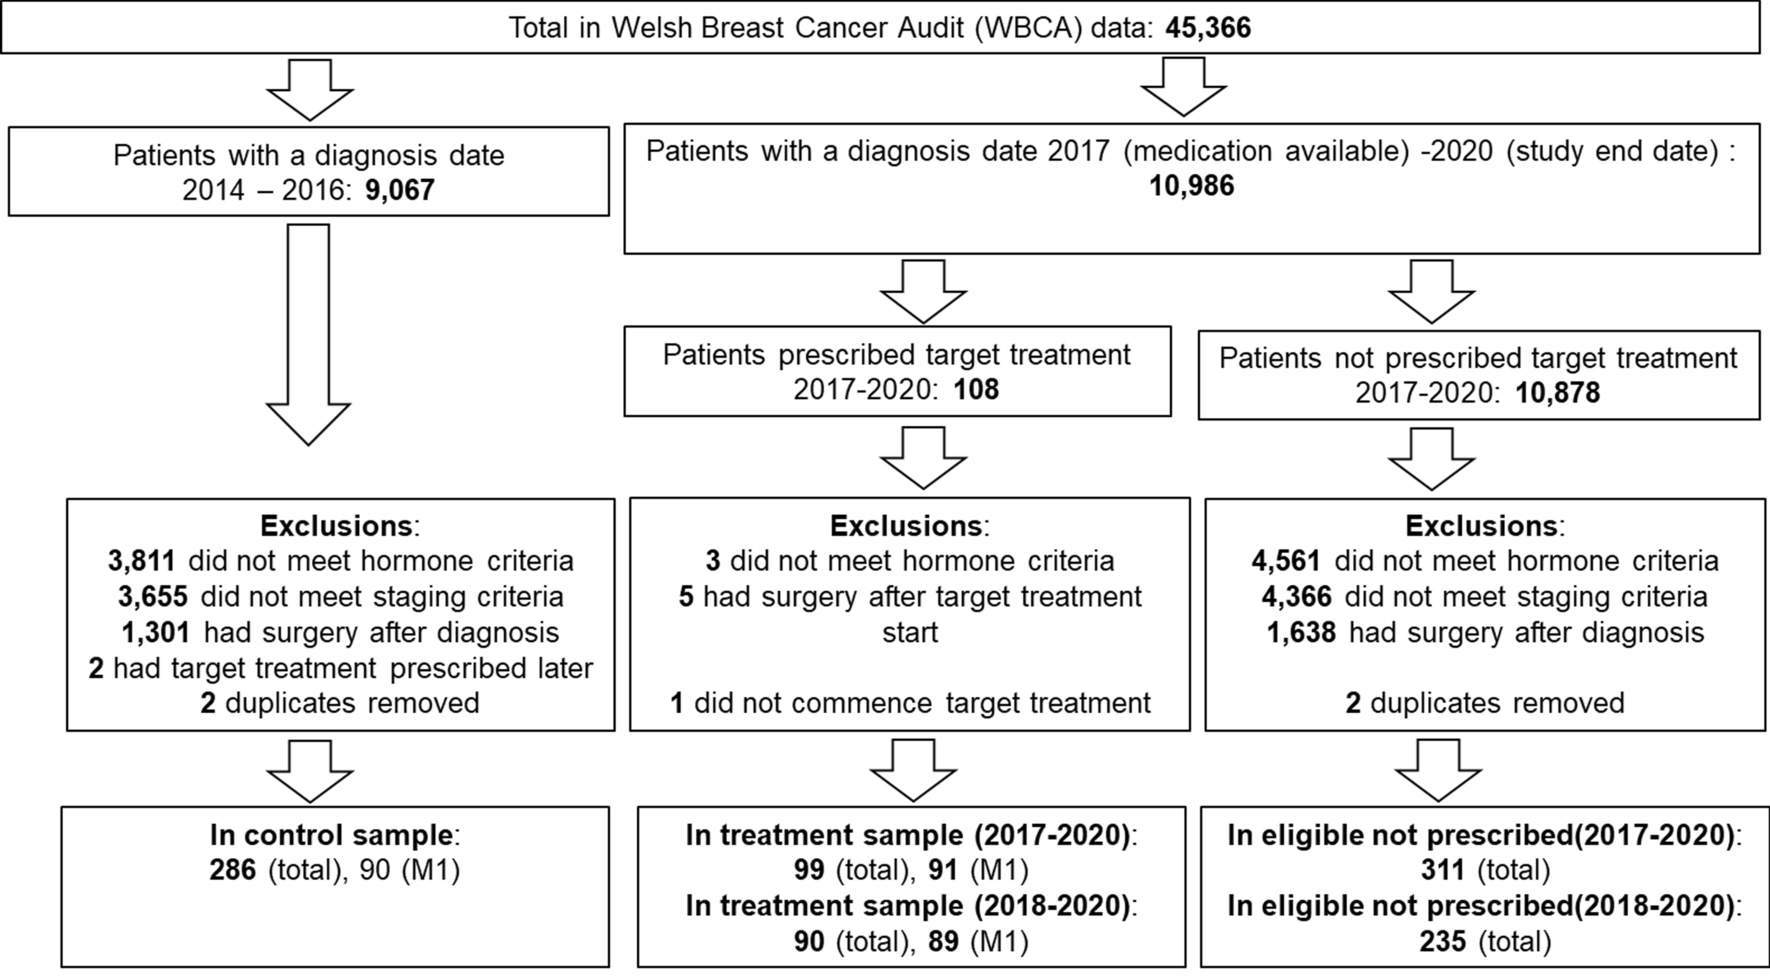


We constructed a two-state Markov model to assess the cost-effectiveness of OAT among patients with OUD in Norway, as shown in Fig. 1. To conceptualize our model and input parameters, we expanded on the cost-effectiveness model developed by Connock et al. [19, 23] and adapted our model to the Norwegian context. The model by Connock et al. has previously been used in a UK health technology assessment (HTA) to analyze the cost-effectiveness of buprenorphine maintenance treatment and methadone maintenance treatment.
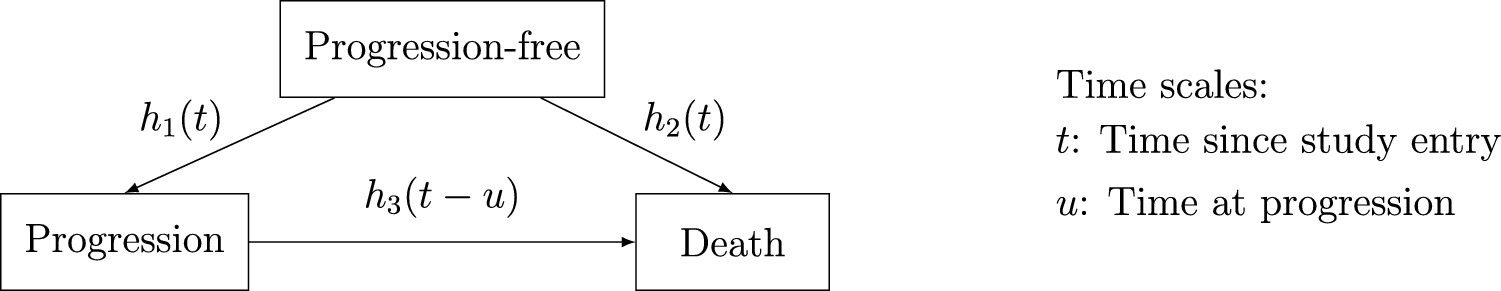
Fig. 1
Markov model structure. Health events are presented in rectangles and health states are presented in ovals
OUD and Death are the two health states in our model. Our model accounted for two events when patients are in the OUD health state: adverse health events leading to healthcare consumption and criminal activities. The adverse health events captured the healthcare costs incurred from inpatient and outpatient treatments in somatic and psychiatric departments, general practitioner (GP), and accident and emergency (A and E) departments. The criminal activity event captured the societal cost of criminal events. Over a cycle, even though the patients might have any adverse health or criminal events, they were assumed to remain in the OUD health state in the model. Patients receiving OAT also accrued the cost of the treatment, including the cost of medication and administration across various dispensing facilities, as well as patient costs (time and travel). We collaborated with patient representatives and OAT experts during the model conceptualization and data identification phases. We conducted a group discussion with patient representatives to understand different adverse events patients with OUD suffer from during their everyday lives and various cost parameters when involved in any criminal offenses. When some of the input parameters were not available in the literature, or there were discrepancies in the value of the parameters due to geographical locations and OAT treatment settings, OAT experts, including doctors, professors, and nurses, were consulted to adjust the value.
Our Markov model simulated a hypothetical cohort of 1000 patients with OUD, aged 20 and over, with or without OAT. The cohort entered the model with a distribution of starting age (i.e. 5.2%, 21.10%, 31.60%, 29.50%, and 12.60% patients had a starting age between 20–29, 30–39, 40–49, 50–59, and 60+ years, respectively) [14]. The model simulated the cohort with a cycle length of one year and followed the patients until death, assuming a maximum life expectancy of 100 years.
The cost-effectiveness analysis was conducted using a lifetime time horizon to capture the overall costs and health outcomes due to the chronic nature of the disease and the fact that OAT affects mortality among patients with OUD. The cost-effectiveness of starting the intervention at the age of 48 (which is the mean age of patients receiving OAT in Norway) [14] was also carried out to be able to calculate the absolute shortfall value to establish the willingness-to-pay (WTP) threshold as further described in Sect. 2.3.1 below. The health benefits in the model were measured in life years (LYs) and QALYs. In the model, we assumed that patients with OUD with OAT were in a stable maintenance setting when they first entered the OAT treatment. Thus, the model captured the costs and benefits of an OAT regimen given to patients with OUD with a lifelong treatment perspective. However, we assume any cost and health effects of discontinuation or reinitiation of the treatment while in OAT are captured by our quality of life and treatment contact rates data (further details on different treatment contact rates in Sect. 2.2.3 below).
2.2 Model Input2.2.1 Interventions: Medications and Dispensing FacilitiesThe proportion of patients receiving various OAT medications (methadone, buprenorphine, and buprenorphine/naloxone) and the type of dispensing facility were obtained from the last annual Norwegian OAT status report [24]. The provision of OAT medications at five dispensing facilities (OAT clinics, pharmacy, general practitioner’s clinic, institution/residential center/prison, or municipal services) was assumed to reflect the various OAT medication delivery platforms at the country level, with some adjustments considering the assumption that only buprenorphine depots were administered in a general practitioner’s clinic. Further details on the distribution of the type of OAT medications and dispensing facilities are provided in Supplementary Information S1.5.
The comparator, no OAT scenario, depicts patients with OUD before undergoing OAT treatment. These patients might undergo occasional detoxification without subsequent drug therapy, including some psychological or psychosocial measures, in inpatient or outpatient settings [25, 26]. The rate of healthcare service utilization and involvement in criminal activities among patients with OUD in a no OAT scenario has been determined through Norwegian retrospective cohort studies tracking patients before and during OAT [7, 8, 27]. Since the late 1990s, OAT has been recommended as the standard care for OUD in Norway [28]. Recently, more efforts have gone towards enrolling and retaining patients to OAT through updating national guidelines and setting up low-threshold clinics to provide treatment to hard-to-reach patients with OUD by removing treatment initiation barriers such as abstinence from illicit substance use or need for a referral [5, 24]. Therefore, in our study, no OAT was chosen as a comparator.
2.2.2 Mortality RatesOne of the main input parameters for the model was the mortality rate among patients with OUD. The mortality rate during treatment was calculated using primary data. The data was drawn from the electronic patient journal system, DIPS Arena, which includes 10th revision of the International Classification of Diseases (ICD-10) diagnosis at referral and vital status of all patients that were referred to the Department of Addiction Medicine, Haukeland University Hospital, in Bergen, Norway, between 1 January 2011 and 31 December 2020. Individuals were included in the cohort if they had a referral to specialized addiction care between 1 January 2010 and 1 January 2020. The Regional Committee for Medical and Health Research Ethics in South-East Norway approved the use of this clinical routine data from hospital records without informed consent (approval no. 28499), and all data were stored on a safe server and anonymized.
The mortality rates were computed at 10-year intervals, from individuals aged between 10 and 19 years, 20 and 29 years, and up to those aged 50–59 years. The mortality rate for patients above the age of 60 was imprecise due to the small number of individuals in the cohort above the age of 60. Therefore, the all-cause mortality rate in the general population was utilized to adjust for the mortality rates among patients with OUD aged 60 or above with OAT with age-specific rate adjustment, further described in Supplementary Information S1.3. Using the incidence rate ratio, separate mortality rates were estimated for those prescribed methadone and buprenorphine. These mortality rates were subsequently used in our analyses (Further details in Supplementary information S1.3 and Table 1). The mortality rates were converted into the annual probability of death using the formula below before using it in the model, where r is rate, t is time in years, and P is probability.
$$P \, = \, 1 \, - }\left( \right).$$
(1)
Table 1 Input parameters for the modelThe relative risk of mortality without OAT was estimated from published literature identified during literature searches to estimate the mortality rates without OAT [11].
2.2.3 Rate of Healthcare Consumption and Criminal ActivityThe model included inpatient days and outpatient treatment rates in both somatic and psychiatric hospital departments due to acute and subacute disease incidents, accident and emergency (A and E) departments, and visits to the GP. For the criminal activity, the rate of criminal activity and proportion of different criminal activities: property theft, other offenses for profit, criminal damage, violence and maltreatment, drug and alcohol offenses, public order and integrity violations, traffic offenses, and others were included in the model. These parameters were obtained from published literature primarily identified during the literature search (Table 1). The rate of GP visits per year and the incidence rate ratio for mortality with buprenorphine compared with methadone were obtained from the UK studies, and the relative risk of mortality with or without OAT was obtained from a meta-analysis study. All other parameters listed in Table 1 have been obtained from studies conducted within the Norwegian OUD population.
2.2.4 Estimation of CostsThe study estimated the cost from both Norwegian extended health-service and societal perspectives. The Norwegian extended health-service perspective is the recommended perspective by the Norwegian Medical Products Agency (NOMA) while assessing the cost-effectiveness of a medicine product in Norway [31]. The extended health-service perspective included the direct medical costs: costs of treating somatic and psychiatric incidences, costs of OAT including the fixed cost of OAT outpatient clinics, and indirect costs, which included patient’s time and travel costs during OAT. From a societal perspective, the cost of criminal activity was included. The value of productivity was not included in our analysis due to a lack of reliable productivity information among patients with OUD; measurement issues among the patient population where informal, casual, and criminal employment are common, and a high rate of unemployment among patients with OUD, even with OAT, in Norway [24, 32].
Table 2 below presents a summary of different cost parameters with unit cost used for the analysis, and further details of each cost parameter are provided in Supplementary Information S2. All costs are reported in 2023 NOK. When the unit costs were not available in 2023 NOK, we applied the inflation calculator provided by Statistics Norway to convert all prices before 2023 to their relative amounts in 2023 [33].
Table 2 Resource use, costs, and health utility2.2.5 Health utility valuesHealth utility values were obtained from published literature and are reported in Table 2. Two studies reporting health utility values among patients with OUD with or without OAT were used for the analysis [12, 19]. Though there is scarce literature on the utility value among patients with OUD, especially without OAT treatment, the two selected studies were assumed to best reflect the OUD population in Norway. The health utility of patients with OUD without OAT was obtained from a cost-effectiveness study in the UK [19]. The overall health systems and demographics are not very different between Norway and the UK [18]. The health utility of patients with OUD with OAT was obtained from a study estimating the health-related quality of life among patients receiving OAT in OAT clinics in Bergen, Norway, using the EQ-5D-5L instrument [12].
Health utilities with OAT were stratified in broad age groups as reported in the literature, while the health utilities were adjusted for increasing age using the multiplicative method as described in the NICE DSU Technical Support Document 12 [31, 46].
2.3 Model AnalysisThe mean value obtained from probabilistic sensitivity analysis was used to estimate the lifetime cost and health benefits with or without OAT among patients with patients with OUD. QALYs were calculated by multiplying the health utility of patients with OUD who were alive at each cycle and accumulating them over the time horizon. Both the costs and health outcomes were half-cycle corrected and discounted by 4% for the first 40 years (cycle 0–39) and then by 3% for the subsequent remaining years in our model as recommended by the Ministry of Finance and the NOMA guidelines to undertake a single technology assessment [31]. The outcome of the analysis was presented as ICER by calculating the ratio of the difference in the total costs of OAT and no OAT divided by the differences in health outcomes with the two alternatives. Additionally, we compared the incremental lifetime costs and QALY of scaling up OAT from current coverage of around 70% up to 100% coverage, using the prevalence data estimated through the recent national OAT status report [14].
The analyses were carried out without a preregistered analysis plan in Microsoft Excel. This study has been reported in accordance with the Consolidated Health Economic Evaluation Reporting Standards 2022 (CHEERS 2022) Statement (Supplementary Table S12).
2.3.1 Equity Adjustment and WTP ThresholdThe upper limit of the willingness-to-pay (WTP) threshold was estimated using absolute shortfall value, according to the severity criterion of priority setting in healthcare in Norway. As standardized in Norwegian guidelines on priority setting, the severity criterion assigns a higher value to patients with short-lifetime health [47]. Benefits of healthcare to those with high lifetime prognostic health loss, e.g. those with severe chronic conditions or individuals living with disabilities, are given higher priority than those with conditions having low lifetime prognostic health loss [47]. In [47] according to the Norwegian guideline, the severity criterion should be balanced with the benefit and resource use criteria [47]. If health benefits and resource use are identical, the intervention that targets patients with higher lifetime health loss should be prioritized [48].
The severity of illness is measured in terms of absolute shortfall in Norway [31]. The absolute shortfall is the number of undiscounted future healthy life years an average patient in the patient group will lose because of his/her disease, compared with the average in the population of the same age [31]. The “healthy life years” are expressed as QALYs [31]. A disease with an absolute shortfall of 0 to 3.9 QALYs is given the lowest severity weight of one, and a WTP of NOK 275,000 per QALY gained is considered a cost-effectiveness threshold [49]. On the other end of the spectrum, a disease with an absolute shortfall greater than 20 is considered the most severe with a severity weight of three, and a WTP of NOK 825,000 per QALY gained is considered as a cost-effectiveness threshold [49]. These thresholds, however, are only for cost-effectiveness decisions with the extended health service perspective [31]. See Table 3 below for all severity-adjusted WTP thresholds in Norway, which were used to establish the cost-effectiveness of OAT compared to no OAT in this study.
Table 3 Absolute shortfall, severity weight, and WTP threshold2.4 Sensitivity Analysis and Model ValidationTo address uncertainty in model parameters and ensure the robustness of our results, we performed univariate, multivariate, and probabilistic analyses. Univariant sensitivity analysis involved varying individual parameters one at a time and recording the changes in the ICER. Using Monte Carlo simulation, the probabilistic sensitivity analysis simulated the model 10,000 times, each time varying the parameters according to the assigned probability distribution. Further details on sensitivity analyses are provided in Supplementary Information S1.7.
We have completed the Assessment of the Validation Status of Health-Economic decision models questionnaire, which reports the steps taken to validate and increase confidence in our decision model. The questionnaire is provided in Supplementary Information S5. We also assessed the external validity through a component validation of the model (Supplementary Table S12). The mortality rate of patients with OUD with OAT in the model was validated using a national observational registry study [50]. Further details on model validation are provided in Supplementary Information S5.
2.5 Budget Impact AnalysisThe budget impact of extending OAT to all prevalent cases of OUD in Norway with a 5-year time horizon was estimated using the results from the base-case analysis.
The recent national OAT status report estimated that around 8500 patients in OAT in 2023 represent 70% of the target group for OAT in Norway [14]. We then estimated the budget impact of gradually extending OAT to 100% of the prevalent population, starting at 80% in year one and 5% increases each year until the fifth year. We explored the impact of uncertainty in the prevalence parameter (up to 20% higher value of the estimated prevalence data) during sensitivity analysis as presented in Supplementary Table S11.
Comments (0)