2.1 Updates to the Underlying Cost-Effectiveness Analysis (CEA)
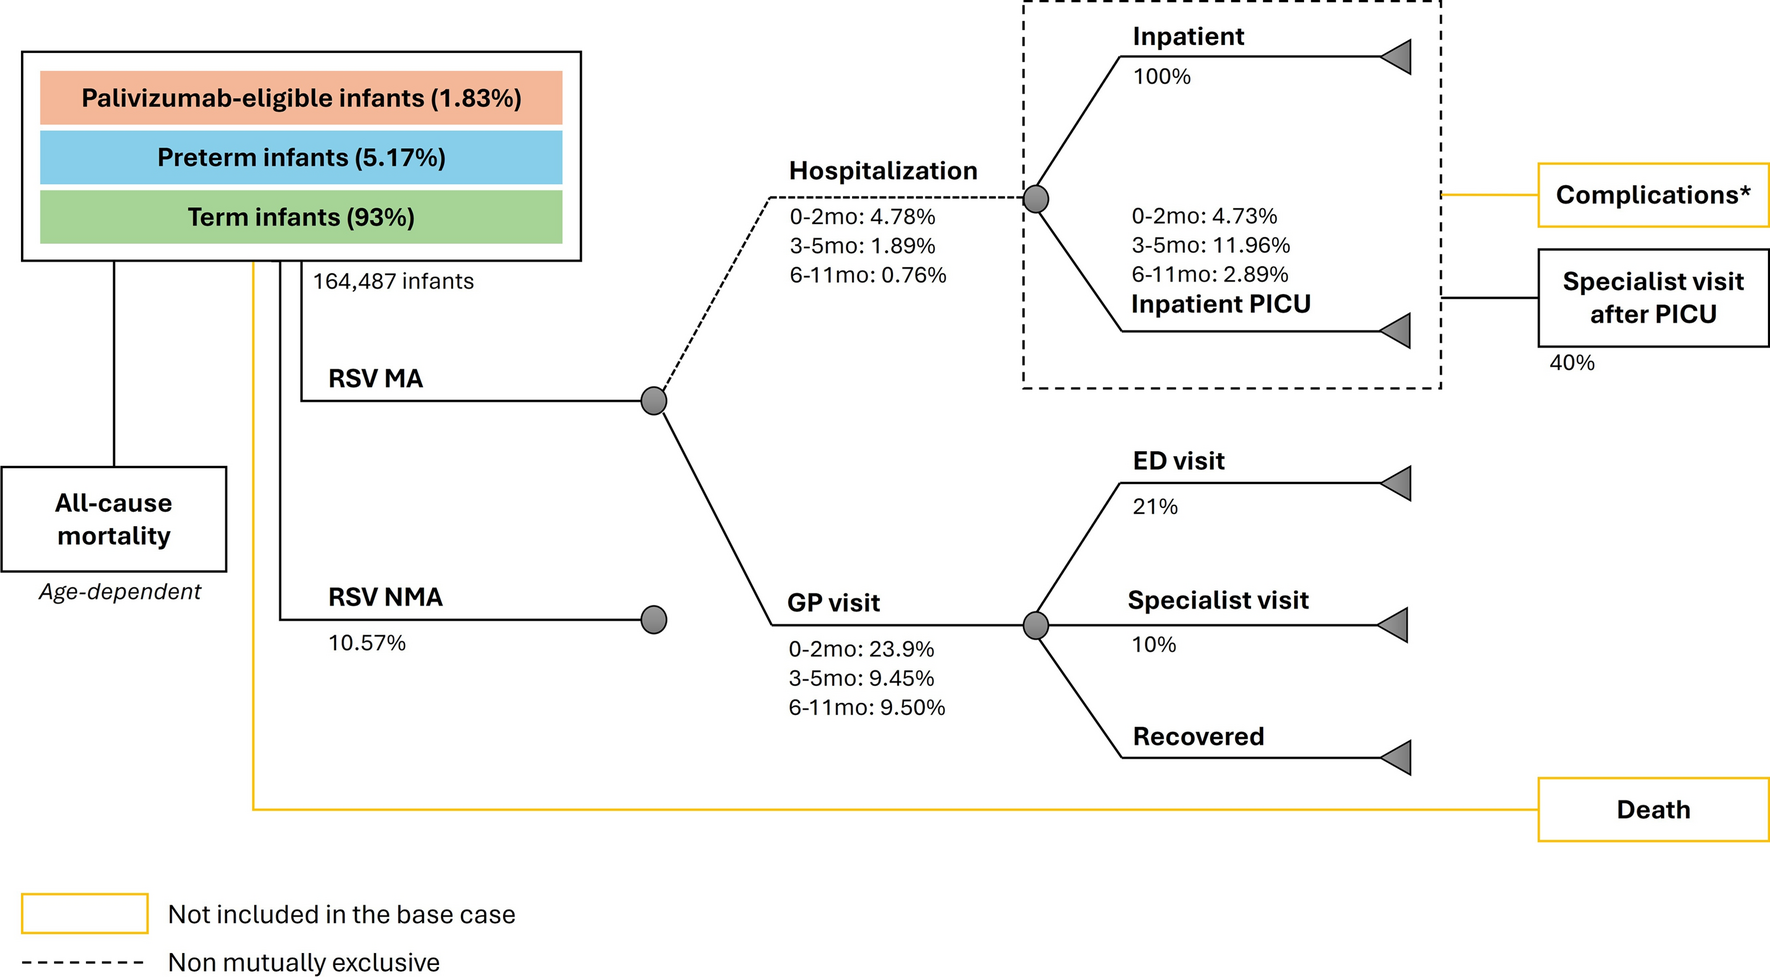
The underlying cost-effective analysis (CEA) was updated to reflect patient characteristics at admission, SOC outcomes, tocilizumab efficacy, and contemporary unit costs. The CEA used a decision tree to capture the inpatient treatment period, followed by a lifetime Markov model to estimate economic and health outcomes post-discharge (Fig. 1 of the Electronic Supplementary Material [ESM]) [9, 14]. The CEA framework evaluated acute treatments for hospitalized patients with COVID-19, including potential treatments with varying levels of impact on reducing mortality, use of mechanical ventilation, and length of hospital stay. Costs and health outcomes were discounted at 3% per year [15]. We report the current model-based study in compliance with Consolidated Health Economic Evaluation Reporting Standards (CHEERS) 2022 (Table 1 of the ESM) [15].
A targeted literature review was conducted to source recently published values to update the CEA inputs. The original CEA was based on a targeted literature review that included evidence up through February 2021. Therefore, our updated search collected published data on the proportion of patients receiving SOC requiring mechanical ventilation, health utilities and disutilities, length of stay parameters and annual healthcare costs after hospital discharge between February 2021 and 27 March, 2023. Databases (including PubMed and Cochrane Library) were searched using controlled vocabulary and keyword or free-text search terms, limited to studies in English. Final searches yielded 53 hits, with ten articles selected for full-text review (Table 2 of the ESM). For model inputs on health utilities and disutilities, length of stay parameters and annual healthcare costs after hospital discharge, the targeted literature review did not identify more recent sources over the prior CEA. Therefore, these inputs remained consistent with the previous CEA and DCEA publications [9, 14]. Additionally, tocilizumab efficacy and baseline patient characteristics were sourced from a meta-analysis of tocilizumab clinical trials and inpatient costs [16]. Drug costs were updated using published list prices and publicly available databases [17,18,19]. The CEA inputs are summarized in Tables 1 and 2.
Table 1 Resource use and cost inputsTable 2 Efficacy and utility inputsThe original DCEA for inpatient COVID-19 treatment assumed a hypothetical active treatment relative to SOC based on the average performance of agents recently approved in 2021 or in late-stage development. The present analysis evaluated the impact of tocilizumab use relative to SOC since its Emergency Use Authorization in June, 2021, to more accurately quantify the predicted equity impacts of an approved treatment. Tocilizumab was compared to SOC treatment from 2021 onwards [16]. Standard of care was defined as standard care according to local practice (including antibiotic agents, antiviral agents, corticosteroids, vasopressor support and/or anticoagulants, all used at the discretion of clinicians).
To reflect the eligible population for tocilizumab, the modeled population was restricted to inpatient COVID-19 adults receiving oxygen support at baseline, including supplemental oxygen (42%), non-invasive ventilation (42%), and invasive mechanical ventilation (IMV; 16%) (Table 1) [16, 20]. Data from the Centers for Disease Control and Prevention (CDC) from 2022 were used to estimate the proportion of patients receiving IMV upon hospital admission [21]. A meta-analysis of interleukin-6 COVID-19 trials was used to estimate mortality among patients receiving SOC stratified by oxygen support level (supplemental oxygen [16.57%], non-invasive ventilation [32.87%], and IMV [41.90%]) [16].
The cost of tocilizumab was US$6408 per treatment cycle based on the average patient weight of 91.51 kg (Table 1) [16, 17, 20]. Diagnosis-related group (DRG) inpatient costs were calculated from two sources. First, we used the Healthcare Cost and Utilization Project 2020 data to estimate the cost per inpatient stay by DRG for commercial and Medicare patients combined [18]. These costs were inflated to 2023 US$ using the medical care consumer price index from the Bureau of Labor Statistics [22]. Second, we estimated Medicare-specific costs by using data from the Centers for Medicare and Medicaid Services, including length of stay by DRG and the average inpatient cost [19]. The final cost of an inpatient stay for each DRG was the average across the Healthcare Cost and Utilization Project and CDC estimates, but costs were similar in trend and magnitude across both sources. All costs reflect 2023 US$.
Using data from a meta-analysis of clinical trials, tocilizumab efficacy was modeled as a reduction in IMV (odds ratio 0.72 and 0.74 for patients on supplemental oxygen and non-invasive ventilation, respectively) and a reduction in mortality for patients receiving supplemental oxygen only (odds ratio 0.80) (Table 2) [16]. As tocilizumab has shown a non-statistically significant effect on 28-day mortality for patients receiving supplemental oxygen or IMV, the model assumed no treatment impact on mortality for patients in these subgroups [16].
2.2 Overview of the Distributional Cost-Effectiveness Analysis (DCEA) Approach
In addition to the changes to the previous CEA, the DCEA was also updated. A DCEA is an extension of CEA, providing information about the distribution of health gains and losses across the population to estimate equity impacts of funding decisions. Within the target population for the intervention, the DCEA integrates information on how need for care, receipt of care, short-term effects of care, and long-term effects of care differ across equity-relevant population subgroups, or the ‘equity ladder” [23]. This allows researchers to understand whether a treatment brings different relative values to populations experiencing larger disparities in health today. Information on the distributional consequences of an intervention are combined with detailed analyses on the underlying spread of health disparities across equity-relevant population subgroups. This enables estimates of the overall equity impact of the intervention on the full covered population. The equity impact is driven by benefits of the intervention (quality-adjusted life-year [QALY] gains) and the impact of opportunity costs borne by society by diverting resources to invest in the intervention. Using an opportunity cost threshold, the total expenditure for a new intervention is translated into total health losses (in QALYs) taken from the total health of each subgroup to represent the broader equity consequences of funding decisions. Finally, DCEA incorporates societal preferences on addressing health disparities, or inequality aversion, to weight health gains in population groups with lower health. Cookson and colleagues provide additional information on DCEA steps and methods [23].
Following methods outlined by Cookson and colleagues, we assessed the impact of funding tocilizumab on US health equity. Patients receiving tocilizumab were subject to health gains from treatment, but the full US population was subject to health losses given opportunity costs of treatment [24]. We followed this approach for consistency with the prior COVID-19 DCEA, and to reflect how the impact of healthcare resources forgone was likely to be experienced beyond the treated population [9].
2.3 Baseline Distribution of Health Disparities in the USA
This analysis utilized newly available published information on the baseline distribution of health disparities in the USA across equity-relevant subgroups. Specifically, we modeled the impact of tocilizumab treatment on 25 equity-relevant subgroups based on race and ethnicity (five census-based groups) and county-level social vulnerability (five geographic quintiles) [11]. US census-aligned racial and ethnic subgroups included: non-Hispanic American Indian or Alaska Native (AIAN), non-Hispanic Asian and Pacific Islander (API), non-Hispanic black, non-Hispanic white, and Hispanic populations. Owing to the challenges in obtaining individual-level data associated with social health determinants, the social vulnerability index (SVI) from the CDC was used to identify US geographic areas with greater or less social vulnerability [25]. The SVI utilizes American Community Survey data to rank each US county on 16 social factors, resulting in an overall ranking and a separate ranking for four themes: socioeconomic status; household composition and disability; racial and ethnic minority status and language; and housing type and transportation. Percentile ranking values range from 0 to 1, with higher values indicating greater social vulnerability. Details on the methods for estimating baseline health across the 25 equity-relevant subgroups can be found in Kowal et al. [11]. In brief, all US counties were grouped into quintiles based on SVI scores ranked based on their aggregate SVI score, such that each quintile had the same number of counties. Each SVI quintile was divided into five distinct racial and ethnic subgroups, creating 25 unique population groups representing about 99% of the population. These groups allowed the DCEA to capture information on differences in DCEA inputs by race, ethnicity, and geography through county-level SVI inputs capturing geographic factors that shape health outcomes [26]. From the baseline health disparities data, information on population sizes within each equity-relevant subgroup was leveraged by age and sex, as well as average SVI values for each quintile and information on quality-adjusted life expectancy (QALE) (Table 3).
Table 3 Summary of key COVID-19 distributional cost-effective analysis inputs2.4 COVID-19 Hospitalizations and Disparities
Total weekly hospitalizations in the USA from July 2021 through September 2023 were obtained from the CDC’s National Healthcare Safety Network, reflecting the total number of new admissions of patients with laboratory-confirmed COVID-19 [27]. The CDC reported 4,107,843 hospitalizations in this time period, with 1,421,960 in 2021, 2,124,345 in 2022, and 561,538 in 2023 [27]. The number of total reported hospitalizations each week was combined with weekly estimates on COVID-19-associated hospitalizations by age group (years, 0–4, 5–17, 18–49, 50–64, ≥65) from the COVID-NET network to generate a mean estimate of the incidence of COVID-19 hospitalization by age and year [28]. Next, age-based yearly mean incidence estimates from 2021 to 2023 were applied to the population counts by age for the 25 equity-relevant subgroups (Tables 3 and 4 of the ESM). This bottom-up approach to estimating total COVID-19 hospitalizations allows for a more nuanced picture of the distribution of COVID-19 hospitalization burden across geography, race, and ethnicity, reflecting differences in the underlying age distribution across groups (Table 3) [11].
Consistent with the initial DCEA for inpatient COVID-19 treatments, we adjusted disease risk based on social vulnerability for several reasons. Studies examining the association between the level of social vulnerability and COVID-19 outcomes presented consistent findings on the increased risk of COVID-19 based on geographic factors and other social determinants of health [29,30,31]. Since the initial DCEA publication, public health efforts have increasingly used place-based measures. For example, most US states followed national guidance toward equitable allocation of COVID-19 vaccinations by adding place-based social disadvantage indices, such as the SVI, into public health allocation planning [5]. Furthermore, recent work examining the relationship between COVID-19 incidence, mortality risks, and a series of vulnerability measures found consistent trends and magnitudes of risk across the SVI, the Area Deprivation Index, the COVID-19 Community Vulnerability Index, and the Minority Health-Social Vulnerability Index [3]. For every decile increase in SVI, the COVID-19 incidence rate increased by 3% and mortality by 7% [3].
Information on average SVI values for each equity-relevant group, compared with the population average, was used to risk-adjust COVID-19 mortality and hospitalization rates (Table 3). The risk for increased COVID-19 incidence was applied to age, race, and ethnicity-based hospitalization rates [9]. We similarly adjusted the baseline mortality inpatient risk for the SOC arm in our model to reflect how different root causes at the geographic level drove inequality in COVID-19 mortality outcomes [30]. The following formula provides more detail on how the incidence and mortality adjustment by SVI were calculated:
$$}_/\text}\text=_/\text}\right)}^,$$
where SVIincidence/mortality was the relative increase in COVID-19 incidence or mortality risk with each decile increase in SVI and ΔSVI was the difference between the mean composite SVI estimate for each equity-relevant and the mean composite SVI in the full US population [11].
2.5 Estimating Tocilizumab Impact on Health Disparities
For the DCEA, we assumed a single US payer, US Medicare, which operates under a relatively fixed budget where funds covering inpatient COVID-19 treatments could result in opportunity costs from forgone funding of other interventions. The Medicare perspective was chosen to align with the previously published DCEA, supported by the fact that the majority of COVID-19 hospitalizations were in the population aged ≥65 years [9, 32]. At present, there is no empirical evidence on how opportunity costs are distributed across equity-relevant subgroups in the US healthcare system. Consistent with the previously published COVID-19 DCEA, our DCEA base case assumed an opportunity cost threshold of US$150,000 per QALY gained and an equal distribution of opportunity costs across equity-relevant subgroups [9]. The assumption of $150,000 as the opportunity cost threshold was aligned with the initial COVID-19 DCEA and commonly used willingness-to-pay thresholds [33]. Scenario analyses examined the impact of alternative opportunity cost thresholds ($50,000, $100,000) and varying assumptions on how opportunity costs are distributed. Aligned with recommendations from Cookson and colleagues, we explored the impact of assuming that opportunity costs were borne by the 15% of the population with the best health and 15% of the population with the lowest health (QALE) [24].
Additional scenario analyses examined how changes to SVI-risk assumption and utilization of tocilizumab impacted equity findings. Recognizing that local risks may deviate from national averages, one scenario used the higher rate of SVI risk used in the last COVID-19 DCEA, where each decile change in SVI was associated with a 14% increase in COVID-19 hospitalization and mortality [30]. Another scenario explored the impact of targeted intervention, with the use of tocilizumab increasing, or decreasing, by 50% from baseline values for the equity-relevant subgroups that comprised the 15% of the US population with the lowest baseline health, by SVI quintile (Q) group (Q1, least socially vulnerable; Q5, 15% most socially vulnerable; AIANQ5, AIANQ4, AIANQ3, non-Hispanic black Q5 [BQ5], AIANQ2, non-Hispanic white Q5 [WQ5], AIANQ1, and BQ4) (Table 1) [11].
The impact of social welfare was assessed through plots of the net impact of tocilizumab across subgroups, and the change in the Atkinson’s index of inequality in QALE at birth based on the difference in values before and after accounting for tocilizumab treatment [24]. As an inequality aversion parameter for the USA is not available, we assumed an inequality aversion level of 11 for the Atkinson index, based on a study of general public views elicited in the UK [34]. A value of 11 suggests that society values health gains to the worst-off of society (lowest quintile) about six times more highly than corresponding health gains to the best-off (highest quintile). To allow a more complete view of model results across potential levels of inequality aversion, we presented model base-case and scenario results on the equally distributed equivalent health (EDEH) graph. The EDEH, estimated as the following formula, is the equity-weighted mean of the health distribution that considers relative inequality and total health to represent overall social welfare.
N was the total population size, (the US population), hi represented individual health in QALE for each equity-relevant subgroup, and ε was the inequality aversion parameter (i.e., 11) [24]. Equity-weighted population-level net changes in health were presented across a range of inequality aversion parameters for the Atkinson index to show how equity consequences could change under varying assumptions on underlying inequality aversion, or alternate Atkinson index values [24, 35]. Plotted on the EDEH graph, values above 0 on the y-axis represent overall net increases in social welfare and the slope of the graph captures changes in social welfare across Atkinson aversion parameters. A positive slope suggests increasing equity improvement under increased equity weighting, or higher preference values placed on reducing health disparities [24, 35].


Comments (0)