
Remember me


A prospective, single-blinded, non-randomized cluster-controlled trial was conducted in two comprehensive intensive care units (ICUs) at a tertiary teaching hospital in China from September 1, 2023, to January 31, 2024. Each ICU served as a cluster, comprising a control group and an intervention group. To minimize the risk of interference, there was no crossover between the two clusters. Hospital staff (physicians and nurses) at the study site were aware of the nursing intervention study but remained blinded to group allocations and specific intervention protocols. Additionally, physicians and nurses from both wards did not overlap. The outcome assessors were aware of the participant group assignments. The study received approval from the Ethics Committee of Zhongnan Hospital of Wuhan University (Approval No. [2023023 K]). All participants provided informed consent, participated anonymously, and were informed of their right to withdraw from the study at any time.
Participants and settingThe inclusion criteria were as follows: (1) age ≥ 18 years; (2) length of ICU stay ≥ 1 night; and (3) a Richmond Agitation-Sedation Scale (RASS) score of 0 and ntensive Care Delirium Screening Checklist (ICDSC) score < 4.
The exclusion criteria were as follows: cognitive impairment or altered mental status (determined by a neurology specialist); psychiatric illness (determined by a psychiatric specialist); and the presence of delirium (ICDSC score ≥ 4).
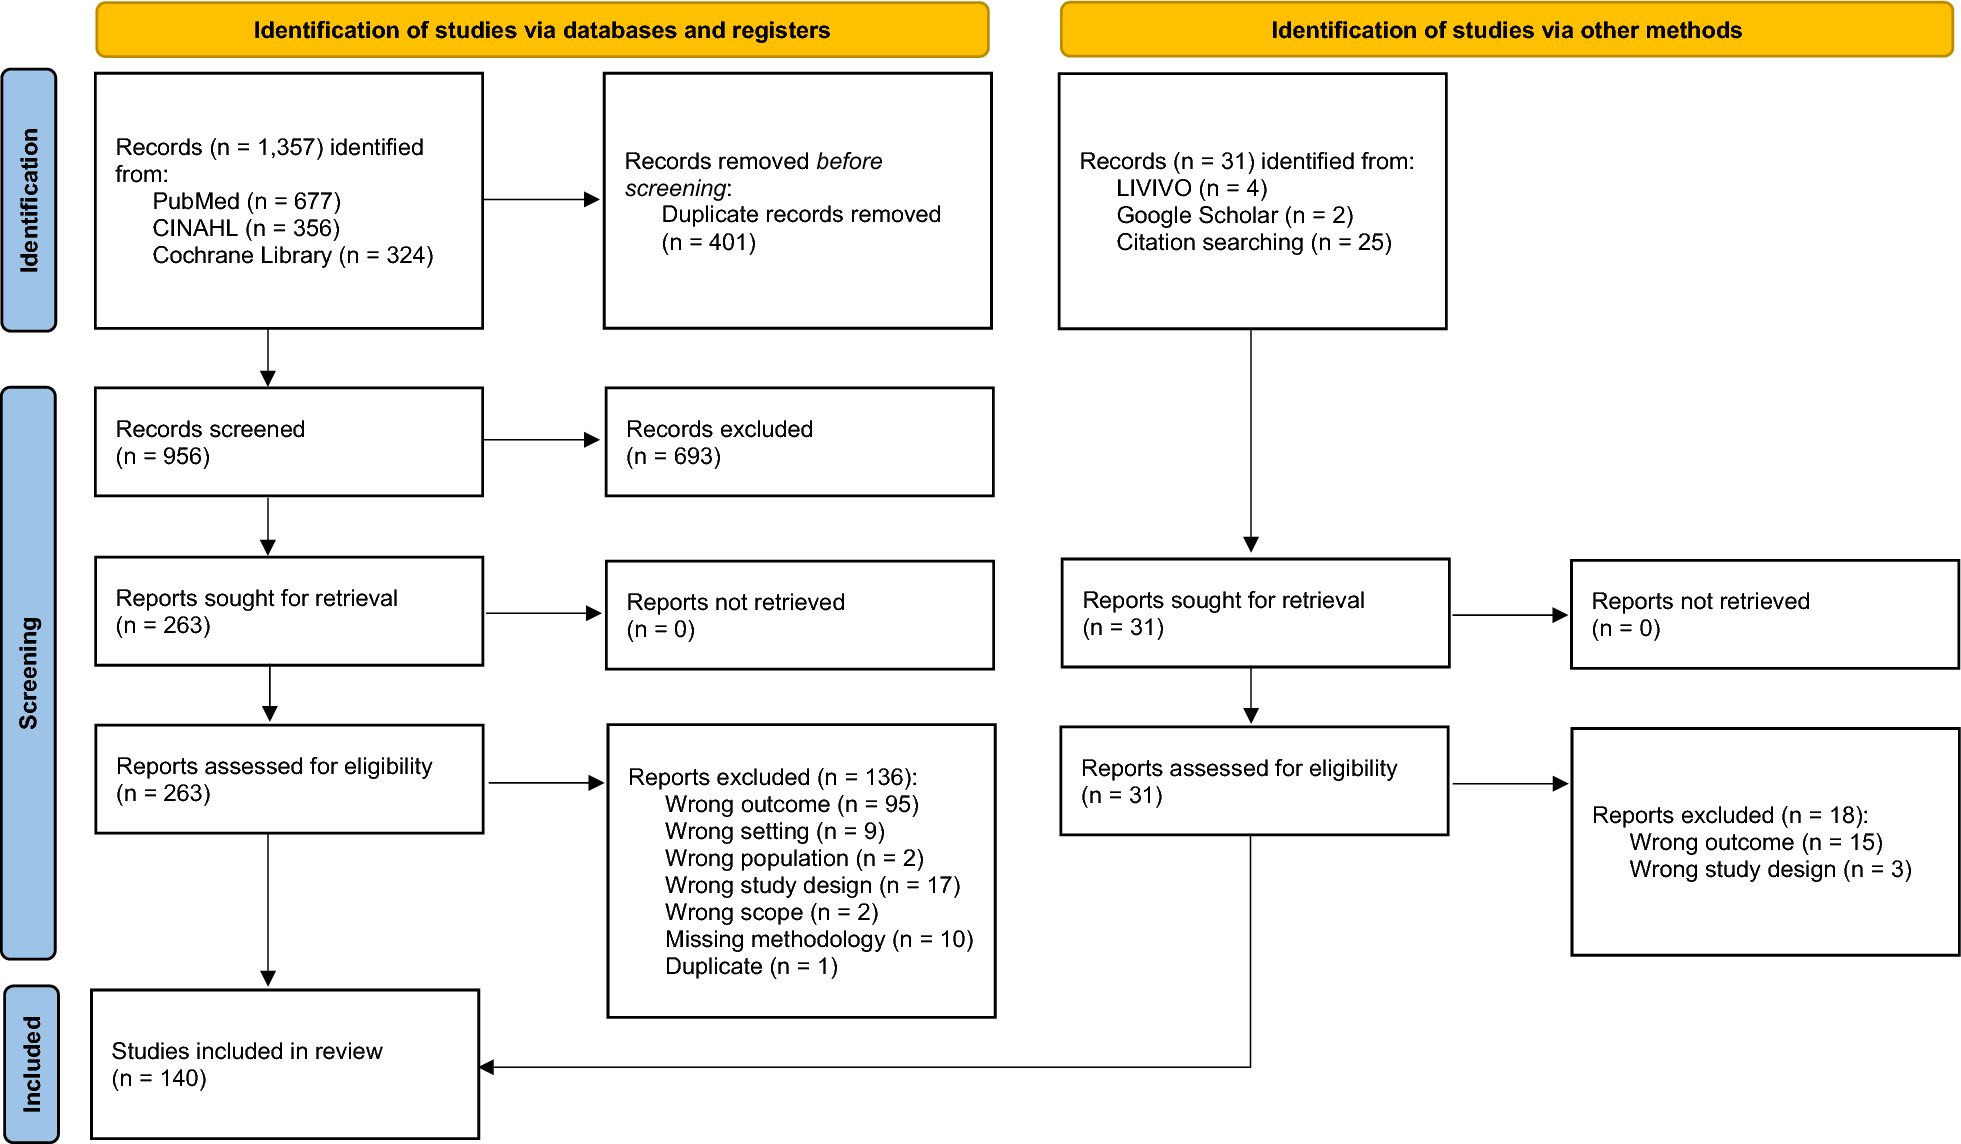
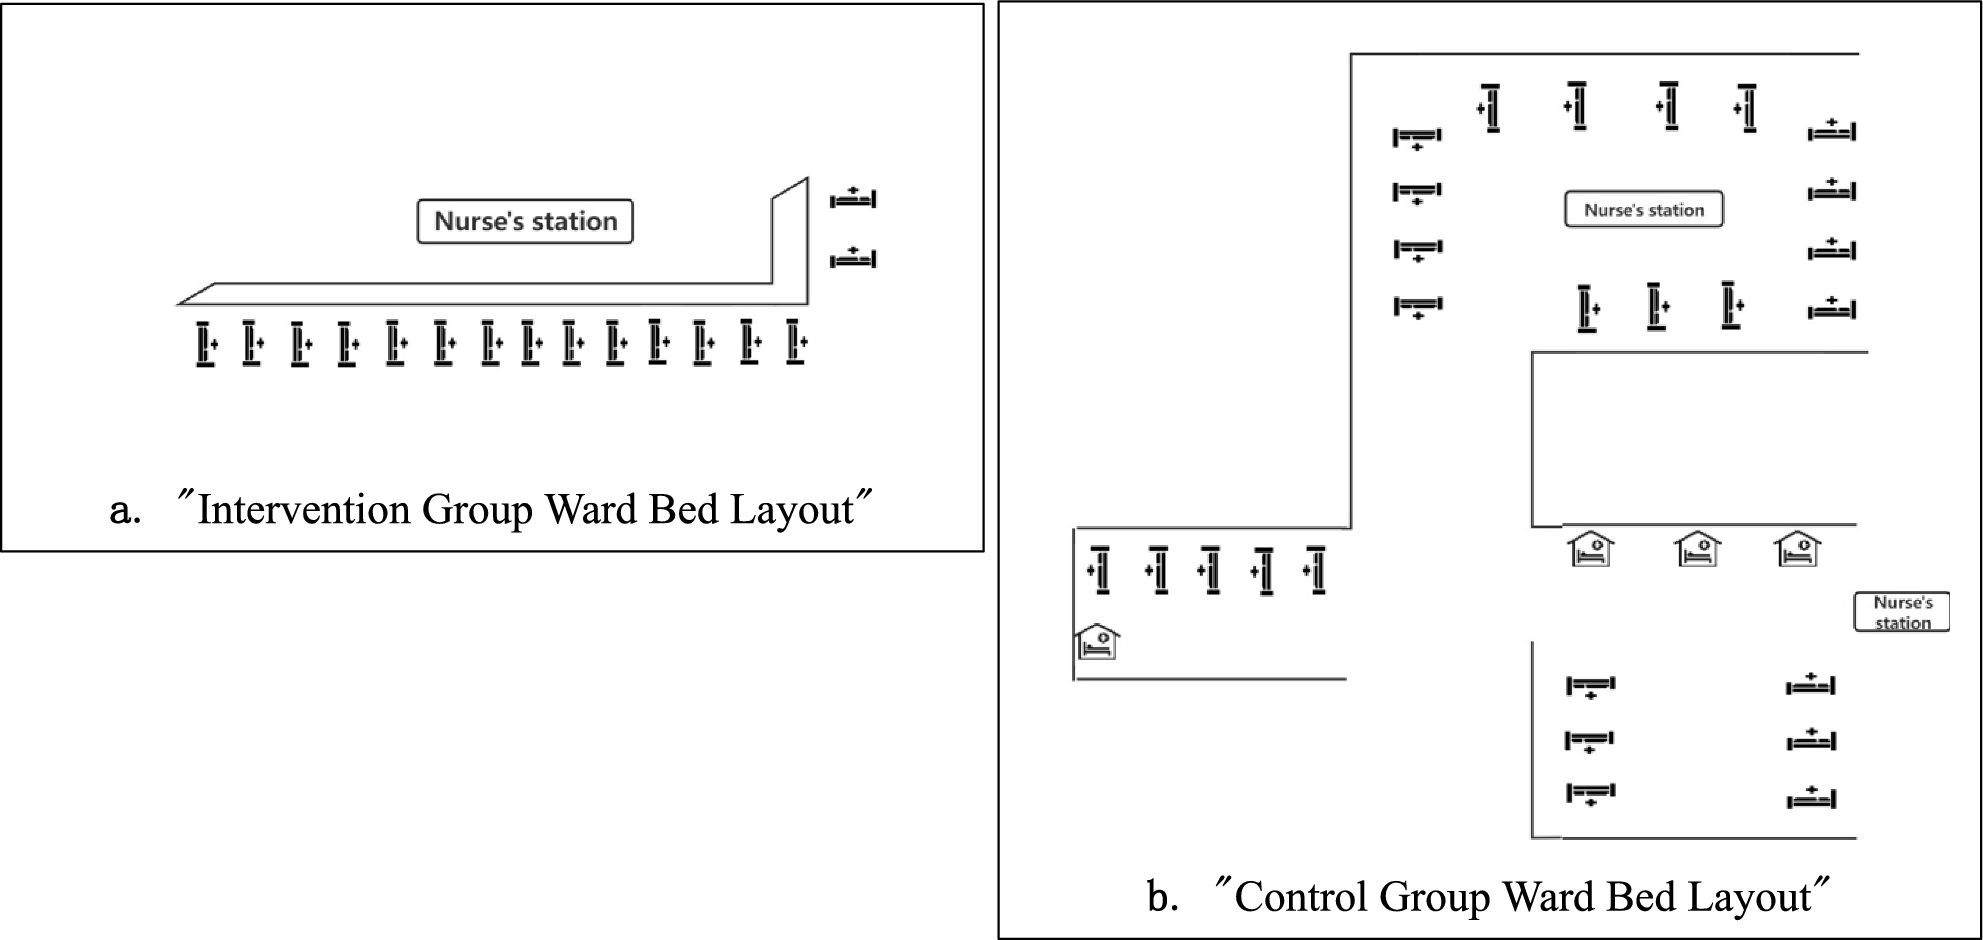
Setting: The layout of the ICU wards where the study was conducted included an intervention group ward with 16 beds in an open-space layout without individual rooms (see Fig. 1a). The control group ward included 30 beds, including 4 individual rooms, with the remaining beds located in an open-space layout. In this study, awake patients were accommodated in open-space beds, whereas beds in individual rooms were reserved for critically ill patients requiring protective isolation, strict isolation, or other forms of isolation, who were excluded from the study (see Fig. 1b).
Fig. 1
Layout of beds for the two groups
Sample size calculation: Based on the effect size analysis, d = 0.5 was set according to previous literature [14], α was set to 0.05, the test power P was set to 0.8, and the sample size calculation was performed via G-power. Considering a 10% dropout rate, the final calculated sample size was 116 cases for the intervention group and 116 cases for the control group, with a total of at least 232 cases needed for the study.
ProceduresIntervention Group: In the preliminary stage of this study, the "6S" model, the "6S" model (System, Summaries, Synopses of syntheses, Syntheses, Synopses of studies, Studies) [15] was integrated on the basis of evidence from evidence-based medicine, following a top-down approach. Relevant keywords such as "sleep disorder, sleep deprivation, sleep wake disorder, dyssomnias, intrinsic sleep disorders, circadian rhythm sleep disorders, intensive care unit, ICU, guidelines, and systematic review" were systematically searched across 19 Chinese and English databases. The quality of the literature was subsequently evaluated, evidence levels were assigned, evidence was summarized, and scholars in the relevant field were organized to determine recommendation levels and topics on the basis of the FAME structure of the Australian Joanna Briggs Institute (JBI), including feasibility, appropriateness, clinical significance, and effectiveness of clinical evidence. Finally, 17 pieces of evidence across 4 themes were summarized from 12 articles [16]. Based on the evidence-based and clinical context, relevant measures for the intervention group were formulated and are presented in Table 1. The content mainly includes four aspects: reducing ICU environmental noise, adjusting nursing-related actions, adjusting nighttime lighting, and others.
Table 1 Interventions and details of measures undertakenControl Group: Patients received routine care according to the ICU night nursing protocol, without additional improvement or intervention specifically targeting their sleep. This included maintaining regular ward environment conditions (i.e., lights not being turned off or dimmed, instrument alarm volumes not set to low levels, no provision of tools like eye masks and earplugs, but mobile phone ringtones adjusted to vibrate or mute). Analgesics were used routinely based on patient conditions, such as for postoperative patients, though dynamic assessments were rarely conducted.
MeasurementsDemographic and disease-related dataBased on the literature review, this study selected general demographic characteristics and relevant disease-related variables that may affect the sleep quality of awake ICU patients. Demographic data included age, gender, education level, medical insurance type, and marital status. Disease-related data included clinical diagnosis upon ICU admission, postoperative status, number of catheters carried (urinary catheters, drainage catheters, and middle and long venous catheters), oxygen delivery method, disease severity, pain score, use of analgesics, use of sleep aids, and use of earplugs and eye masks.
Acute physiology and chronic health evaluation II (APACHE II)The Acute Physiology and Chronic Health Evaluation II (APACHE II) is an objective system used to assess the severity of illness and prognosis in various critically ill patients. The APACHE II score consists of three parts: the acute physiology score (APS), age score, and chronic health status score, with a total theoretical maximum score of 71 points. In the comprehensive ICU, the APACHE II score is positively correlated with the severity of illness to some extent, with higher scores indicating a higher risk of death and more severe illness [17]. In this study, the APACHE II score was assessed by ICU clinical physicians within the first 24 h of ICU admission.
Numerical rating scale (NRS) for pain assessmentThe Numerical Rating Scale (NRS) for pain assessment is accurate and concise, using a scale of 0–10 to represent different degrees of pain (0 indicates no pain, 10 indicates severe pain). Scores of 0–3 indicating mild pain, 4–6 indicating moderate pain, and > 6 indicating severe pain. The Cronbach's α coefficient is 0.94 [18]. Patients select different values to quantify the intensity of their pain, with higher scores indicating greater pain intensity. The NRS is suitable for patients aged 10 years and above who have a certain level of education and understanding of abstract scales and text reading comprehension [19].
Richards-campbell sleep questionnaire (RCSQ)The Richards-Campbell Sleep Questionnaire (RCSQ) was developed by American nursing expert Richards in 2000 [20] and is used mainly to measure the sleep quality of patients in the intensive care unit (ICU). The questionnaire consists of 5 items, and uses a 0–100 mm visual analog scale to assess sleep depth, sleep latency, awakening, return to sleep, and overall sleep quality. The left end of the line represents 100 points, indicating good sleep, whereas the right end represents 0 points, indicating poor sleep. Patients mark the point on the line that represents their sleep quality the previous night, and the distance from the marked point to the right end of the line is measured using a ruler and recorded as the patient's score for this item. The RCSQ sleep score is the average score of the 5 items, with higher scores indicating better sleep. This study used the Chinese version of the RCSQ translated by Yang Hui et al. [21]. in 2016, with content validity of 0.840, a Cronbach’s α coefficient of 0.874, and test–retest reliability of 0.912.
Objective sleep monitoring toolActivity recorders continuously measure human movement using devices similar to watches (ACT-Trust AT0503, São Paulio, Brazil), providing an objective method for quantifying sleep and circadian rhythms. This study used wearable activity recorders for sleep monitoring: the Huawei Honor 7 Sports Bracelet, which objectively evaluates patient sleep quality. The TruSleep2.0™ sleep monitoring technology inside the device assesses sleep quality based on motion data obtained from an accelerometer, pulse wave signals obtained from a heart rate sensor, and device wearing status detected by wearing detection sensors. According to validation by the University of Bern, Switzerland, compared with polysomnography (PSG), the TruSleep2.0™ sleep monitoring technology has an accuracy rate of 96.3% in identifying sleep states [22]. Chen et al. [23] conducted a validation study of its use in monitoring sleep in ICU patients, confirming the value of the technology in improving sleep quality in critically ill patients, reducing the use of sedative drugs, and reducing the rate of acquired delirium in the ICU. Participants wore the bracelet before sleep, and the Huawei Sports Health App's sleep module displayed the TruSleep2.0™ sleep monitoring technology's assessment of the participant's sleep quality the previous night when connected to the smartphone via Bluetooth in the morning. This assessment included total sleep time, deep sleep time, light sleep time, rapid eye movement (REM) duration, number of awakenings, sporadic naps, and overall sleep score.
OutcomesThe primary outcome measure of this study was the sleep quality of awake ICU patients (total scores on the RCSQ scale and sleep monitoring device), whereas secondary outcome measures include changes in sleep quality among who stayed in the ICU for 2 nights or more.
Data collectionBefore data collection commenced, the participants were briefed on the purpose, procedures, and confidentiality of the study, and written informed consent was obtained. Demographic and disease-related data of the participants were collected from electronic medical records. On the first night of ICU admission (not exceeding 10 pm), participants were fitted with sleep monitoring devices, which were removed at 7 am on the following day, and participants completed relevant questionnaire items (RCSQs). Completing the questionnaire took approximately 2–3 min.
Quality control① Selection bias control: Strict adherence to inclusion and exclusion criteria in selecting participants for the study.
② Intervention implementation control: Based on evidence-based clinical evidence, quality review indicators were developed with credibility, effectiveness, and measurability principles in mind. A total of 14 quality control review indicators were established, including 1 structural indicator, 11 process indicators, and 2 outcome indicators. The quality control objects and methods of the quality control indicators were determined item by item, as shown in Table 1 of Supplementary file 1. The degree of implementation of the review indicators was supervised using the "Improving Adult ICU Patient Sleep Quality Evidence Application Review Indicator Clinical Compliance Inspection Checklist" (see Table 2 in Supplementary File 1). Additionally, to ensure the effectiveness of the intervention group, the "ICU Patient Nighttime Sleep Improvement Checklist" was developed (see Table 3 in Supplementary File 1).
Table 2 Patient characteristicsTable 3 Results of the partial intervention measures implemented (n = 125)Data analysisThe data were entered and cross-checked by two individuals to ensure accuracy. Statistical analysis was conducted via SPSS 26.0 software and Mplus 8.3 software. The sleep quality data for both groups are expressed as the means ± standard deviations, The baseline characteristics of both groups are presented as frequencies and percentages (n (%)) and were compared via t-tests and chi-square tests. Pearson correlation analysis was used to explore the relationship between ICU length of stay and sleep quality, while between-group comparisons were performed using one-way analysis of variance (ANOVA), with P < 0.05 indicating statistical significance. The feasibility of intervention implementation was explored through frequency data. Cohen's d was used to determine the effect size of the intervention group’s sleep quality-related data, with effect sizes classified as small, medium, or large at critical points of 0.20, 0.50, and 0.80, respectively [24]. Paired sample t-tests were used to analyze sleep quality between the first night and the night before transfer from the ICU in the intervention group.
Exploratory latent profile analysis was conducted to compare heterogeneity in sleep quality among awake adult ICU patients in the two groups. Likelihood ratio chi-square tests, the Akaike information criterion (AIC), the Bayesian information criterion (BIC), and the sample size-adjusted BIC (aBIC) were used to compare differences between expected and actual values to assess model fit. Lower values indicate better fit. Bootstrap likelihood ratio tests (BLRTs) and Lo-Mendell-Rubin likelihood ratio tests (LMRs) were used to compare fit differences between models with K-1 and K profiles. Statistical significance (P < 0.05) indicates that the model with K profiles is superior to the model with K-1 profiles, where K represents the number of freely estimated parameters [25]. The entropy value approaches 1 as the classification precision increases.
Comments (0)