
Remember me


To investigate the biochemical properties of the hDicer helicase domain, we expressed this domain (called HEL) using Escherichia coli (Additional file 1: Fig. S1a) [38]. Because the hDicer helicase domain contains the well-conserved Walker A and Walker B motifs (Fig. 1c), which are associated with ATP binding and hydrolysis, respectively, in the first step, we tested whether the obtained HEL preparation can hydrolyze ATP. We examined a time-course of ATP hydrolysis using equimolar amounts of HEL and [γ32P]-ATP substrate (2 nM). As yet, there have been no reports on the ATPase activity of hDicer. Therefore, we also investigated the activity of full-length wild-type hDicer (WT hDicer), and a hDicer mutant with a lysine (K) to alanine (A) substitution in the Walker A motif at position 70 (hDicer_K70A). The well-conserved K residue in the Walker A motif, GK(T/S), is crucial for ATP binding, and mutations of this residue in all investigated ATPases/helicases strongly inhibited nucleotide binding and enzymatic activity [22]. The reaction mixtures were separated by denaturing polyacrylamide gel electrophoresis (PAGE) and visualized by phosphorimaging (Fig. 2). Our data revealed that ATP was hydrolyzed in reactions carried out with HEL (Fig. 2a) and WT hDicer (Fig. 2b), and that the efficiency of ATP hydrolysis by both proteins was similar (Fig. 2d). Very low levels of ATP hydrolysis activity were observed for hDicer_K70A (Fig. 2c). In addition, we performed the ATP hydrolysis assay with a hDicer variant lacking the helicase domain (hDicer_ΔHEL). For hDicer_ΔHEL, no ATP hydrolysis activity was detected (Additional file 1: Fig. S2). To provide a deeper insight into the ATPase activity of HEL, hDicer and hDicer_K70A, based on the collected curves (Fig. 2d), we calculated the initial velocity (V0) values that reflected the efficiency of ATP hydrolysis within the first minute of reaction. These results showed that the initial rate of HEL-assisted ATP hydrolysis was 0.087 [nM/min], and the initial rate of WT Dicer-assisted ATP hydrolysis was 0.068 [nM/min]. For hDicer_K70A, almost no ATP hydrolysis was observed during the first 15 min of reaction, thus for this hDicer variant, the V0 value was designated 0. After a ~ 40-min incubation with HEL or full-length WT Dicer, both proteins consumed half of the substrate (1 nM/ 40 min), while after a 120-min incubation, we observed that ~ 80% of the substrate (~ 1.6 nM) was hydrolyzed by both enzymes. Furthermore, a comparative analysis of ATP hydrolysis activity between WT hDicer and hDicer_K70A revealed that hDicer_K70A hydrolyzed ATP with ~ 400-times lower efficiency than WT hDicer (Additional file 1: Fig. S3).
Fig. 2
Time-dependent ATP hydrolysis activity of HEL, WT hDicer and hDicer_K70A. a Denaturing PAGE analysis of mixtures of [γ32P]-ATP (2 nM) and HEL (2 nM). Samples were taken at: 1, 5, 15, 30, 60, 90 and 120 min from reaction mixtures incubated at 37 °C, C- indicates a control sample with no protein and 32Pi indicates the product of [γ32P]-ATP hydrolysis. b Denaturing PAGE analysis of mixtures of [γ32P]-ATP and WT hDicer (2 nM). Samples were analyzed at: 1, 5, 15, 30, 60, 90 and 120 min, reaction mixtures were incubated at 37 °C, C- indicates a control sample with no protein and 32Pi indicates the product of [γ32P]-ATP hydrolysis. c Denaturing PAGE analysis of the mixtures of [γ32P]-ATP and hDicer_K70A (2 nM). Samples were taken at: 1, 5, 15, 30, 60, 90 and 120 min from reaction mixtures incubated at 37 °C, C- indicates a control sample with no protein and 32Pi indicates the product of [γ32P]-ATP hydrolysis. d Graph quantifying progression of ATP hydrolysis reactions. The x-axis represents the incubation time expressed in minutes, and the y-axis represents the percentage of hydrolyzed ATP by HEL, WT hDicer and hDicer_K70A. Error bars represent standard deviations (SD) based on three separate experiments
Previous research has shown that a K70A mutation in hDicer, or the deletion of the helicase domain, does not seem to significantly impact pre-miRNA cleavage efficiency of these variants in comparison to the pre-miRNA cleavage efficiency of the wild-type full-length hDicer [39]. Consequently, to ensure that WT hDicer, hDicer_K70A and hDicer_ΔHEL adopt their native structures, we performed a pre-miRNA cleavage assay. The cleavage assay involved 5ʹ-32P-labeled pre-miRNA (5 nM) and the protein (10 nM). The results showed that, under the applied reaction conditions, WT hDicer, hDicer_K70A and hDicer_ΔHEL displayed similar pre-miRNA cleavage efficiency (Fig. 3). Importantly, in the case of dsRNA substrates, hDicer variant lacking the helicase domain processes a perfect-duplex dsRNA substrate with much higher efficiency than the intact hDicer [39].
Fig. 3
RNase activity assay involving WT hDicer, hDicer_K70A and hDicer_ΔHEL. PAGE analysis of the mixtures containing: pre-mir-21 (5 nM) and WT hDicer (10 nM) or hDicer_K70A (10 nM) or hDicer_ΔHEL (10 nM). Reaction mixtures were incubated at 37 °C for 10, 30, 60 and 120 min. C- indicates controls containing only the substrate in the reaction buffer. C + indicates controls containing the substrate in the reaction buffer with the addition of the Mg2+-chelating agent, EDTA (25 mM). + EDTA indicates samples where the reaction buffer was supplemented with 25 mM EDTA. Bottom panel Quantitative analysis of the RNase activity assay. The x-axis represents the incubation time expressed in minutes, and the y-axis represents the percentage of produced miRNA
Based on comparing the tertiary structures of the helicase domain of hDicer and the PcrA helicase from Geobacillus stearothermophilus [40] (Fig. 4a), both containing the well-conserved Walker A motif (GSGKT), it can be inferred that lysine 70 in the Walker A motif of hDicer is involved in ATP binding (Fig. 4b). Thus, we hypothesized that the diminished ATP hydrolysis activity of hDicer_K70A might be associated with reduced ATP-binding. To test this hypothesis we performed ATP binding assays involving either WT hDicer or hDicer_K70A. We performed an electrophoretic mobility shift assay (EMSA) with reaction mixtures containing: [γ32P]-ATP substrate (2 nM) and WT hDicer (3.59, 7.19, 14.38, 28.75, 57.5, 115 nM) or hDicer_K70A (36, 72, 144, 288, 575, 1150 nM). The data showed that WT hDicer bound ATP with a Kd value of ~ 85 nM, while only weak ATP binding could be observed for hDicer_K70A. This weak binding precluded determining a Kd value for this hDicer variant (Additional file 1: Fig. S4a). Accordingly, our data suggest that the lower level of ATP hydrolysis activity of hDicer_K70A results from its reduced affinity for ATP. Since for some DExD/H-box helicases binding of ATP was shown to be stimulated by an RNA substrate [26], we also carried out ATP binding assays for WT hDicer in the presence of RNA (32-nt RNA, R32). Collected results revealed that under the applied reaction conditions, RNA did not stimulate ATP binding to WT hDicer (Additional file 1: Fig. S4b).
Fig. 4
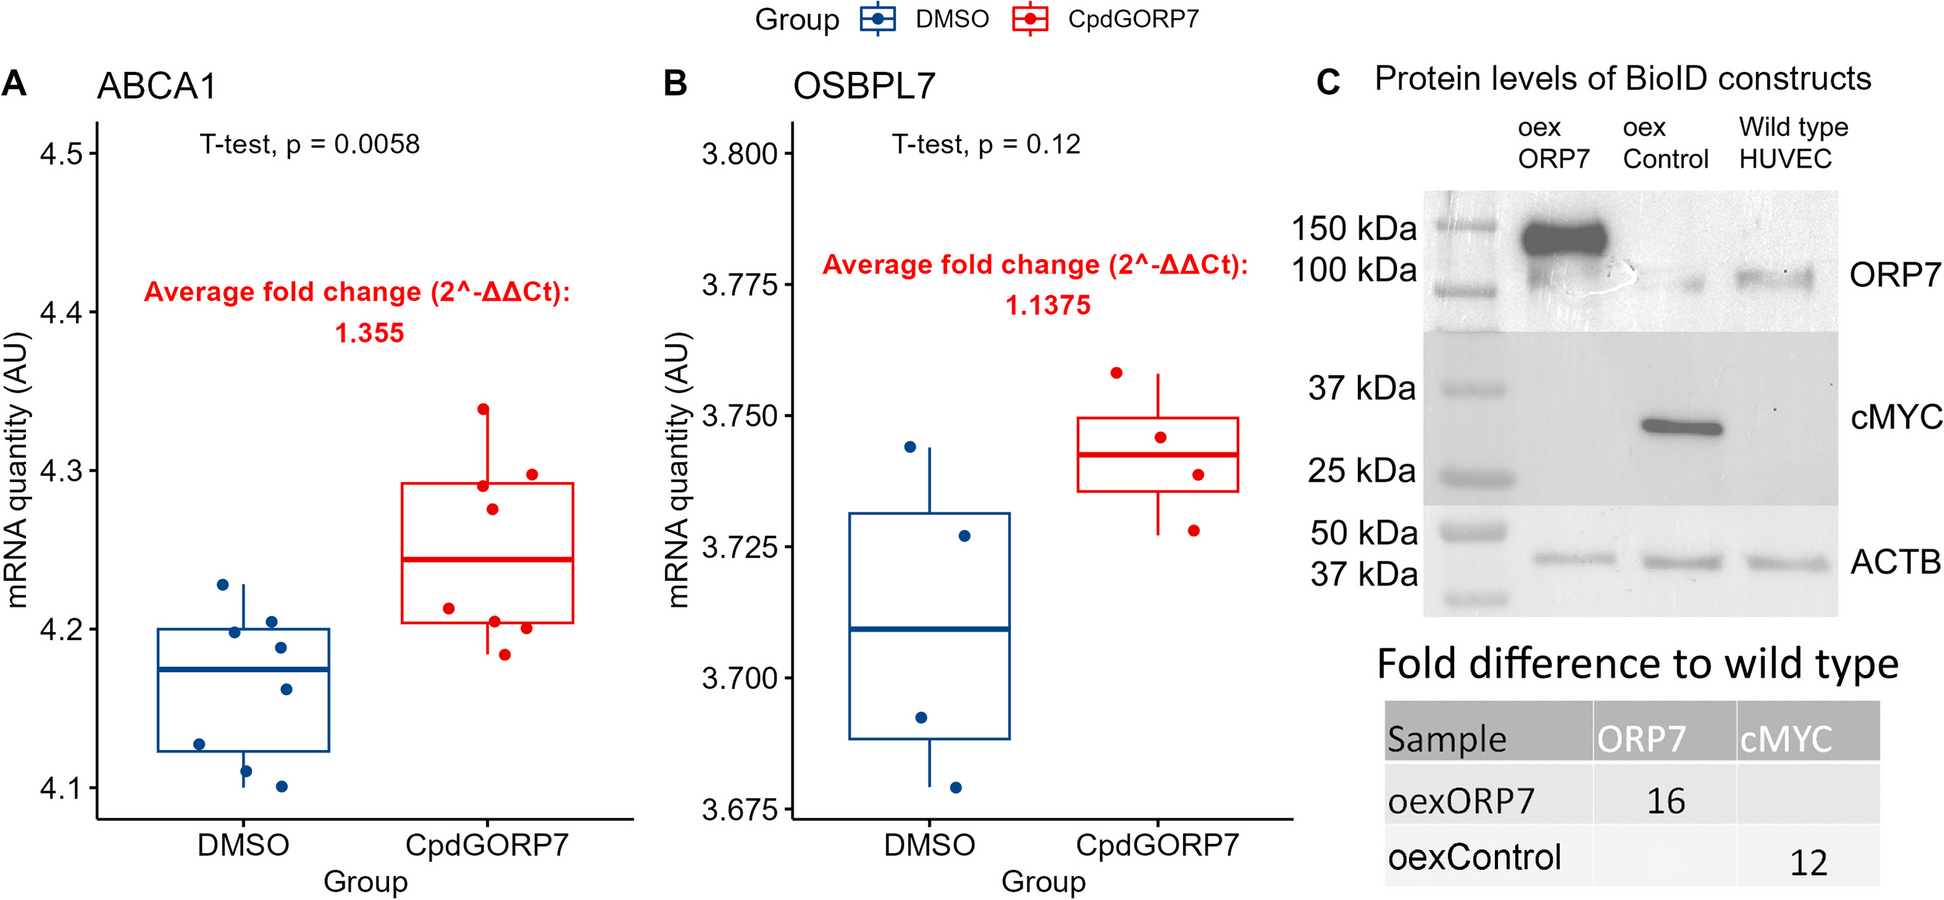
Walker A motif in PcrA helicase and hDicer. a Structure of the Walker A motif of PcrA helicase from Geobacillus stearothermophilus with interacting ATP substrate. The image was generated in PyMOL, based on structural data for the PcrA helicase (PDB entry 3PJR) [40]; the Walker A motif (GSGKT) is marked in red and the ATP is marked in turquoise. Hydrogen bonds between threonine 38 and lysine 37 and phosphates of ATP are indicated. Structure of the Walker A motif of: b WT hDicer helicase domain and c hDicer_K70A helicase domain. Tertiary structures of the WT hDicer helicase and hDicer_K70A variant helicase domain were obtained using SWISS-MODEL based on the structural data for hDicer (PDB entry 5ZAL) [9]. The fragment encompassing amino acid residues 67-71 of the Walker A motif (GSGKT) is marked in red. In the hDicer_K70A variant, the respective region (GSGAT) is indicated
Importantly, all presented studies were carried out under low-turnover conditions; thus, as a next step we analyzed the ATP hydrolysis activity of HEL and WT hDicer under high-turnover conditions. In this ATP hydrolysis assay we used 1 μM ATP substrate and 2 nM HEL or WT hDicer. However, under the applied reaction conditions, we did not observe the products of ATP hydrolysis (Additional file 1: Fig. S5).
Certain DExD/H-box proteins are known for their specificity for ATP rather than other nucleoside triphosphates [41]. To investigate the nucleotide preference of the helicase domain of hDicer, we performed the ATP hydrolysis assay using equimolar amounts of HEL and [γ32P]-ATP substrate (2 nM), and increasing amounts of non-radiolabeled nucleotides: ATP, guanosine 5′-triphosphate (GTP), cytidine 5′-triphosphate (CTP) or uridine 5′-triphosphate (UTP) (0.01, 1, 10 μM). The collected results showed that at 1 μM ATP, the [γ32P]-ATP hydrolysis by HEL was not observed (Additional file 1: Fig. S6a). These results are in line with the results of the ATP hydrolysis assay carried out under the high-turnover conditions (Additional file 1: Fig. S5). In the case of [γ32P]-ATP-hydrolysis reactions with non-radiolabeled GTP, CTP or UTP, even at their highest concentration (10 μM), still we observed the products of [γ32P]-ATP hydrolysis (Additional file 1: Fig. S6a). These results imply that the helicase domain of hDicer prefers ATP over other nucleoside triphosphates. In addition, we performed the ATP hydrolysis assays in the presence of adenosine 5′-diphosphate (ADP) or adenosine 5′-monophosphate (AMP) (0.01, 1, 10 μM). The collected results showed that, under the applied reaction conditions, the ATP hydrolysis activity of HEL was significantly inhibited at a 5,000 molar excess (10 μM) of ADP and only partially blocked by the highest concentration (10 μM) of AMP (Additional file 1: Fig. S6b). We also conducted ATP hydrolysis assays, in which we used 32-nt RNA or pre-miRNA (0.01, 1, 10 μM) as competitors. Under the applied reaction conditions, we did not observe substantial influence of the used RNAs on the ATP hydrolysis activity of HEL (Additional file 1: Fig. S6c). This result is in line with the results of the ATP binding assays by WT hDicer, in the presence of RNA (Additional file 1: Fig. S4b). ATP binding by hDicer was not influenced by the presence of RNA.
Altogether, our results show that hDicer can hydrolyze ATP and that the domain responsible for this activity is the helicase domain. Importantly, the ATPase activity of hDicer can be detected under low-turnover conditions. To the best of our knowledge, this is the first time this activity has been observed for vertebrate Dicers.
Nucleic acid binding activity of the hDicer helicase domainPrevious work has revealed that Dicer enzymes can bind several RNA substrates in the cell, and that binding of some of RNAs occurs without cleavage [37]. The authors have suggested that such passive binding of substrates is mediated by the Dicer helicase domain [37]. Assuming that the hDicer helicase domain plays an important role in the binding of various hDicer substrates, we investigated the nucleic acid binding properties of this domain. The binding assays contained the following types of substrates: (i) single-stranded RNAs (ssRNAs), including R12 (12 nt), R21 (21 nt), R32 (32 nt), R42 (42 nt) and R56 (56 nt); (ii) corresponding single-stranded DNAs (ssDNAs): D12, D21, D32, D42 and D56; (iii) pre-miRNAs, including pre-mir-21, pre-mir-33a and pre-mir-16–1; (iv) dsRNAs, including dsRNA_blunt (32 bp) and dsRNA_over (30 bp with 2-nt 3ʹ-overhangs); and (v) corresponding dsDNAs: dsDNA_blunt and dsDNA_over. Single-stranded substrates were 32P-labeled at the 5ʹ end and double-stranded substrates contained one strand that was 5ʹ-32P-labeled. Before they were applied to the reaction mixtures, ssRNAs and ssDNAs were denatured at 95 °C for 3 min and placed on ice to ensure they were single-stranded. Reaction mixtures containing a substrate (~ 2.5 nM) and HEL dilutions (2.97, 5.94, 11.86, 23.75, 47.5, 95 µM) were incubated at room temperature for 15 min. They were then separated using EMSA and visualized by phosphorimaging (Fig. 5). In general, the observed band patterns indicated that HEL can bind ~ 20-nt ssRNAs and ~ 20-nt ssDNAs, as well as longer substrates (Fig. 5). However, in the case of ssRNAs (Fig. 5a), distinct but low abundant complexes were only observed for R21 and R32 molecules. RNA•HEL complexes with R42 and R56 molecules were poorly detected. The ambiguous results and the weak signal made it impossible to determine the Kd values for the ssRNA•HEL complexes. In the case of ssDNAs (Fig. 5b), we observed distinct ssDNA•HEL complexes for the D32, D42 and D56 substrates. The densitometry analyses allowed us to calculate Kd values for the D42•HEL and the D56•HEL complexes; these values were: ~ 8.5 µM for D42•HEL, and ~ 7.4 µM for D56•HEL.
Fig. 5
Nucleic acid binding activity of HEL. a EMSA with HEL and 5ʹ-32P-labeled ssRNAs (2.5 nM): R12, R21, R32, R42, R56. b EMSA with HEL and 5ʹ-32P-labeled ssDNAs (2.5 nM): D12, D21, D32, D42, D56. Increasing amounts of HEL (2.97, 5.94, 11.86, 23.75, 47.5, 95 µM) are represented by a triangle. Reaction mixtures were incubated at room temperature for 15 min. C- indicates a control sample with no protein
Some helicases have been reported to maintain high affinity for nucleic acids in the ATP-bound state [42,43,44,45,46,47]. Consequently, to investigate whether ATP can affect ssRNA or ssDNA binding to HEL, we conducted binding assays in the presence of ATP. Collected results showed that, under the applied reaction conditions, ATP did not support ssRNA or ssDNA binding to the helicase domain of hDicer (Additional file 1: Fig. S7a). In addition, we investigated binding and stability of the ssRNA•HEL and ssDNA•HEL complexes over time in the presence of ATP, its non-hydrolysable analogue adenosine 5′-(β,γ-imido)triphosphate (AMP-PNP) or ADP. In these assays, we applied the R42 substrate, whose binding to HEL was not efficient (Fig. 5a) and D42, the DNA substrate that was efficiently bound by HEL (Kd ~ 8.5 µM) (Fig. 5b). Results of the EMSA assay showed that in the case of R42 neither ATP, ADP nor AMP-PNP significantly improved its binding to HEL (Additional file 1: Fig. S7b). Nevertheless, the signal from the R42•HEL complex was too weak to reliably estimate the increase or decrease in R42 binding to HEL over time. For D42, within the first 15 min of reaction, no effect of ATP, AMP-PNP or ADP on D42 binding to HEL was noticed (Additional file 1: Fig. S7c). After that time, in the case of the reactions carried out with HEL (no nucleotide added) and HEL (ATP added), the amount of DNA in the complex began to decrease, reaching ~ 80% of D42 bound to HEL after a 2-h incubation. Such a decrease was not observed for the reactions carried out with HEL (ADP added) and HEL (AMP-PNP added).
Taking into consideration the possibility that binding between a nucleic acid and HEL might be unstable during EMSA analysis, we next applied bio-layer interferometry (BLI) to investigate the interactions between ssRNAs or ssDNAs and HEL. BLI is an optical method for studying the affinity between molecules in real time without the need for fluorescence or radioisotope-labeled particles. This method is based on using biosensors that are specific to the proteins or other substrates being tested. For example, biosensors with Ni–NTA beads are suitable for use with proteins that have His6-tags, as in the case of HEL. BLI can be used to measure association and dissociation rate constants, as well as the equilibrium dissociation constant (Kd). Given the lack of observed complexes for R12•HEL and D12•HEL (Fig. 5) in the BLI assay, we used the following ssRNAs: R21, R32, R42, R56. Additionally, we used the following ssDNAs: D21, D32, D42, D56. The measurements were carried out using HEL (1 µM) and several substrate dilutions (3.125, 6.25, 12.5, 25, 50 and 100 µM). First, HEL was immobilized on Ni–NTA biosensor. After that, HEL-loaded sensor was immersed in a ligand-containing well, to monitor the association, and in a buffer-containing well, to monitor the dissociation of the nucleic acid•protein complex. Each measurement was repeated three times. The signals were too low to calculate reliable Kd values for the following substrates: R21, R32, D21 and D32 (Additional file 1: Fig. S8), although the association and dissociation curves were recorded. Kd values that met the quality control criteria, calculated based on association and dissociation curves, were collected for: R56•HEL (~ 23 µM) (Additional file 1: Fig. S8a), D42•HEL (~ 22 µM) and D56•HEL (~ 21 µM) (Additional file 1: Fig. S8b). Observed differences in Kd values obtained using EMSA and BLI methods may result from differences between the two different approaches. For example, the BLI method is more sensitive, allowing association and dissociation of complexes to be monitored in real time. Moreover, in the BLI method we applied increasing amounts of substrate, while in EMSA we used increasing amounts of protein. Nevertheless, it is important to note that the Kd values estimated by both methods were in a similar micromolar range.
The next set of binding assays involved pre-miRNA substrates: pre-mir-21, pre-mir-33a and pre-mir-16–1. The selected pre-miRNAs differ in the compactness of their secondary structures: pre-mir-21 adopts a compact structure, with a small terminal loop, pre-mir-33a contains large internal loops and bulges, but has a small terminal loop, while pre-mir-16–1 has a more relaxed structure, with a 9-nt apical loop (Additional file 1: Fig. S9a) [48]. Before they were applied to the reaction mixtures, pre-miRNAs were denatured at 95 °C for 2 min and slow cooled to room temperature to ensure they were properly folded. Reaction mixtures containing a 5ʹ-32P-labeled substrate (~ 2.5 nM) and different HEL dilutions (11.86, 23.75, 47.5, 95 µM) were incubated at room temperature for 15 min. Mixtures were then separated using EMSA and visualized by phosphorimaging. The results of the EMSA experiment revealed smeared bands for all reaction sets (Additional file 1: Fig. S9b). Band smearing can be attributed to weak and unstable binding between the pre-miRNA and HEL. The obtained results did not allow calculation of Kd values for the pre-miRNA•HEL complexes.
To get better insight into possible interactions between pre-miRNAs and HEL we applied small-angle X-ray scattering (SAXS) analysis. In this analysis we used pre-mir-16–1 and pre-mir-21. We used SASREF software [49] to model structures of pre-miRNA•HEL complexes using our experimental SAXS curves (Additional file 2: Datasets related to the SAXS studies), known structural data for HEL (PDB entry 5ZAL), and structures of pre-mir-16–1 and pre-mir-21 (predicted by RNAComposer) (Additional file 1: Table S1). Analysis of structural parameters such as volume and molecular weight revealed that pre-miRNA•HEL complexes formed with a 1:1 ratio. The obtained models indicated that HEL contacts the apical regions of pre-miRNAs mostly through the HEL2i subdomain (Additional file 1: Fig. S10). It must be underlined, however, that the above-mentioned assays (Additional file 1: Fig. S9 and Fig. S10) involved a stand-alone helicase domain. The helicase domain in the context of full-length hDicer might operate differently. Nevertheless, previous structural studies of Dicer•pre-miRNA complexes are in favor of our results; they showed that the terminal loop of pre-miRNA (precisely, pre-mir-15a) binds to the helicase subdomains HEL2i and HEL2 [50].
Finally, binding assays involving dsRNA and dsDNA substrates were carried out. We analyzed binding to a 32-bp RNA or DNA duplex (blunt) and a 30-bp RNA or DNA duplex with a 2-nt 3ʹ overhang on each end (over). Thus, in total, we tested four types of substrates: dsRNA_blunt, dsRNA_over, dsDNA_blunt, and dsDNA_over. Double-stranded substrates (~ 2.5 nM) were incubated with HEL dilutions (2.97, 5.94, 11.86, 23.75, 47.5, 95 µM) at room temperature for 15 min. EMSA revealed no band-shifts for the tested sets; this indicated that HEL does not bind fully double-stranded nucleic acids (Additional file 1: Fig. S11).
Altogether, the results reveal that HEL can bind single-stranded RNAs and DNAs of ~ 20-nt and longer but it does not interact with fully paired dsRNA and dsDNA substrates (both blunt-ended and with a 2-nt 3ʹ overhang on each end). We also found that pre-miRNA substrates, which inherently contain partially double-stranded regions, do not form stable complexes with the stand-alone helicase domain of hDicer.
The hDicer helicase domain might influence the structure of the bound RNAThe results of the EMSA assay revealed weak binding between the ssRNA substrates (R21, R32, R42 and R56) and HEL at room temperature (Fig. 5a). To investigate whether ssRNAs binding to HEL might be improved in other temperature conditions, we carried out the binding assays at both 4 °C and 37 °C. Collected results showed that lowering the temperature from 25 °C to 4 °C did not cause substantial changes in ssRNA binding to HEL, still low abundant complexes were observed (Additional file 1: Fig. S12). However, in the case of the reactions carried out at 37 °C, we noticed a HEL-concentration-dependent loss of the main substrate form (the most intense band, corresponding to the dominant substrate form). This change was accompanied by an increase in quantity of the fast migrating conformers (Fig. 6a). We hypothesized that HEL might influence the structures of the interacting ssRNA substrates or trigger their degradation. To test these hypotheses, we analyzed the substrates and reaction products of the binding reactions by (i) comparative PAGE, under native and denaturing conditions, and (ii) circular dichroism spectroscopy (CD). All subsequent experiments were carried out using the R42 substrate and HEL.
Fig. 6
Interactions between RNAs and HEL. a EMSA with HEL and 5ʹ-32P-labeled RNA: R32 (32-nt), R42 (42-nt), R56 (56-nt) (2.5 nM). Increasing amounts of HEL (2.97, 5.94, 11.86, 23.75, 47.5, 95 µM) are represented by a triangle. Reaction mixtures were incubated at 37 °C for 15 min. C- indicates a control sample with no protein. b Native PAGE analysis of mixtures of 5ʹ-32P-labeled R42 (2.5 nM) and increasing amounts of HEL (5.94, 23.75, 95 µM). After a 15 min incubation at 37 °C, sodium dodecyl sulfate (SDS) to a final concentration of 1% was added to denature protein. C- indicates a control sample with no protein. + ATP indicates reaction mixtures with 1 mM ATP. -ATP indicates reaction mixtures without ATP. c Secondary structure of R42 generated using the RNAstructure Fold online tool (Mathews Lab) [51]. The free energy value expressed in kcal/mol is shown at the bottom. Nucleotides are numbered starting from the 5'-end. d EMSA with HEL and 5ʹ-32P-labeled (CU)21 (42-nt) (2.5 nM). Increasing amounts of HEL (2.97, 5.94, 11.86, 23.75, 47.5, 95 µM) are represented by a triangle. Reaction mixtures were incubated at 37 °C for 15 min. C- indicates a control sample with no protein
First, to test whether R42 can be degraded upon incubation with HEL at 37 °C, we separated the binding reaction mixtures, including R42 and HEL, under denaturing conditions (Additional file 1: Fig. S13). Our analysis revealed that R42 stayed intact even when the highest concentration of HEL was applied (95 µM). These results argue that R42 was not degraded when incubated with HEL. In the next binding assay we tested whether HEL can affect the R42’s structure. This time, after 15 min incubation of R42 with HEL, in the presence and absence of ATP, SDS was added to the reaction mixtures, to final concentration of 1%. SDS disrupts interactions between proteins and nucleic acids by denaturing the protein but leaving the nucleic acid structurally intact [34]; thus, under such conditions, different RNA conformers can be distinguished by PAGE. Native PAGE showed that under the applied reaction conditions with increasing HEL concentrations, the slower-migrating conformer of R42 gradually disappeared while faster-migrating conformers of R42 increased in intensity (Fig. 6b). The output of the assay did not depend on ATP. Altogether, the collected results suggested that HEL may influence the R42’s structure, and that this process is ATP-independent. A possible secondary structure of R42 was predicted using the RNA structure web server [51] (Fig. 6c). We noticed that the secondary structure of R42 contains double-stranded regions and, as indicated in Fig. S9 (Additional file 1: Fig. S9), substrates with extended double-stranded regions, such as pre-miRNAs, are poorly bound by HEL. We then hypothesized that HEL could efficiently bind unstructured RNAs. To test this hypothesis, we performed the HEL binding assay using a 42-mer composed of (CU)21 repeats. RNA composed of (CU) repeats, due to the lack of base-pairing potential of their bases, cannot form structures containing local double-stranded regions (nucleotide composition does not allow this RNA to adopt a compact structure). This time, with increased HEL concentration, we noticed clear distinct bands correlating to RNA•HEL complexes, and no appearance of the fast-migrating conformers (Fig. 6d). The same result we observed for a 42-mer composed of (AC)21 repeats (Additional file 1: Fig. S14). Similarly to (CU)21, (AC)21 cannot form structures containing local double-stranded regions.
Next, we used CD spectroscopy for further analysis of the effect of HEL on the R42 structure. CD spectroscopy is a simple optical technique that is most sensitive to the structural polymorphism of nucleic acids and proteins [52]. Since characteristic bands for nucleic acids and proteins are separated in the CD spectrum [53], an independent structural analysis of nucleic acids and proteins can be performed. Analyzing the shape of a CD spectrum provides information on the structure of a biomolecule [54]. In the experiment, R42 (28 µM) was incubated in a buffer solution (10 mM HEPES pH 8.0, 300 mM NaF) with or without HEL protein (28 µM). Alternatively, HEL (28 µM) was incubated in the buffer solution alone. A comparison of the shapes of the CD spectra, in a spectral range of 210 to 350 nm, is presented in Fig. 7a. The helicase domain of hDicer is mostly composed of alpha helices (Fig. 1c), secondary structures which typically give a negative peak at 222 nm [54]. The double-stranded helical regions of RNA give a positive peak at ~ 270 nm [54]. Our results confirmed that the CD spectrum of the HEL protein had a negative minimum value at 222 nm. In contrast, the CD spectrum of R42 alone (Fig. 7a) had a maximum value at ~ 270 nm, which is characteristic for dsRNA structures that can be found in R42 (Fig. 6c) [53]. The CD spectrum of the R42•HEL complex had a negative minimum value typical for a protein with a dominant alpha helical structure (at 222 nm); however, the maximum value for dsRNA, at ~ 270 nm, was flattened (Fig. 7a). This result may be due to interactions between HEL and R42 and structural rearrangements of R42 upon HEL binding, such as loss of double-stranded helical regions in R42.
Fig. 7
Circular dichroism (CD) analysis of R42, HEL, and the HEL•R42 complex. a Example CD spectra for: HEL (black), R42 (red), and the HEL•R42 complex (blue). Measurements were carried out at 15 °C. b CD thermal analysis at 222 nm for HEL (black) and the HEL•R42 complex (red). c CD thermal analysis at 270 nm for R42 (black) and the HEL•R42 complex (red)
Next, a thermal analysis was carried out to analyze the alpha-helical content in the HEL and R42•HEL samples (at 222 nm), and the dsRNA content in the R42 and R42•HEL samples (at 270 nm). For the HEL sample (Fig. 7b), thermal analysis was carried out at 222 nm. As the temperature increased (from 5 to 90 °C), an increase in peak intensity was observed. Moreover, two discontinuities were visible at ~ 30 °C and ~ 60 °C. These discontinuities are called “phase–transition temperatures” [55], and are associated with the structural changes that occur in a protein as the temperature increases. In other words, as the temperature increases, the secondary structure content of a protein decreases. For the R42•HEL complex (Fig. 7b, red dotted curve), the observed discontinuities were shifted towards higher temperatures (i.e., at 52 °C and 74 °C, respectively). This indicates that the structure of HEL stabilized after the R42 binding occurred.
To investigate the structural changes in R42, thermal analysis was carried out at 270 nm (Fig. 7c). In the case of the R42 sample, as the temperature increased, a decrease in peak intensity was observed, which was related to the melting of double-stranded structures within R42. Moreover, for the R42 sample (Fig. 7c, black dotted curve), two discontinuities were observed at 35 °C and 75 °C. For the R42•HEL complex (Fig. 7c, red dotted curve), the discontinuity at ~ 35 °C was barely visible, and the discontinuity observed at 75 °C, for R42 alone, shifted towards a lower temperature, 60 °C. Thus, the difference in phase transition temperatures between R42 alone and R42 complexed with HEL was 15 °C. A comparison of the experimental and theoretical thermodynamic data, examining to R42 and R42•HEL samples, can be found in Table S2 (Additional file 1: Table S2) [56]. The thermodynamic parameters revealed that the entropy and enthalpy values for the R42•HEL complex decreased by ~ 12% compared to the corresponding values for R42 alone. Collectively, these results imply that the structure of R42 shifted toward a more relaxed state (lower dsRNA content) upon HEL binding.
In summary, based on the collected data, it is possible to hypothesize that RNA binding by the hDicer helicase domain may relax the structure of the bound RNA molecule. This hypothesis is supported by the CD spectroscopy experiments showing that the structure of R42 in complex with HEL is more relaxed compared to the structure of R42 alone (Fig. 7). Moreover, binding assays demonstrate that RNAs, that cannot form structures containing local double-stranded regions, are preferred by the hDicer helicase domain (Fig. 6d and Additional file 1: Fig. S14). Indeed, RNAs that have the intrinsic potential to adopt secondary structures, such as RNA substrates that were used in our binding assay (Fig. 5a and Additional file 1: Fig. S15) [48], are weakly bound by HEL. We also assume that after release, a relaxed RNA may fold back and adopt the desired structure.
Comments (0)