Azoxymethane (AOM, A2853), dextran sulfate sodium (DSS), sodium carboxymethyl cellulose, citrate antigen retrieval solution (pH 6.0), paraffin (Leica Camera AG), anti-Ki67 antibody (ab15580, Abcam, USA), anti-ZO-1 (Abcam, USA), mouse anti-Occludin (CST, USA), and anti-Claudin (Abcam, USA), GSM-TH17 assay kit (RayBiotech), methanol (HPLC), acetonitrile (HPLC), formic acid (HPLC), 2-propanol, and 2-Chloro-L-Phenylalanine (≥ 98%).
Mouse Models of CAC and Combined Treatment with CWQ and PD-1 Inhibitor
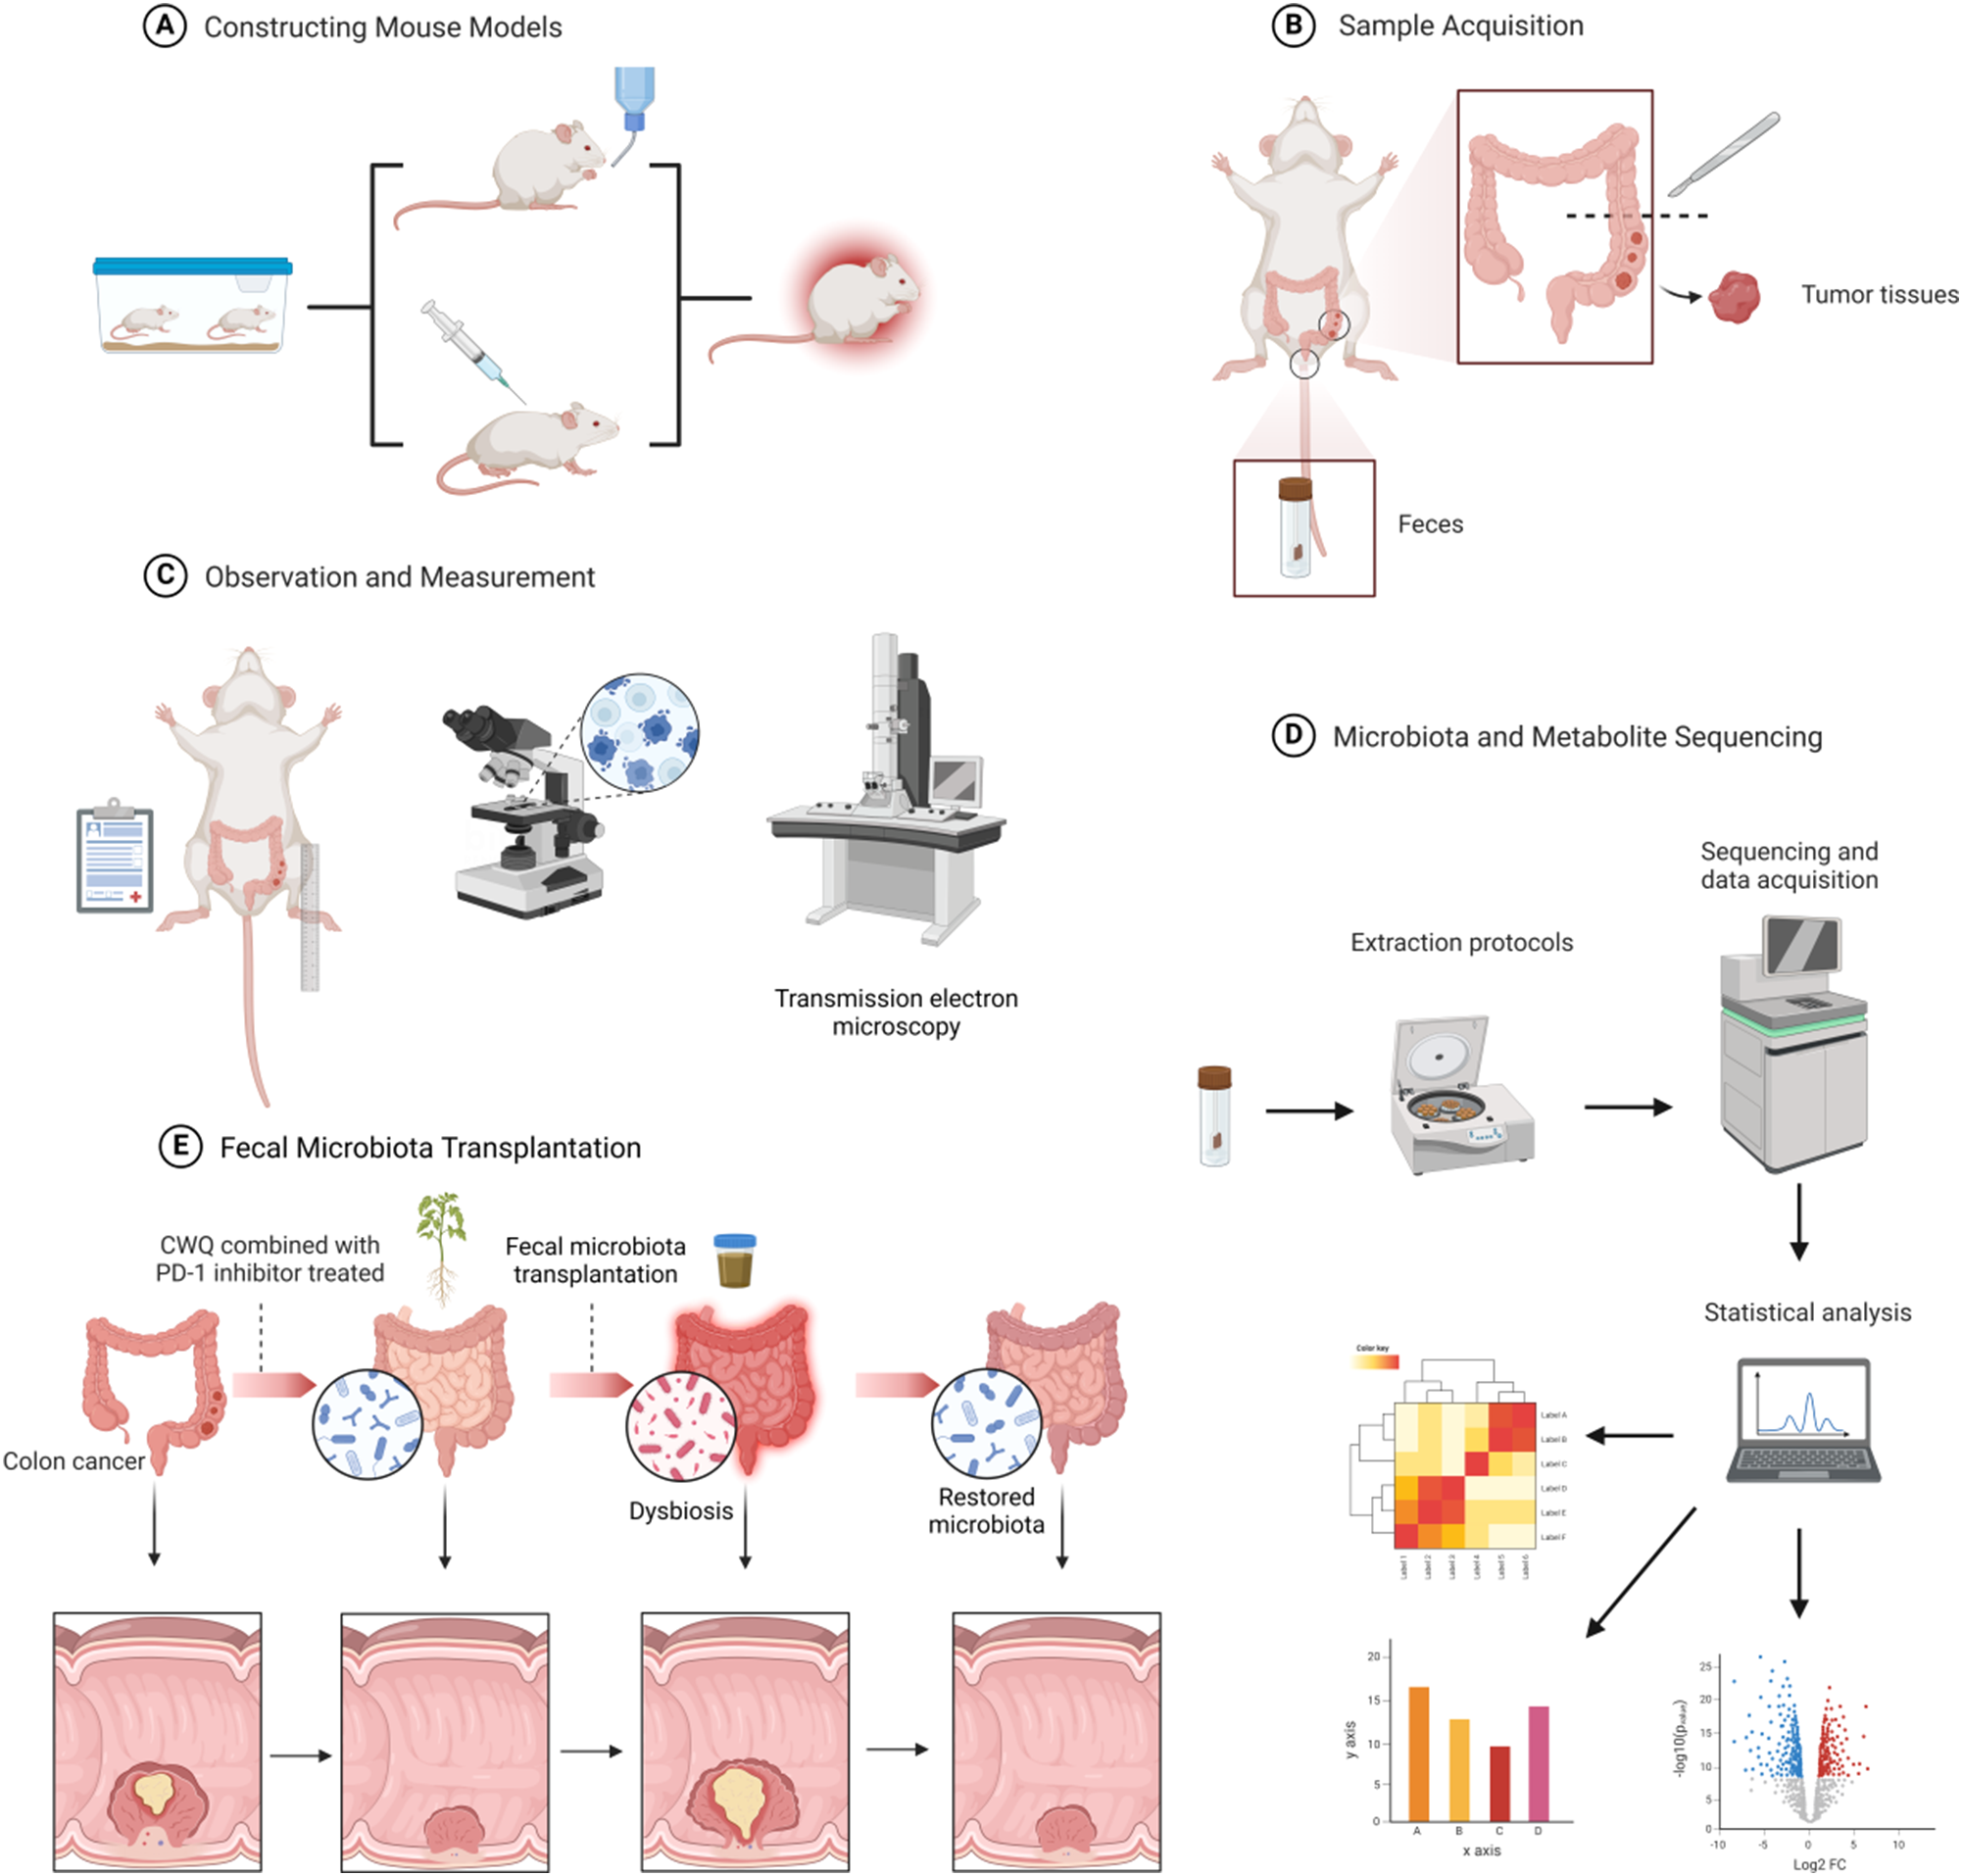
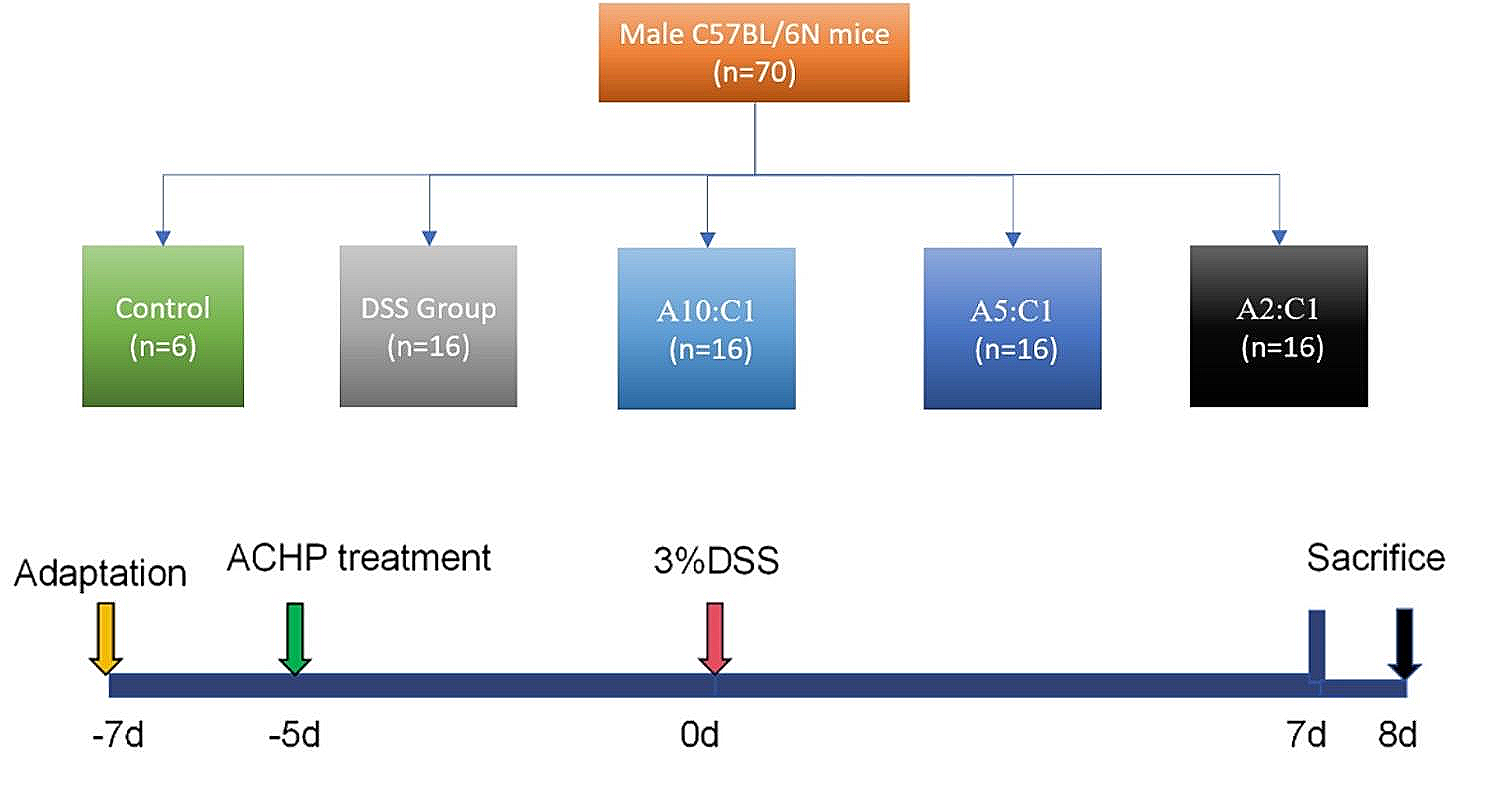
Specific-pathogen-free female C57BL/6 mice (5 weeks old, 17.0 ± 3.0 g, n = 30) were procured from Shanghai SLAC Laboratory Animal Co., acclimatized for a week, and then intraperitoneally injected with 12.5 mg/kg AOM to induce tumorigenesis. Subsequently, they underwent three cycles of DSS treatment to mimic CAC. Throughout each cycle, the mice were provided unrestricted access to drinking water containing 2.5% DSS for 7 days, followed by a subsequent 14-day period of regular water consumption (Fig. 2A).
The mice were randomly divided into four groups (n = 6 per group): the control group (received 0.2 mL normal saline i.g. and 0.1 mL normal saline i.v.), the CWQ group (received 0.2 mL CWQ i.g. and 0.1 mL normal saline i.v.), the PD-1 inhibitor group (received 0.1 mL of the PD-1 inhibitor i.v. and 0.2 mL normal saline i.g.), and the CWQ combined with PD-1 inhibitor group (received 0.2 mL CWQ i.g. and 0.1 mL of the PD-1 inhibitor i.v.).
CWQ was administered orally at a dose of 25.74 g/kg daily following AOM injection until the study endpoint, while the PD-1 inhibitor was given once every four days. The dosage of 25.74 g/kg was determined based on clinical prescription dosages for humans (198 g/70kg), taking into account the body surface area adjustment between humans and animals (198 g/70kg × 9.1 ≈ 25.74 g/kg).
The mice were euthanized at week 18 post the initial AOM injection, in accordance with the approved experimental protocol by the Animal Experimentation Ethics Committee of Shanghai University of TCM (approval number: DWEC-A-202206012).
Antibiotic-Treated Mice
Specific-pathogen-free female C57BL/6 mice (5 weeks old, weighing 17.0 ± 3.0 g, n = 24) were adaptively fed for a week after purchase. Their normal drinking water was then replaced with an ABX antibiotic mixed solution (1 g/L ampicillin, 1 g/L neomycin, 1 g/L metronidazole, 0.5 g/L vancomycin) for a period of 15 days (Fig. 2B). Mice weighing more than 16 g were selected, and the remaining steps were the same as those for the AOM/DSS-treated mice.
Fecal Microbiota Transplantation to Antibiotic-Treated Mice
Fecal samples were collected from donor mice on day 15, following a 14-day period of drug intervention. Fresh fecal samples were processed and the microbial suspension prepared within 24 h of collection. Twenty mice that met the weight criteria were randomly allocated into four groups (n = 5 per group). Each group received daily gavage with fecal samples from the control group, CWQ group, PD-1 inhibitor group, and CWQ combined with PD-1 inhibitor treated mice, respectively. Briefly, 1 g of stool samples was homogenized in 6.5 mL of PBS, and 200 µL of the suspension was gavaged per mouse. Subsequent procedures were carried out as outlined for conventional mice.
Drug Preparation
CWQ consists of 30 g Astragalus, 15 g Codonopsis, 15 g Atractylodes, 24 g Poria, 30 g Coix seed, 24 g Akebia trifoliata Koidz, 30 g Sargentodoxa cuneata, and 30 g Vitis quinquangularis Rehd. The eight herbal drugs’ doses were converted into granules at Tianjiang Pharmaceutical Co. Ltd. (Jiangyin, China), and dissolved in distilled water to achieve a concentration of 2.574 g/mL. These decoctions were stored at 4 °C. Additionally, the PD-1 inhibitor, procured from Xinda Biopharmaceutical Co. Ltd. (Suzhou, China), was dissolved in PBS to a concentration of 0.5 mg/mL and stored at 4℃.
Aspirin tablets were crushed into a fine powder using a mortar and pestle. A total of 150 mg of the powdered aspirin was accurately weighed using a microbalance and dissolved in 50.0 ml of a 0.5% carboxymethyl cellulose sodium solution, resulting in a 3.0 mg/ml aspirin solution. Each mouse was administered the aspirin solution via gavage at a dose of 0.01 ml per gram of body weight, which corresponds to a final dosage of 30.0 mg/kg.
Histopathology and Immunostaining
The intestinal tissue, positioned 4 cm above the anus, was excised from the mice. Approximately 1 cm of the dissected tissue underwent rinsing with ice-cold saline, fixation in 10% formalin, embedding in paraffin, sectioning, and subsequent staining with hematoxylin-eosin (H&E). Following dehydration via an ethanol gradient and xylene incubation, the samples were mounted for observation under a light microscope (Olympus, Tokyo, Japan).
For immunohistochemistry, the deparaffinized intestinal tissue sections underwent antigen retrieval through heating in 10 mM citrate buffer (pH 9.0) and treatment with 3% hydrogen peroxide. Mouse anti-ZO-1 (Abcam, USA), mouse anti-Occludin (CST, USA), and anti-Claudin (Abcam, USA) antibodies were used at dilutions of 1 : 500, 1 : 200, and 1 : 250, respectively. For Ki-67 immunohistochemistry in tumor tissues, the deparaffinized sections were processed in the same way as above. Anti-Ki-67 antibody (ab15580, Abcam, USA) was diluted and used. Subsequently, corresponding horseradish-peroxidase-conjugated secondary antibodies were applied for each, and the targeted antigens were visualized using 3,3’-diaminobenzidine tetrahydrochloride under a light microscope (Olympus, Tokyo, Japan).
16S rRNA Gene Sequencing of Fecal Bacteria
Fecal samples, obtained post-drug intervention from mice and preserved at -80 °C, underwent 16 S rRNA-gene sequencing. Total RNA extraction from these samples utilized TRIzol® Reagent following the manufacturer’s protocol. The RNA quality assessment was conducted using the 5300 Bioanalyzer (Agilent) and quantification was performed using the ND-2000 (NanoDrop Technologies). The V3-V4 hypervariable region of the bacterial 16 S rRNA gene was amplified using primer pairs 338 F and 806R in an ABI GeneAmp® 9700 polymerase chain reaction thermocycler (ABI, CA, USA). PCR conditions comprised an initial denaturation at 95 °C for 3 min, followed by 27 cycles of denaturation at 95 °C for 30 s, annealing at 55 °C for 30 s, extension at 72 °C for 45 s, and a final extension at 72 °C for 10 min, with a final hold at 4 °C. The PCR products were analyzed on a 2% agarose gel, and the corresponding amplicons were extracted using the AxyPrep DNA Gel Extraction Kit (Axygen Biosciences, CA, USA) and quantified using the Quantus™ Fluorometer (Promega, USA). These steps were performed in triplicate.
Subsequently, the purified amplicons were equimolarly pooled and subjected to paired-end sequencing on an Illumina MiSeq PE300 platform/NovaSeq PE250 platform (Illumina, San Diego, USA) by Majorbio Bio-Pharm Technology Co. Ltd. (Shanghai, China) following standard protocols. Operational taxonomic units (OTU) with a 97% similarity cutoff were clustered using UPARSE version 7.1, and chimeric sequences were identified and eliminated. The taxonomic classification of each OTU representative sequence was carried out using RDP Classifier version 2.2 against the 16 S rRNA database (e.g., Silva v138) with a confidence threshold of 0.7.
Metabolomic Profiling and Analysis
The sample (50 mg) underwent homogenization with a 6 mm diameter grinding bead and 400 µL of extraction solution (methanol: water = 4:1 (v/v)) containing 0.02 mg/mL of L-2-chlorophenylalanine internal standard. Homogenization was conducted using the Wonbio-96c frozen tissue grinder for 6 min at -10 °C and 50 Hz, followed by low-temperature ultrasonic extraction for 30 min at 5 °C and 40 kHz. Subsequent to centrifugation (15 min, 4 °C, 13000 g), the supernatant was transferred for LC-MS analysis. A pooled quality control sample was prepared by combining equal volumes of all samples and analyzed periodically (every 5 samples) to ensure analysis stability. LC-MS analysis was carried out using a Thermo UHPLC-Q Exactive system equipped with an ACQUITY HSS T3 column. The mobile phases consisted of 0.1% formic acid in water: acetonitrile (95:5, v/v) (solvent A) and 0.1% formic acid in acetonitrile: isopropanol: water (47.5:47.5, v/v) (solvent B). Positive and negative ion mode separation gradients were applied as specified. Data analysis utilized Progenesis QI software with database searches in HMDB (http://www.hmdb.ca/) and Metlin (https://metlin.scripps.edu/) for metabolite identification.
Transcriptomic Analysis of Tumor mRNA
Total RNA was extracted from tissue samples, with concentration and purity measured by the A260/280 ratio, and integrity checked via gel electrophoresis. Fragmentation of isolated mRNA in fragmentation buffer produced ~ 300 bp fragments, selected by magnetic beads. Following primer addition, reverse transcription generated single-strand cDNA, stabilized to double-strand at high temperatures. For sequencing, 15-cycle PCR amplification and agarose gel recovery of target bands preceded Illumina paired-end sequencing (2 × 150 bp). DNA from each sample was PCR-amplified for the 16 S rRNA V3-V4 region in triplicate. Purified PCR products underwent adapter ligation, magnetic bead selection to remove self-ligated fragments, and final PCR for library enrichment. High-throughput data underwent quality control, merging, and OTU clustering with UPARSE software, while 16 S functional predictions were analyzed using PICRUSt2.
Transmission Electron Microscopy (TEM) Sample Preparation and Imaging Protocol for Tissue Analysis
Fresh tissue samples are carefully selected to minimize mechanical damage, with sample sizes not exceeding 1 mm³. The tissues are fixed at 4 °C for 2–4 h in electron microscopy fixative and rinsed three times in 0.1 M phosphate buffer (PB, pH 7.4) for 15 min each. Post-fixation follows with 1% osmium tetroxide in PB at room temperature (20 °C) for 2 h, and the samples are rinsed again in PB. Dehydration is conducted through a graded ethanol series (50-100%) and acetone steps, each lasting 15 min. For infiltration, samples are exposed to acetone:812 resin mixtures in ratios of 1:1 for 2–4 h and 1:2 overnight, followed by pure resin infiltration for 5–8 h. Samples are embedded in pure 812 resin on embedding plates, then polymerized in a 60 °C oven for 48 h. Ultrathin Sects. (60–80 nm) are cut using an ultramicrotome and stained with uranyl acetate and lead citrate, each for 15 min, and dried overnight at room temperature. Observations and image analyses are performed with the transmission electron microscope.
Statistical Analysis
Statistical analysis was performed using SPSS 25.0 (IBM Corp., NY, USA). For normally distributed data, comparisons between two groups were conducted using t-tests, while one-way ANOVA was employed for comparisons involving more than two groups. Non-normally distributed data were assessed using rank-sum tests. The threshold for statistical significance was set at P < 0.05. Graphs were generated using GraphPad Prism 8 (GraphPad Software Inc., San Diego, USA).
Analysis of mouse gut microbiota data was executed on the Majorbio Cloud Platform (https://cloud.majorbio.com). Alpha diversity metrics including Chao and Shannon indices were computed using mothur software. Inter-group differences in alpha diversity were evaluated using the Wilcoxon rank-sum test. Principal coordinates analysis based on the Bray-Curtis distance algorithm was employed to assess the similarity of microbial community structures across samples. Additionally, non-parametric tests were utilized to detect significant differences in microbial community structures among sample groups. The linear discriminant analysis Effect Size (LDA > 2, P < 0.05) was utilized to pinpoint bacterial taxa with notable differences in abundance at various taxonomic levels.
To identify differential expression genes (DEGs) between samples, transcript expression levels were quantified using the TPM method and RSEM. Differential expression analysis was performed using DESeq2 or DEGseq, with DEGs meeting criteria |log2FC| ≥ 1 and FDR ≤ 0.05 (DESeq2) or FDR ≤ 0.001 (DEGseq) considered statistically significant. Functional enrichment analysis was conducted to identify pathways enriched with DEGs at Bonferroni-corrected P ≤ 0.05, using Goatools and KOBAS.
Metabolic features detected in at least 80% of samples were retained and normalized. Variables with RSD > 30% of QC samples were excluded, and log10 transformation was applied. Principal component analysis and orthogonal partial least squares discriminant analysis were performed using the “ropls” R package, with metabolites having VIP > 1 and P < 0.05 considered significant. Differential metabolites were mapped to biochemical pathways using the KEGG database for enrichment analysis, and pathway analysis was conducted using the Python package “scipy.stats”.


Comments (0)