
Remember me


This study included 85 patients with a mean age of 45.15 ± 13.14 years (range: 19–72 years). They were divided into the adult male group (43 cases), with a mean age of 43.33 ± 11.92 years (range: 19–72 years), and the adult female group (42 cases), with a mean age of 47.02 ± 14.18 years (range: 20–70 years). No significant differences in age or body mass index were found between the two groups (Table 1).
Table 1 Baseline characteristics in patients with acromagelyAccording to their medical history, 34 patients (40%) experienced headaches, 18 (21%) suffered from dizziness, 49 (58%) experienced visual impairment, and 62 (73%) exhibited facial and physical changes, including enlargement of the limb joints and fingertips, thickened lips, macroglossia, widened nasal bridge, protruding forehead, and deepening of voice. In addition, 26 (31%) had hypertension, 52 (61%) had dyslipidemia, 29 (34%) had diabetes mellitus, 43 (51%) had structural or functional cardiac abnormalities based on echocardiography, and 40 (48%) had nodular goiter based on thyroid ultrasound. According to surgical and imaging data, gross total resection (GTR) was achieved in 75 cases (88.24%) and subtotal resection (STR) in 10 cases (11.76%). Intraoperative cerebrospinal fluid leakage occurred in 21 cases (25%), with artificial dura mater patches used for repair in 16 of these cases (19%). Pituitary hemorrhage occurred in 7 cases (8%), and infarction in 1 case (1%). No cases (0%) of postoperative cerebrospinal fluid leakage were reported, but hyponatremia occurred in 18 cases (21%), central diabetes insipidus in 43 cases (51%), central nervous system infection in 1 case (1%), and sinusitis in 1 case (1%).
On the basis of radiological data, the mean tumor maximum diameter in the cohort was 21.39 ± 10.09 mm. In particular, 8 cases (9.41%) were microadenomas, 73 (84.71%) were macroadenomas, and 4 (4.71%) were giant adenomas. No significant differences were recorded between the 2 groups in terms of tumor size, Knosp grade, Hardy–Wilson grade, or Hardy–Wilson stage.
Immunohistochemical staining results showed that 54 patients (63.53%) exhibited positive staining for GH only, 26 (30.59%) showed positive staining for both GH and PRL, and 5 (5.88%) demonstrated positive staining for GH and multiple (≥2) hormones. No significant differences occurred in the immunohistochemical staining results between the two groups.
Preoperative and postoperative hormone level changesIn this study cohort, a significant decrease in GH levels was observed postoperatively (p < 0.001). Among them, 54 patients achieved the remission criteria for POD1GH levels, while 31 patients did not, with no statistically significant difference in the proportion of remission between sex (p = 0.296). Preoperative IGF-1 level data were available for 69 patients (81.18%), including 34 males (50.77%) and 35 females (49.23%), with no significant difference in preoperative IGF-1 levels between the two groups (p = 0.288).
Postoperatively, FT3 (p < 0.001), TT3 (p < 0.001), TSH (p < 0.001), and TT4 (p < 0.001) levels significantly decreased in male patients with acromegaly, while no significant changes were observed in FT4 (p = 0.171; p = 0.416) levels in both sexes and TT4 (p = 0.970) levels in females. COR (p = 0.005; p < 0.001) levels significantly increased postoperatively, while no significant change was observed in ACTH (p = 0.726; p = 0.945) levels (Table 2) (Fig. 1).
Table 2 Preoperative and postoperative hormonesFig. 1
The details of perioperative and postoperative hormone levels in male and female patients with acromegaly. *: p < 0.05; **: p < 0.01; ***: p < 0.001
Postoperatively, PRL levels decreased significantly in patients with acromegaly (p < 0.001), with no significant changes observed in FSH (p = 0.391; p = 0.412) levels, while LH levels increased significantly (p = 0.021; p = 0.051). Compared with the male patients, the female patients had significantly higher preoperative levels of PRL (p = 0.017), FSH (p = 0.034), and LH (p = 0.046), and lower levels of E2 preoperatively (p = 0.053) and postoperatively (p = 0.806), although these differences were not statistically significant. No significant differences were found in E2 levels preoperatively and postoperatively in females (p = 0.577), but postoperative E2 levels significantly decreased in male patients (p < 0.001). Postoperatively, TT levels significantly decreased in male patients (p < 0.001), but significantly increased in female patients (p = 0.018).
Correlation of tumor diameter, Knosp grade, and Hardy–Wilson classification with preoperative hormonesIn male patients with acromegaly, tumor maximum diameter was negatively correlated with preoperative FT4 (p = 0.010), FSH (p = 0.030), LH (p = 0.012) and TT (p = 0.015) levels. In addition, positive correlations were found between tumor maximum diameter and preoperative GH (p = 0.047) and PRL (p = 0.037) levels. Hardy–Wilson stage was negatively correlated with preoperative FSH (p = 0.005), LH (p = 0.013), and TT (p < 0.001) (Fig. 2).
Fig. 2
The correlations between the preoperative factors and the POD1GH level in male patients with acromegaly. *: p < 0.05; **: p < 0.01; ***: p < 0.001
In female patients with acromegaly, tumor maximum diameter was negatively correlated with preoperative FT4 (p = 0.002), FSH (p = 0.017), LH (p = 0.006), and FT3 (p = 0.017) levels. Hardy–Wilson stage was negatively correlated with preoperative FSH (p = 0.007), LH (p = 0.004) (Fig. 3).
Fig. 3
The correlations between the preoperative factors and the POD1GH level in female patients with acromegaly. *: p < 0.05; **: p < 0.01; ***: p < 0.001
No correlation was observed between preoperative hormone levels and Knosp grade in both patient groups.
Correlation between preoperative hormonesPreoperative GH was negatively correlated with LH (p = 0.032; p = 0.019) levels, but not correlated with FSH, FT3, FT4, TT3, TT4, COR, ACTH, TT, and E2 levels.
Correlation among age, preoperative hormones, tumor characteristics, and POD1GH levelsPatients with non-remission POD1GH levels were younger (p = 0.003) and had larger tumor diameter (p < 0.001), higher GH (p < 0.001), and lower FT3 (p < 0.001), TT3 (p = 0.004), TSH (p = 0.002), FSH (p < 0.001), and LH (p = 0.002) levels (Table 3).
Table 3 POD1GH level remission and clinical correlationsCorrelation analysis showed that in male patients, POD1GH levels were positively correlated with size (p = 0.037) and GH (p = 0.004) levels, but negatively correlated with age (p = 0.081) and FT3 (p < 0.001), TT3 (p < 0.001), TT4 (p = 0.034), TSH (p < 0.001), TT (p = 0.007), and LH (p = 0.024) levels. The correlation coefficient (r) between POD1GH levels and TT4 levels (r = −0.324) was considerably lower than those between POD1GH levels and FT3 (r = −0.549), TT3 (r = −0.503), and TSH (r = −0.531) levels. In female patients, POD1GH levels were positively correlated with size (p = 0.023), Hardy–Wilson stage (p = 0.045), GH (p = 0.040), PRL (p = 0.003), and E2 (p = 0.038) levels, but negatively correlated with age (p = 0.002), FT3 (p = 0.012), TT3 (p = 0.034), FSH (p = 0.002), and LH (p = 0.040) levels.
Multiple linear regression analysis revealed that size and preoperative GH, FT3, TT3, TSH, and TT were independent predictors of POD1GH levels in male patients (Fig. 4), while age, size, and preoperative GH, FT3, TT3, and PRL were independent predictors of POD1GH levels in female patients (Fig. 5). Multifactorial analysis indicated that preoperative GH (β = −0.149; 95% confidence interval [CI] = − 0.075, −0.01; p = 0.009), FT3 (β = −0.126; 95%CI = − 0.221, −0.030; p = 0.011), and TT (β = −0.075; 95%CI = − 0.149, −0.001; p = 0.048) were independent predictors of POD1GH levels in male patients, with higher preoperative GH levels or lower FT3 and TT levels associated with higher POD1GH levels in male patients. Preoperative GH (β = 0.005; 95%CI = 0.098, 0.019; p = 0.040), FT3 (β = −0.346; 95%CI = − 0.217, −0.070; p = 0.005), and PRL (β = 0.126; 95%CI = 0.018, 0.234; p = 0.023) levels were independent predictors of POD1GH levels in female patients, with higher preoperative GH levels or lower FT3 and PRL levels associated with higher POD1GH levels in female patients.
Fig. 4
The linear regression analyses of POD1GH level in male patients with acromegaly
Fig. 5
The linear regression analyses of POD1GH level in female patients with acromegaly
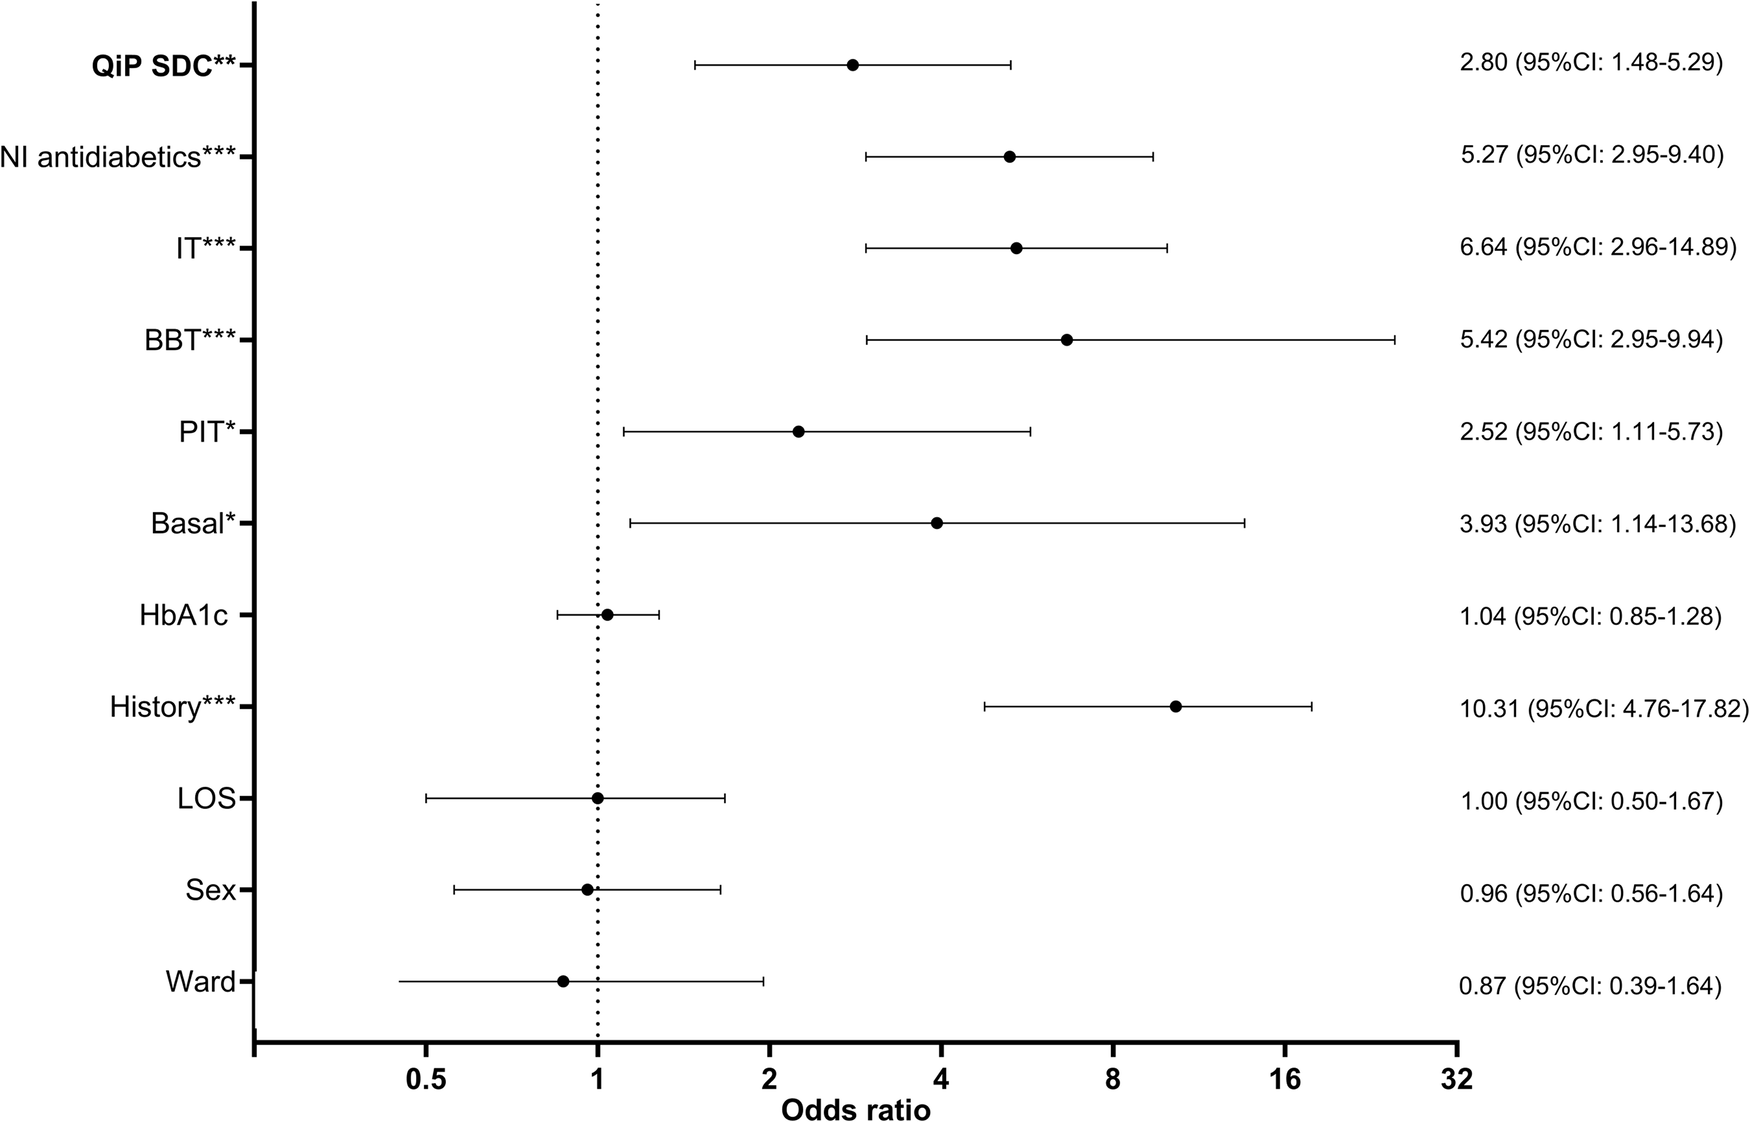
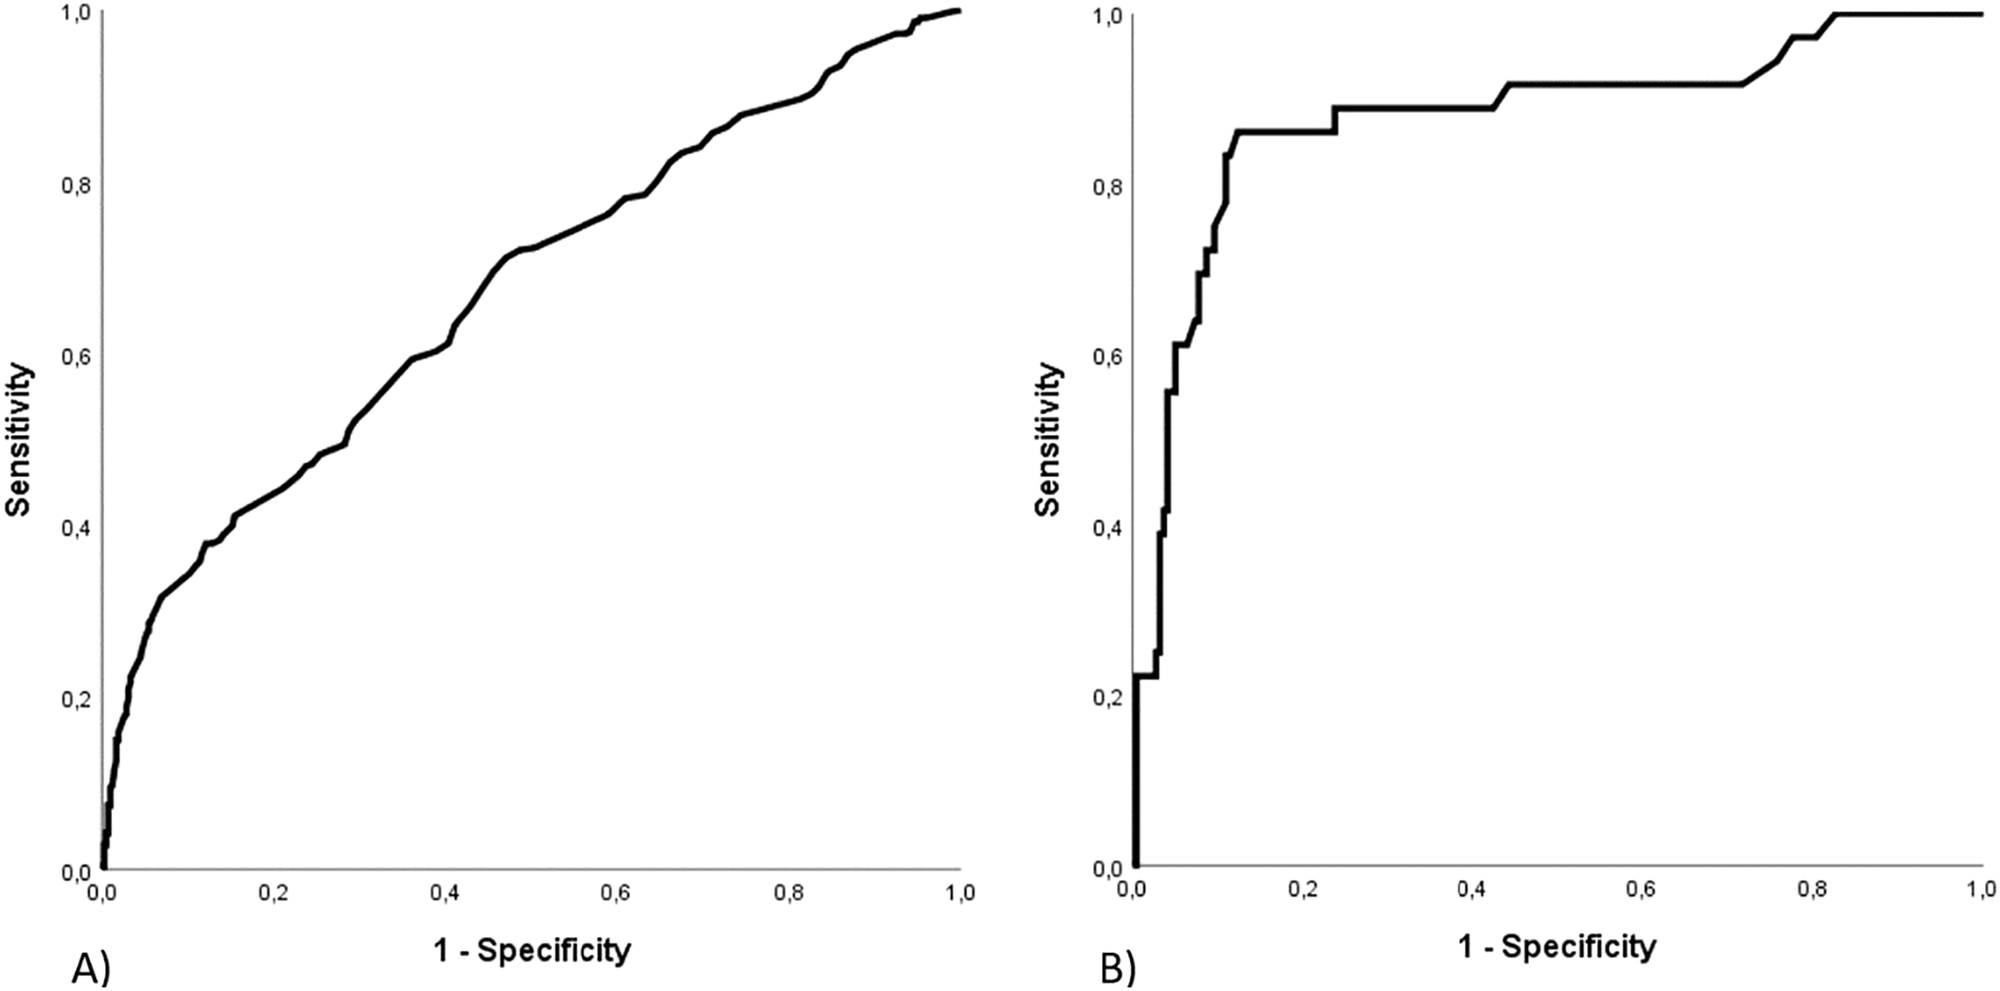
Some acromegaly patients may experience delayed remission after surgery. To maximize specificity in identifying cases without remission, this study used a cut-off value of 2.5 ng/mL to distinguish between remission and non-remission, followed by binary logistic regression analysis. The univariate analysis results showed that age, size, and preoperative GH, FT3, TT3, FSH, and LH levels were predictors of POD1GH level non-remission (Fig. 6). The multivariate analysis results revealed that preoperative GH (OR = 2.236, 95%CI = 1.402–3.567, p < 0.001) and FT3 (OR = 0.329, 95%CI = 0.167–0.648, p < 0.001) levels, and age (OR = 0.566, 95%CI = 0.352–0.911, p = 0.019) were independent predictors of POD1GH level non-remission. The ROC analysis (Fig. 7) demonstrated that preoperative GH levels ≥30.25 ng/mL (AUC = 0.754), FT3 levels ≤4.415 pmol/L (AUC = 0.725), and age ≤51 years (AUC = 0.701) can predict POD1GH level non-remission.
Fig. 6
The logistic regression analyses of POD1GH level in patients with acromegaly
Fig. 7
Performance of ROC curve analysis for predicting POD1GH level non-remission
Comments (0)