
Remember me
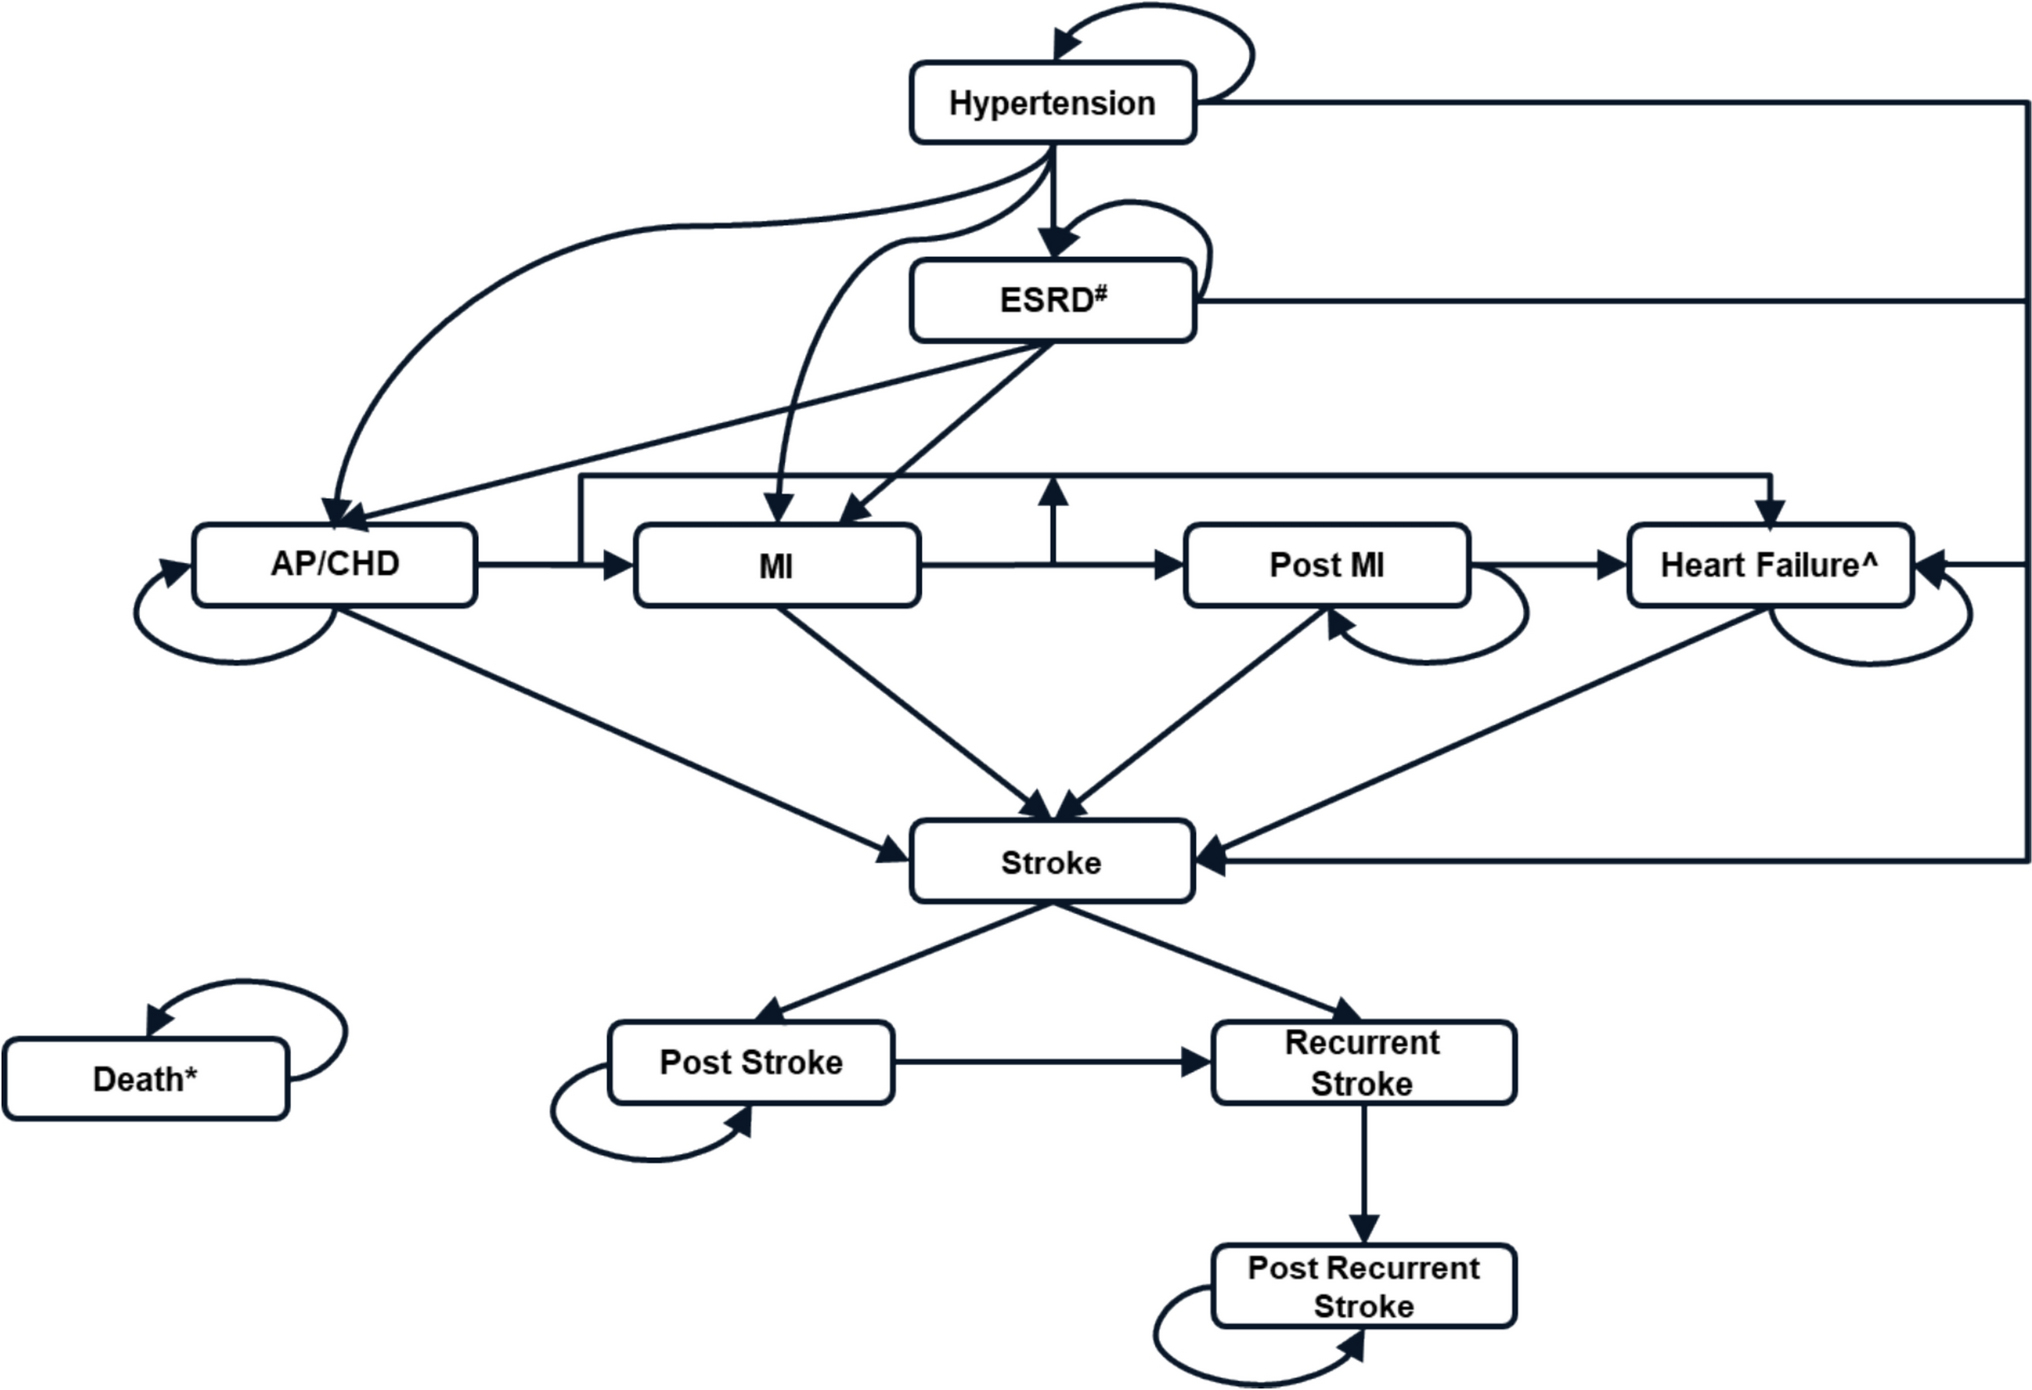
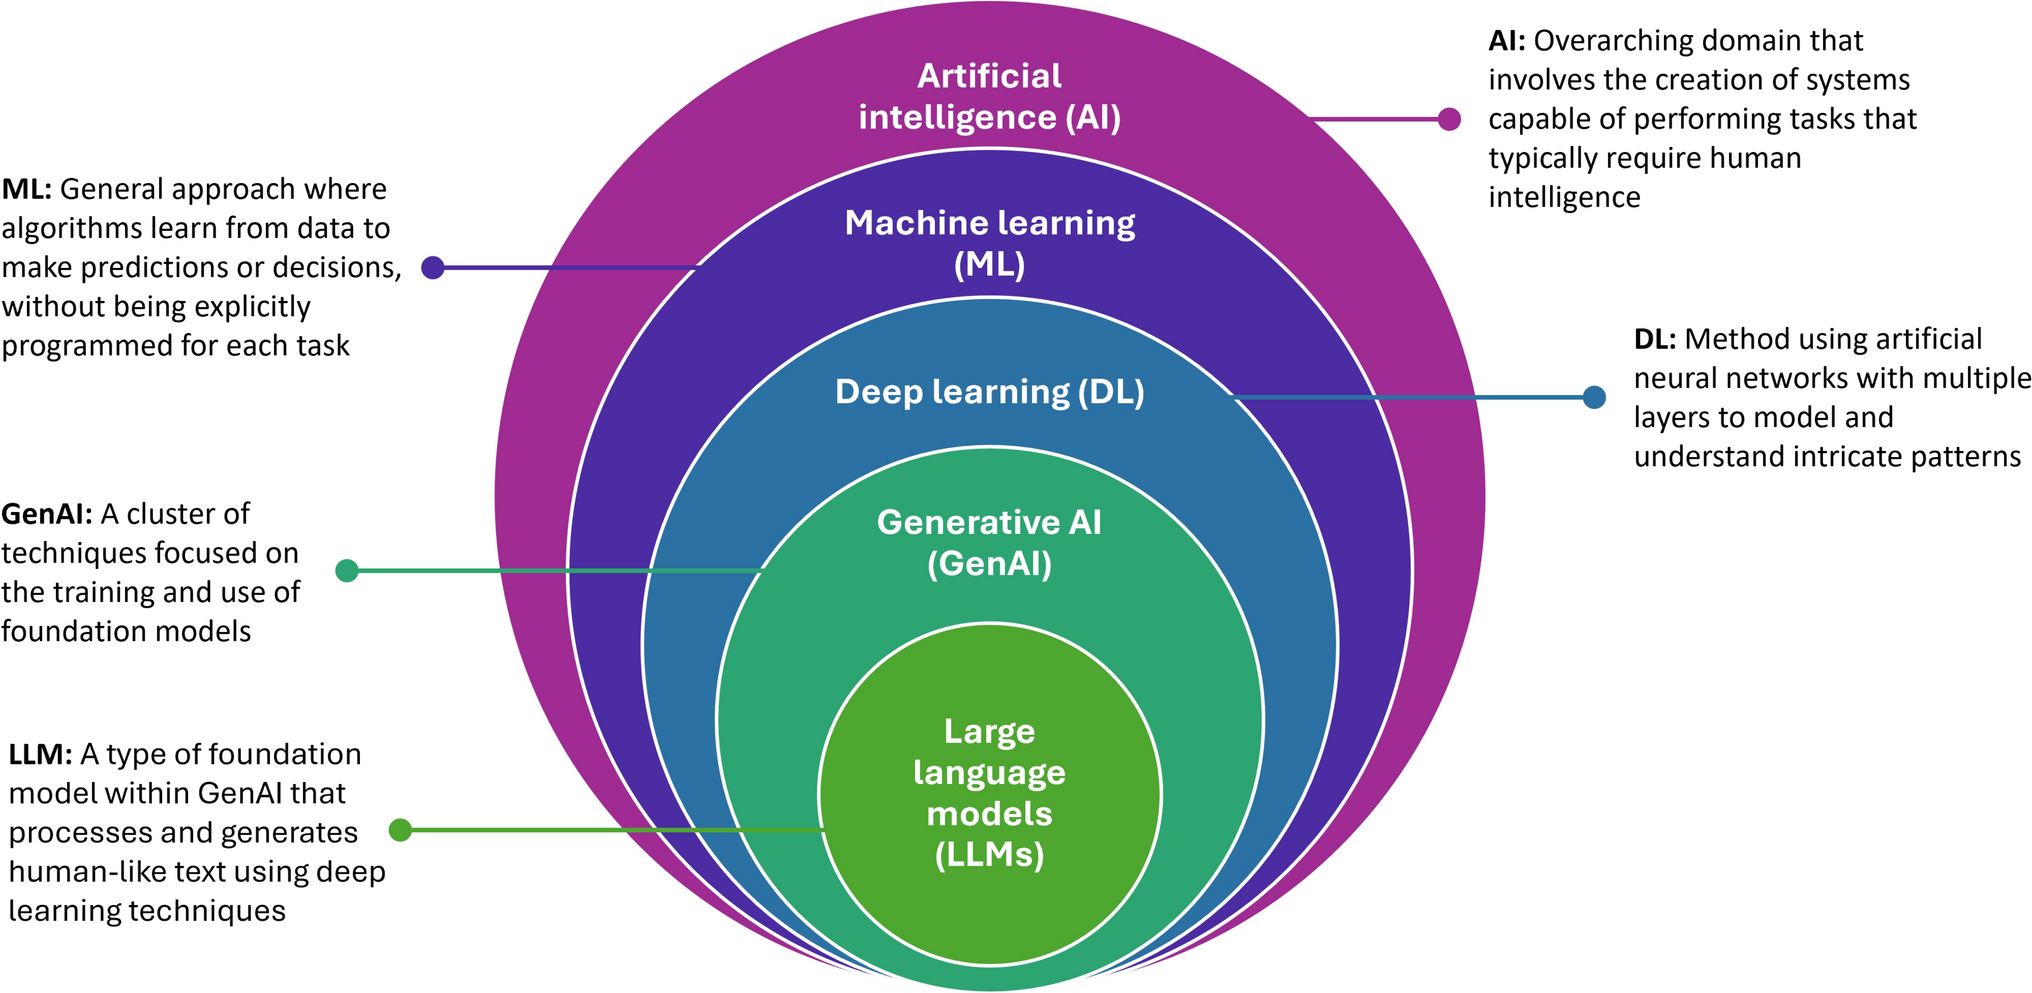
This study used patient-reported data from a digital symptoms surveillance survey conducted by the University of Oxford and the Royal College of General Practitioner’s Research and Surveillance Centre in collaboration with EMIS Health, a major primary care computerised medical record system supplier in the UK [23]. A second edition of the survey, which ran between July and December 2020 in 10 regions across the UK, collected 11,534 responses amenable to a costing analysis and was used for this study. This was after the first COVID-19 wave, during an increase in cases and the second wave of the pandemic in Autumn 2020. Figure 1 provides contextual information on national COVID-19 cases by specimen date before, during and after the data collection period. Participants aged 16 years and above were recruited via the EMIS-run Patient Access website and app, a digital primary health care service tool used in the UK to obtain health-related information and to book general practice visits. The survey collected patient-level information on COVID-19 related status, health and social care resource use, employment status and productivity changes, sociodemographic data, and data on patient health conditions and comorbidities. The survey was piloted to ascertain its acceptability to patients and patient comprehension of its constituent modules [23].
Fig. 1
Source : GOV.UK [70]
COVID-19 cases by specimen date. (The red rectangle highlights the data collection period.).
2.2 COVID-19-Related StatusThe survey included a series of questions aimed at ascertaining information on participants’ COVID-19-related status. COVID-19-related self-reported status was delineated in terms of participants’ current health state and past health state. Symptoms-based COVID-19 conditions were identified as the combined presence or otherwise of anosmia (loss of smell or taste) with either high fever, a new continuous cough, or breathlessness, following the literature and the classification used in previous studies, including our own [24,25,26]. Respondents who reported as having had no COVID-19-related or any other symptoms at the time of the survey or previous COVID-19-related illness episodes were defined as healthy. Symptoms-based information on the time between the most recent COVID-19 related illness episode and respondents’ health status during the survey completion was used to refine the definition. COVID-19 symptom-based status was further categorised as ‘onset of COVID-19 symptoms in the past 3 months’ and ‘onset of COVID-19 symptoms more than 3 months ago’, to align with the recall period of 3 months adopted for the resource use and costing questions.
Additionally, we used another measure, based on self-reported COVID-19 test results within a 14-day window (accounting for the COVID-19 incubation period [34]), defined as a binary variable with a value equal to zero if respondents had a negative test result and no symptoms, and equal to one if respondents had a positive test result and high fever/new continuous cough/breathlessness. This definition excludes both asymptomatic individuals with positive test results and those with symptoms but negative test results. This definition is in line with that applied within sensitivity analyses in our previous research [26]. In this study, COVID-19 tests include the following: sputum test, nose/throat swab, traditional blood test, or a finger prick test.
2.3 Costing Methodology2.3.1 OverviewThis study employed a cost-of-illness methodology. A retrospective assessment of economic costs incurred during the 3-month period that preceded the completion of the survey was implemented in this study. The estimation of costs followed a standard micro costing approach [27]. This approach assigns a weight to each service used (resource use). This weight reflects the opportunity cost, or ‘price’, of the service (unit cost). In other words, we multiplied the number of times each service was used by its unit cost to calculate the total cost for each service.
The value of productivity loss was estimated as a product of lost working days and daily wage estimated from individual annual income, using survey data collected specifically for this study. Productivity losses related to presenteeism (i.e. working with reduced productivity due to illness or another medical condition) were not considered in this study owing to measurement limitations. The steps for estimating economic costs, namely measurement and valuation of resource use, are described below.
2.3.2 Measurement of Resource ConsequencesThe survey data provided detailed information about the following health and social service use and other categories of resource use and expenses attributable to COVID-19 during the previous 3 months, as the purpose of this study was to estimate health and social care costs and, separately, societal costs over a retrospective 3-month period:
1.Use of hospital outpatient and accident and emergency services
2.Hospital inpatient stays
3.Use of primary care, community health services, and social services
4.Additional expenses incurred by participants
5.Duration and type of work absences; self-reported income losses
Data about participants’ service use and expenses included information on the number of times they had used the following services during the previous 3 months: (i) hospital outpatient services, including contacts with accident and emergency departments, psychologists, psychiatrists, physiotherapists and other specialists; (ii) hospital inpatient stays by type and duration; and (iii) primary care services and community health and social services such as local pharmacists, ambulance services, NHS 111, social workers, community nurses, practice nurses, occupational therapists, physiotherapists, psychiatrists, psychologists, home carers, general practice services and health visitors. The survey also collected information about medication use, including both prescribed medicines and over-the-counter purchases of medicines. Further information included additional COVID-19-related expenses incurred by participants resulting from technical equipment for remote working, grocery delivery services, accommodation expenses for social isolation, protective gear, expenses incurred for caring for children and relatives, home-schooling, and duration of work absences (in days) by work type and self-reported income.
With respect to work and productivity, the survey collected information on employment status (worked fully from home, worked partly from home, partly on site, employer cut hours, lost job and not found another one, lost job and found another one, temporarily closed business or activity, permanently closed business or activity, using sick leave, been absent from work, laid-off temporarily or furloughed), lost working days, lost wage, occupation group (managers, directors and senior officials, professional occupations, associate professional and technical occupations, administrative and secretarial occupations, skilled trades occupations, caring, leisure and other service occupations, sales and customer service occupations, process, plant and machine operatives, elementary occupations) and levels of government support (e.g. universal credit, statutory sick pay, employment support allowance, job seeker allowance, payments for furloughed staff).
2.3.3 Valuation of Resource ConsequencesUnit costs were mostly obtained from the Personal Social Services Research Unit’s (PSSRU) Unit Costs of Health and Social Care compendium [28] and NHS reference costs [29]. Additional sources were searched for unit costs not covered by the PSSRU reports [30] and NHS reference cost schedules. Unit costs were converted to the reference year of 2022, the latest year for which price indices were available at the beginning of this study, using the NHS Hospital and Community Health Services (HCHS) Pay and Prices Index [31]. The value of technical equipment provided was annuitised to reflect depreciation and then adjusted to a 3-month time interval to align with the survey’s 3-month data recall period. Table 1 presents the unit costs used to value resource inputs. Per diem intensive care had the highest unit cost (£874.8), while a food delivery service had the lowest unit cost (£3.50, per delivery, excluding food).
Table 1 Unit costs of resource use items (£ sterling, 2022 prices)The value of lost productivity was estimated using the ‘human capital approach’, which values lost productivity in terms of reduced amount of working time due to illness [32]. The self-reported total number of lost working days was multiplied by the average daily salary for each participant, obtained from the survey [33]. It should be noted that the loss of income to employees was generally less than the value of their lost productivity owing to receiving government support including the furlough scheme.
2.3.4 Total Economic CostsWe estimated and analysed two categories of total economic cost outcomes: (i) NHS and personal social services (PSS) costs and (ii) societal costs. NHS and PSS costs included community health and social care costs, inpatient care costs, outpatient care and accident and emergency service costs, and medication costs. Societal costs encompassed all NHS and PSS costs and other relevant economic consequences, irrespective of the identity of the cost bearer [34]. These included NHS and PSS costs, costs directly borne by participants including technical equipment for remote working, grocery delivery services, accommodation expenses for social isolation and protective gear, and values of productivity losses. The value of social security benefits received was excluded from estimates of societal costs to avoid double counting with the value of lost productivity.
2.4 CovariatesCovariates controlled for in the multivariate regressions were selected on the basis of published evidence [26]. The multivariate regressions included the following covariates: gender (male (referent), female), age (years) (16–30 (referent), 31–55, 56–65, above 65), ethnicity (white (referent), non-white), employment status (not employed (referent), employed), comorbidity status (no comorbidity (referent), comorbidity), presence of risky condition (no risky condition (referent), risky condition), lockdown status at time of survey completion (no lockdown (referent), lockdown), education status (below undergraduate (referent), undergraduate, above undergraduate) region (Scotland, Northern Ireland, North East, North West, East Midlands, West Midlands, Wales, South West, South East, Greater London) and month of survey completion (January–December). Considering the UK state pension age of 66 years [35] and the minimum recruitment age into the survey of 16 years, we categorised the age groups into four categories: 16–30, 31–55, 56–65, above 65. Comorbidity status was categorised as presence or otherwise of any comorbid or chronic health condition. Comorbidities included the following diseases: lung disease such as asthma or chronic obstructive pulmonary disease (COPD), heart disease, chronic kidney disease, liver disease, nervous system conditions, diabetes, problems with spleen, a weakened immune system such as being on long-term steroid tablets or acquired immunodeficiency syndrome (AIDS), or seriously overweight (body mass index (BMI) ≥ 40). A risky pre-existing health condition (in the context of COVID-19) included organ transplant, pregnancy with heart disease, lung cancer with ongoing radiotherapy, blood or bone marrow cancer, cancer with ongoing chemo/immunotherapy, taking medication that weakens the immune system, sickle cell disease, cystic fibrosis or severe asthma/COPD, motor neuron disease, and patients asked to shield/self-isolate by the NHS. Lockdown status was defined by the periods of lockdown under the government-specified tier 3 (very high alert) and tier 4 (stay at home) restrictions (e.g. no mixing of households; hospitality closure; highly restricted travel), versus periods without such restrictions. Region and month variables were used as fixed-effect dummy variables in the regression analyses.
2.5 Econometric AnalysisThis study used two multivariable regression modelling approaches to explore the association between COVID-19 illness status and individual characteristics and (1) total NHS and PSS costs and (2) total societal costs: generalised linear modelling (GLM) and two-part models. GLM regression is recommended for dealing with skewness in the distribution of outcome variables [36, 37], which is typically the case with cost data. Model specifications and goodness of fit were checked with a modified park test [36] and Akaike information criterion (AIC) statistics [38]. On the basis of these tests, a gamma distribution family and a log link were selected for this study. In addition, two-part regression is widely used for analysing economic costs in the presence of a significant proportion of zero-cost observations. Logit was used to specify the model for the first binary part, whilst GLM with a gamma family and logit link was used to specify the distributional family and link function for the second part [39]. Sampling weights were computed using sex and age population counts in the UK in 2020 and applied to the regression models to improve the representativeness of the study population. The values for age and gender that generated sampling weights were obtained from the Office of National Statistics (ONS) [40]. We also conducted a sensitivity analysis that included interaction terms for (1) age ≥ 66 years and symptoms in the last 3 months and (2) female gender and symptoms in the last 3 months, to examine the interaction between COVID status and its potential correlates. All analyses were conducted using STATA 17 (Stata-Corp, College Station, TX).
Comments (0)