Patients
This prospective study included 40 inpatients at the Department of Oncology of Mianyang Central Hospital affiliated to the School of Medicine, University of Electronic Science and Technology of China, from March 2023 to April 2023. There were 23 males and 17 females aged 48–77 years (mean age: 64.15 ± 8.68 years). According to the ICD-11 disease classification, this study included 6, 6, 4, 4, 4, 4, 4, 3, 3, and 2 cases of cervical, gastric, esophageal, lung, liver, ovarian, nasopharynx, rectal, duodenal, and breast cancer, respectively. All patients received placement of single-lumen PICC manufactured by Bard Access Systems, INC. The specifications of the PICC were 4.0 F (1.40 mm OD) × 60 cm, with a dead space volume of 0.48 mL.
Blood Sample Collection
Blood samples were collected sequentially in the morning from all patients in a fasting state. The samples were collected from their PICC lines and peripheral veins by one designated phlebotomists, strictly following aseptic conditions to ensure sterility. All patients were in supine position. Blood was collected from the PICC line after a cessation of infusion for at least 3 h. Using a 10-mL syringe without a needle, 2.0 mL of venous blood was withdrawn from the PICC catheter interface. This blood was then transferred into a disposable vacuum blood collection tube containing EDTA-2 K anticoagulant (BD, USA; PICC0 sample). Another 10-mL syringe without a needle was used to draw additional 2.0 mL of venous blood, which was subsequently transferred into a separate vacuum blood collection tube containing EDTA-2 K anticoagulant (PICC1 sample). The PICC puncture site was then disinfected, and the catheter was flushed and sealed as per the standardized procedure Peripheral venous blood was collected immediately after the blood collection from the PICC line. Using the vacuum collection system, 2.0 mL of venous blood was drawn from the median cubital vein of the contralateral arm. This blood was placed into a third disposable vacuum blood collection tube containing EDTA-2 K anticoagulant to serve as the reference peripheral blood control.
Complete Blood Count
CBC was performed using a Sysmex XN-9000 blood cell analyzer (Sysmex, JPN) within 2 h of sampling. Leukocyte and its differential count was determined using hydrodynamic focusing and flow cytometry, respectively. The direct current sheath flow detection method was used to assess erythrocyte and platelet counts. Hematocrit and plateletcrit were analyzed using the cumulative pulse height method. Hemoglobin was detected using the sodium dodecyl sulfate colorimetric assay. Erythrocyte and platelet parameters, including mean corpuscular volume (MCV), mean corpuscular hemoglobin (MCH), mean corpuscular hemoglobin concentration (MCHC), red cell distribution width-standard deviation (RDW-SD), red cell distribution width-coefficient of variation (RDW-CV), mean platelet volume (MPV), platelet distribution width (PDW), and platelet larger cell ratio (P-LCR), were automatically calculated or derived from the above test results by the instrument.
Consistency Analysis of the Test Results Between Blood Samples Collected from PICCs and the Peripheral Vein
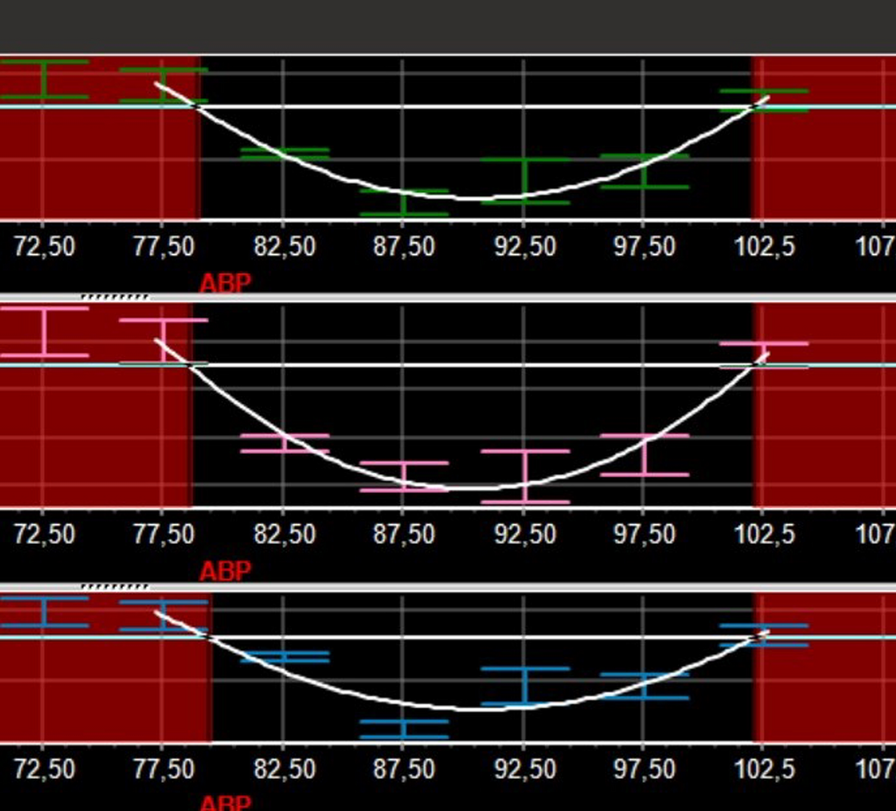
Using reference peripheral blood as a baseline, paired t-tests were used to identify differences in various parameters of the complete blood cell count. Subsequently, a Mountain plot was used to visually depict the extent of differences between the two samples obtained sequentially from the PICC line. Finally, a Passing and Bablok regression analysis was performed to discern the sources of deviations in the differing parameters. The paired t-test provides a more rigorous test of consistency than the independent t-test and correlation analysis [11, 12]. The Mountain plot provides a visual representation of the central tendency and dispersion of the deviations [13]. The degree to which the peak value deviated from 0 illustrated the magnitude of the median deviation (i.e., central tendency), while the width of the base indicated the degree of dispersion of the deviation. Passing and Bablok regression analysis is used to determine the magnitude of systematic bias, proportional bias, and random error [14]. If the 95% confidence interval (CI) of the intercept of the regression curve excluded 0, a systematic bias was indicated. If the 95% CI of the slope of the regression curve excluded 1, a proportional bias was indicated. Concurrently, the residual standard deviation (RSD) reflects the magnitude of random error.
Analysis of the Clinical Acceptability of the Test Results in Blood Samples Collected from PICCs and Peripheral Veins
Based the industry standard “Guidelines of venous blood specimen collection” by the National Health Commission (NHC) of China, the laboratory results from unmatched testing systems were used for comparability analysis; additionally, TEa-based accuracy assessment was adopted to analyze the clinical acceptability of blood collected from PICCs. The guidelines for comparability of laboratory results for unmatched testing systems recommend including 40 paired samples. According to the TEa criteria, for the 40 paired test samples, when the relative deviation of the test results between the measurement system and the reference system was: (i) < ± 1/2 TEa, the deviation of the measurement system was within the lowest control range; (ii) < ± 1/3 TEa, it was within the favorable control range; and (iii) < ± 1/4 TEa, it was within the optimal control range. If > 80% of the data had a relative deviation of < ± 1/2 TEa, the results of the assay system were deemed clinically acceptable. The TEa criteria were derived from the specifications by NHC, with the TEa being 6.0%, 7%, 8%, 9%, 15%, and 20% for both erythrocyte and hemoglobin, both MCV and MCH, MCHC, hematocrit, leukocyte, and platelet, respectively.
Statistical Analysis
SPSS 22.0 (SPSS Inc., Chicago, IL, USA) and MedCalc 20.1 (MedCalc, Mariakerke, Belgium) software packages were used for the statistical analysis. All test data were determined to be normally or approximately normally distributed through the one-sample Kolmogorov–Smirmov test and Q–Q plot. The test data are presented as mean ± standard deviation. Paired t-tests were performed to analyze the result differences between the PICC samples and reference peripheral bloods. The result concordances between the PICC samples and reference peripheral bloods were compared using a Mountain plot analysis. Passing and Bablok regression analysis was performed to determine the proportional bias, systematic bias, and random error. The magnitude of deviation, the dispersion degree of the deviation, and proportional and systematic bias were indicated as mentioned previously. A Bland–Altman plot was constructed using the test results of the reference peripheral blood as the horizontal axis, and the relative deviation of the test results obtained from blood sample at the PICC insertion site compared to the reference peripheral blood test results as the vertical axis. To determine the clinical acceptability based on the TEa, ± 1/2 TEa line was drawn on the Bland–Altman plot to observe the rate of data falling outside the ± 1/2 TEa line. A test level of α = 0.05 was adopted.


Comments (0)