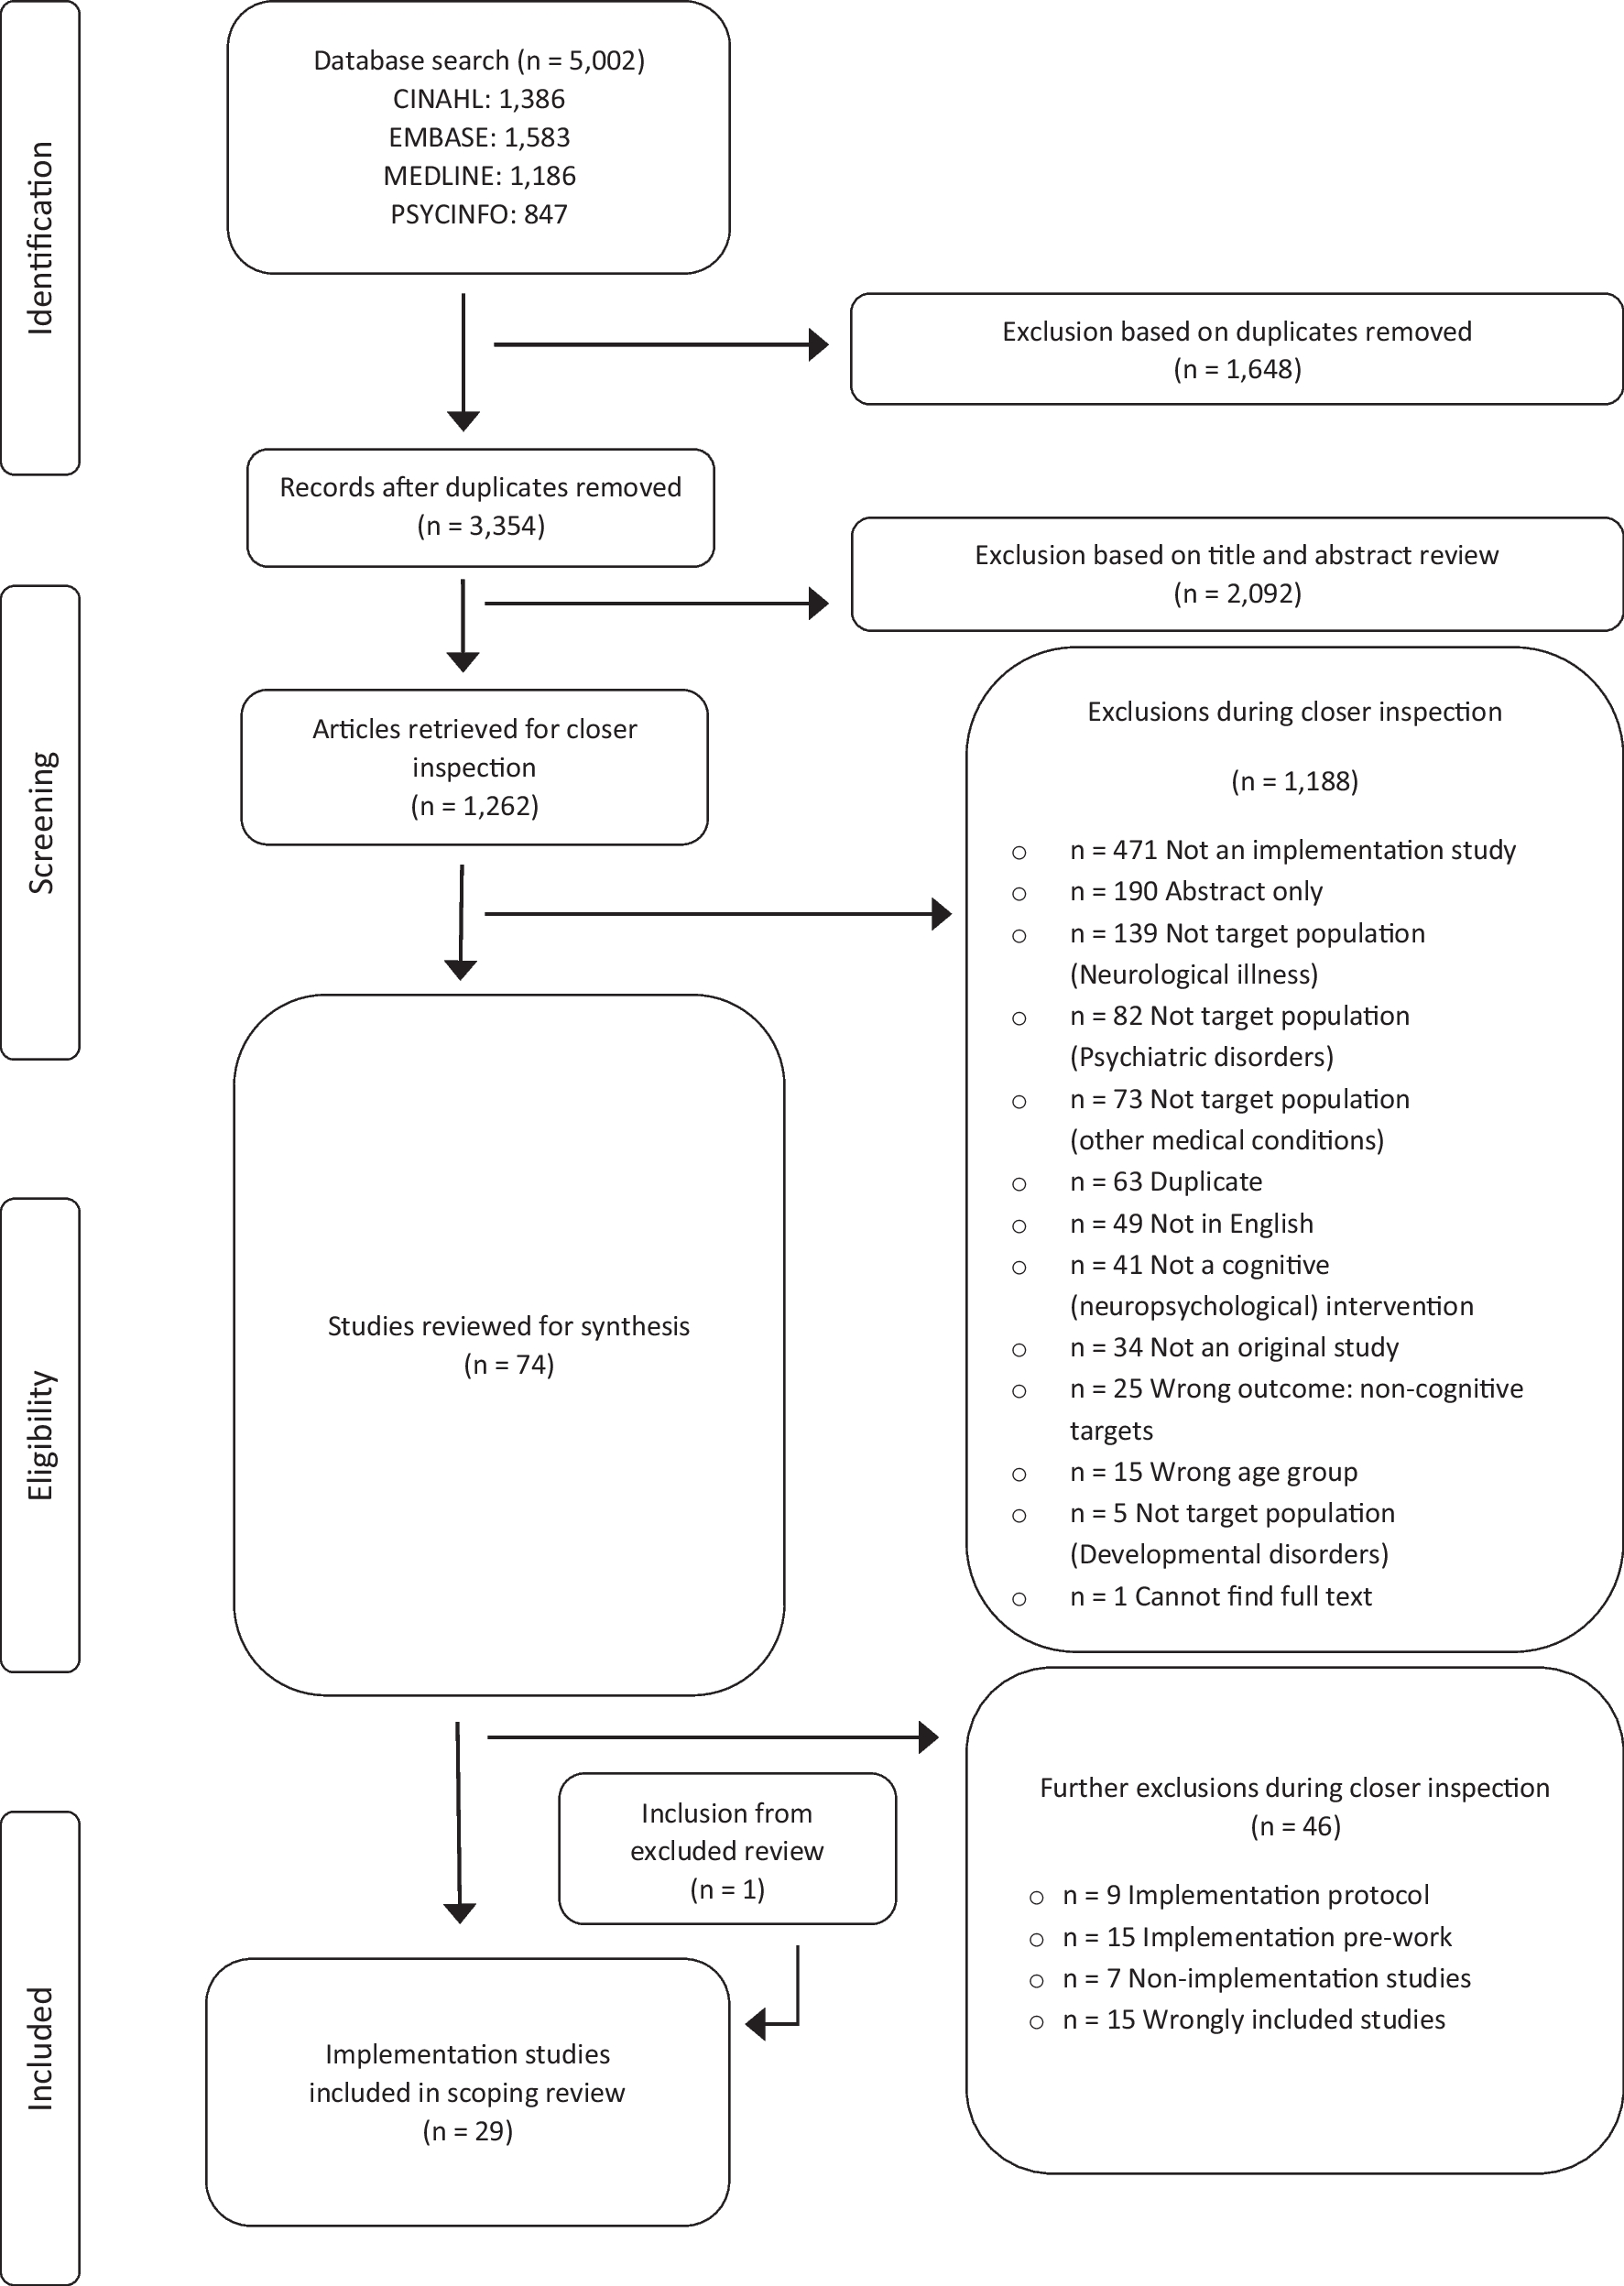
Selection of Studies
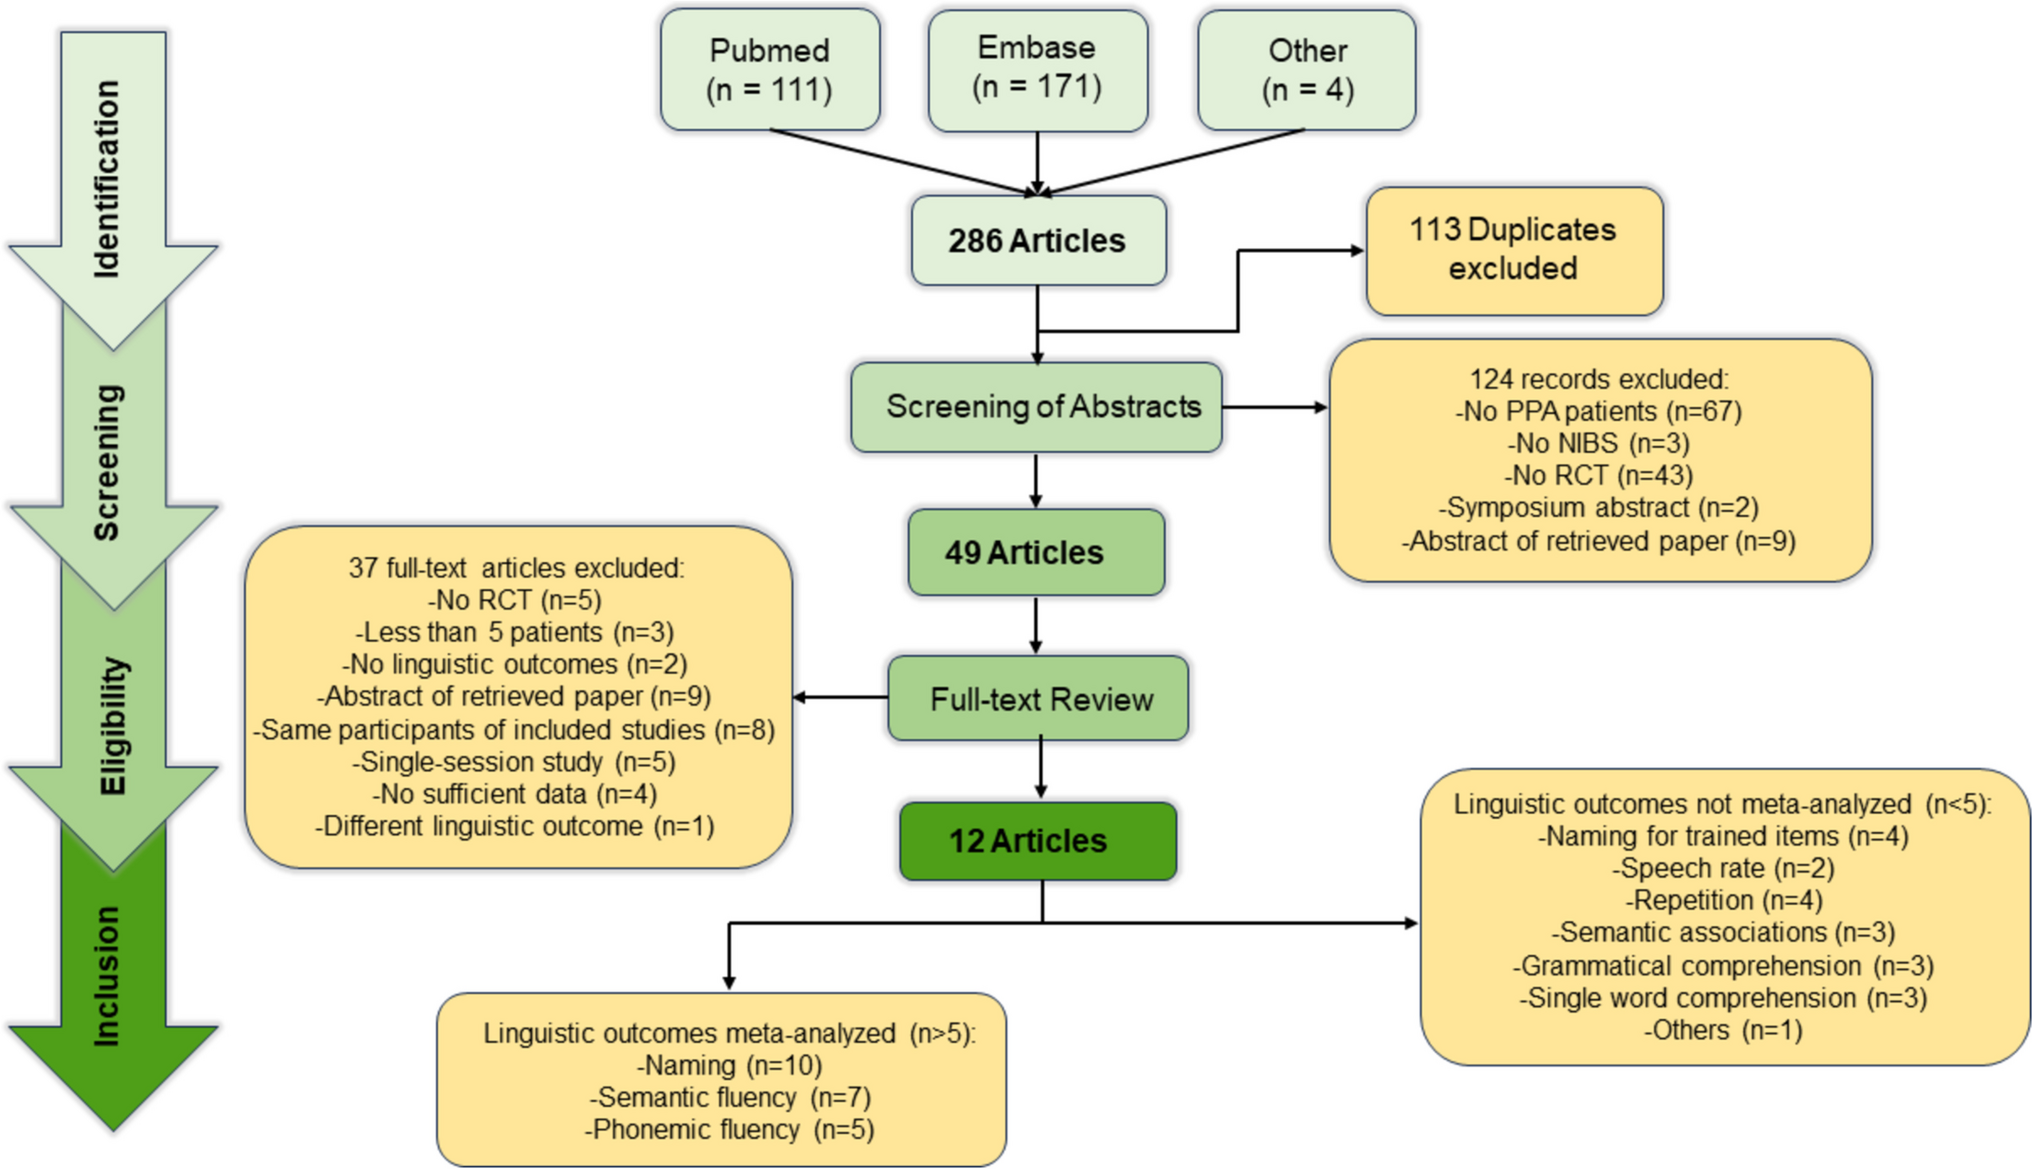
The database search yielded 7241 sources, and an additional 2 articles were identified through other sources (i.e., hand-searching). From this total of publications retrieved from the search of the digital databases, 4576 articles were removed because they were duplicated, and 2705 were excluded based on the title or abstract because they were not relevant to the main objective of this review. Hence, from 175 full-text articles completely read, only 25 were finally included (see the flowchart described in Fig. 1). A total of 21 articles were selected to address the first aim of this study, and data for the second objective came from 4 studies (Supplementary Table 2).
It should be noted that we only described results for cognitive domains that existed in a minimum of two different articles which measured them. This was in line with the recommendations pointed out by Ryan (2016) for conducting meta-analysis.
Working Memory
The assessment of working memory (visuospatial) performance revealed a significant difference such as that IPV perpetrators (without drug misuse) scored below non-violent men in the working memory test (5 studies: SMD = −0.48, 95% CI [−0.67, −0.29]; test for overall effect: Z = 4.86, p < 0.00001). Heterogeneity assessment revealed that conclusions across studies were relatively homogeneous given that there were no significant differences (Heterogeneity: Tau2 = 0.00, Chi2 = 2.48, p = 0.65; I2 = 0%) (Table 1a).
Table 1 Working memory performance in IPV perpetrators without (a) and with drug misuse (b) compared to non-violent menWhen we compared the performance of IPV perpetrators with drug misuse and non-violent men in terms of working memory, conclusions were the same. That is, IPV perpetrators with drug misuse presented lower working memory performance than non-violent men (4 studies: SMD = -0.48, 95% CI [−0.75, −0.21]; test for overall effect: Z = 3.49 (p = 0.0005)). Moreover, the low heterogeneity across included studies could be verified given that the I2 was lower than 40% (Heterogeneity: Tau2 = 0.02, Chi2 = 4.25, p = 0.24); I2 = 29%) (Table 1b).
Last, the analysis of SD averages across studies in both cases could be defined as “medium,” given that they were close to the value of 0.05. In this sense, group differences were similar in both cases.
Attention
Calculating the ability to switch attention across studies revealed that IPV perpetrators without drug misuse tend to present serious difficulties to change their attentional focus compared to non-violent men (9 studies: SMD = 0.45, 95% CI [0.27, 0.62]; test for overall effect: Z = 5.09 (p = 0.00001), with this conclusion being consistent across studies (Heterogeneity: Tau2 = 0.00, Chi2 = 5.30, p = 0.73; I2 = 0%) (Table 2a).
Table 2 Switching attention performance in IPV perpetrators without (a) and with drug misuse (b) compared to non-violent menThe comparison between IPV perpetrators with drug misuse and non-violent men revealed significant and marked differences between both groups in terms of switching attention (3 studies: SMD = 0.95, 95% CI [0.44, 1.46]; test for overall effect: Z = 3.67 (p = 0.0002), with a moderate heterogeneity across studies (Heterogeneity: Tau2 = 0.10, Chi2 = 3.94, p = 0.14; I2 = 49%) (Table 2b).
Whereas the calculation of the first comparison revealed a “moderate” difference, the second comparison revealed a “large” effect. Nonetheless, the heterogeneity across studies was higher in the second comparison.
The analysis of group differences in terms of continuous attention performance revealed that there were no significant differences between IPV perpetrators without drug misuse and non-violent men (5 studies: SMD = 0.12, 95% CI [−0.19, 0.43]; test for overall effect: Z = 0.86, p = 0.39). This conclusion was consistent across all included studies (Heterogeneity: Tau2 = 0.03, Chi2 = 6.30, p = 0.18; I2 = 37%) (Table 3a).
Table 3 Continuous attention performance in IPV perpetrators without (a) and with drug misuse (b) compared to non-violent menHowever, the assessment of group differences between IPV perpetrators with drug misuse and non-violent men revealed significant differences across studies (5 studies: SMD = −0.64, 95% CI [−0.84, −0.45]; test for overall effect: Z = 6.49 (p < 0.00001), with this conclusion being homogeneous (Heterogeneity: Tau2 = 0.00, Chi2 = 4.13, p = 0.39; I2 = 3%) (Table 3b). Furthermore, the average effect size across studies might allow us to conclude the existence of a moderate difference between IPV perpetrators with drug misuse and non-violent men.
Executive Functioning
Cognitive Flexibility
Analyses of neuropsychological performance, concretely those employing perseverative errors subscales of the WCST, revealed a significant difference such that IPV perpetrators without drug misuse committed more perseverative errors than non-violent men (9 studies: SMD = 0.66, 95% CI [0.48, 0.84]; test for overall effect: Z = 7.24 (p < 0.00001), with this conclusion being relatively consistent across studies (Heterogeneity: Tau2 = 0.02, Chi2 = 11.50, p = 0.17; I2 = 30%) (Table 4a).
Table 4 Cognitive flexibility performance in IPV perpetrators without (a) and with drug misuse (b) compared to non-violent men
In addition, when we focused on IPV perpetrators with drug misuse, these men also committed more perseverative errors than non-violent men (4 studies: SMD = 1.38, 95% CI [0.41, 2.34]; test for overall effect: Z = 2.80 (p < 0.005), but an important variability among included studies was found (Heterogeneity: Tau2 = 0.81, Chi2 = 28.48, df = 3 (p = 0.00001); I2 = 89%) (Table 4b).
The difference in the comparison between IPV perpetrators without drug misuse and non-violent men groups was moderate, given that their values were between 0.40 and 0.80. This difference was larger for the second case; the obtained values were higher than 0.80, although this effect was conditioned by an important heterogeneity across studies.
Planning Abilities
The calculation of differences in terms of planning abilities of IPV perpetrators compared to non-violent men revealed a significant effect (3 studies: SMD = –0.63, 95% CI [−0.86, −0.41]; test for overall effect: Z = 5.51, p < 0.00001), with this conclusion being homogeneous across studies (Heterogeneity: Tau2 = 0.00, Chi2 = 1.24, p = 0.54); I2 = 0%) (Table 5a).
Table 5 Planning abilities in IPV perpetrators without (a) and with drug misuse (b) compared to non-violent men
This difference between groups was also present after comparing IPV perpetrators with drug misuse and non-violent men (3 studies: SMD = −0.82, 95% CI [−1.04, −0.60]; test for overall effect: Z = 7.31, p < 0.00001). Furthermore, heterogeneity assessment did not reveal a significant effect (Heterogeneity: Tau2 = 0.00, Chi2 = 0.76, p = 0.68); I2 = 0%) (Table 5b).
In both cases, IPV perpetrators presented lower planning abilities than non-violent men. Differences between groups in the first case could be defined as moderate and large in the second case.
Decision-Making
The analysis of differences in decision-making processes between IPV perpetrators without drug misuse and non-violent men did not reveal a significant effect (4 studies: SMD = −0.17, 95% CI [−0.84, 0.51]; test for overall effect: Z = 0.48, p = 0.63). In addition, heterogeneity assessment revealed a significant variation across groups (Heterogeneity: Tau2 = 0.37, Chi2 = 16.88, p = 0.0007); I2 = 82%) (Table 6a).
Table 6 Decision-making in IPV perpetrators without (a) and with drug misuse (b) compared to non-violent men
This was the same for the comparison between IPV perpetrators with drug misuse and non-violent men (3 studies: SMD = −3.51, 95% CI [−9.42, 2.40]; test for overall effect: Z = 1.17, p = 0.24). Heterogeneity measurements revealed a significant effect (Heterogeneity: Tau2 = 26.89, Chi2 = 185.78, p = 0.00001); I2 = 99%) (Table 6b).
Phonemic Fluency
For the phonemic fluency, there was a significant difference between IPV perpetrators without drug misuse and non-violent men (3 studies: SMD = −0.69, 95% CI [−1.27, −0.10]; test for overall effect: Z = 2.31 (p = 0.02). This effect was relatively moderate as it did not reach an average of 0.80. However, the results vary across studies (Heterogeneity: Tau2 = 0.22, Chi2 = 12.32, p = 0.002); I2 = 84%) (Table 7a).
Table 7 Phonemic fluency in IPV perpetrators without (a) and with drug misuse (b) compared to non-violent men
This conclusion was the same after comparing the performance of IPV perpetrators with drug misuse and non-violent men in terms of phonemic fluency (2 studies: SMD = −0.84, 95% CI [−1.58, −0.10]; test for overall effect: Z = 2.21 (p = 0.03). In fact, this effect was larger. However, these conclusions vary across studies (Heterogeneity: Tau2 = 0.25, Chi2 = 7.88, p = 0.005); I2 = 87%) (Table 7b).
IQ
The IQ assessment revealed that IPV perpetrators without drug misuse presented a lower IQ than non-violent men (3 studies: SMD = −0.42, 95% CI [−0.67, −0.18]; test for overall effect: Z = 3.39, p = 0.0007), with this effect being low. This conclusion was homogeneous across studies (Heterogeneity: Tau2 = 0.00, Chi2 = 1.00, p = 0.61; I2 = 0%) Table 8a).
Table 8 IQ in IPV perpetrators without (a) and with drug misuse (b) compared to non-violent men
However, the IQ of IPV perpetrators with drug misuse did not differ from the IQ of non-violent men (2 studies: SMD = −0.73, 95% CI [−1.56, 0.10]; test for overall effect: Z = 1.73, p = 0.08), and this conclusion was consistent across studies (Heterogeneity: Tau2 = 0.24, Chi2 = 2.35, p = 0.13; I2 = 0%) (Table 8b).
IPV Perpetrators vs Other Types of Criminal Convictions
The assessment of IQ group differences between IPV perpetrators and other criminal history did not reveal significant differences in terms of IQ (3 studies: SMD = 0.01, 95% CI [−0.43, 0.44]; test for overall effect: Z = 0.03, p = 0.97) and inhibitory control (2 studies: SMD = −0.09, 95% CI [−0.45, 0.27]; test for overall effect: Z = 0.50, p = 0.62). These conclusions were consistent in both cases across studies (Heterogeneity: Tau2 = 0.00, Chi2 = 0.33, p = 0.57; I2 = 0% and Heterogeneity: Tau2 = 0.00; Chi2 = 0.31, p = 0.58; I2 = 0%; respectively). However, a significant difference between these groups was found for switching attention (3 studies: SMD = 0.47, 95% CI [0.17, 0.78]; Test for overall effect: Z = 3.06, p = 0.002), with IPV perpetrators presenting a lower performance than other criminal history. The difference was low, and the conclusion was homogeneous (Heterogeneity: Tau2 = 0.00; Chi2 = 0.89, p = 0.64; I2 = 0%) (Table 9).
Table 9 Cognitive performance (IQ; inhibitory control and switch attention) in IPV perpetrators compared to other criminal convictions
IPV Perpetrators Without Drug Misuse vs IPV Perpetrators with Drug Misuse
The analysis of group differences across studies did not reveal significant differences between IPV perpetrators without drug misuse and those with drug misuse in terms of working memory (Z = 1.06; p = 0.29), cognitive flexibility (Z = 1.26; p = 0.21), or IQ (Z = 1.14; p = 0.26). Even though conclusions across studies were consistent for working memory (Heterogeneity: Tau2 = 0.03; Chi2 = 4.48, df = 3 (p = 0.21); I2 = 33%), there was a considerable variability for studies measuring cognitive flexibility and IQ (Heterogeneity: Tau2 = 2.05; Chi2 = 166.51, p < 0.00001); I2 = 98 and heterogeneity: Tau2 = 0.14; Chi2 = 6.12, p = 0.05); I2 = 67%, respectively). However, groups differed in terms of switching attention (4 studies: SMD = −0.51, 95% CI [−0.71, −0.30]; Z = 4.83, p < 0.00001). IPV perpetrators without drug misuse outperformed those with drug misuse in tasks measuring switching attention. Included studies presented a certain homogeneity given that the heterogeneity measurement was not significant (Heterogeneity: Tau2 = 0.00; Chi2 = 1.48, p = 0.69; I2 = 0%) (Table 10).
Table 10 Cognitive performance (working memory, switch attention, cognitive flexibility, and IQ) in IPV perpetrators without drug misuse compared to IPV perpetrators with drug misuse
Association Between Neuropsychological Performance and IPV Perpetration Measured with the Physical Assault and Psychological Aggression Subscales of the CTS or CTS2
Working memory performance, especially for visuospatial information, was negatively and significantly associated with physical IPV (r = −0.17, 95% CIs [−0.44, −12]; Z = −2.52, p = 0.012), with this conclusion being homogeneous (Tau2 = 0.00; Q = 2.72, p = 0.26; I2 = 26.58%). However, working memory was not related to psychological IPV (r = −0.09, 95% CIs [−0.37, 0.21]; Z = −1.24, p = 0.207). These results were consistent across studies (Tau2 = 0.00; Q = 2.86, p = 0.24; I2 = 30.19%) (Table 11).
Table 11 Relationships between working memory with physical and psychological IPV in IPV perpetratorsThe analysis of switching attention and IPV perpetration revealed that it was not related to physical IPV (r = 0.07, 95% CIs [−0.27, 0.40]; Z = −2.59, p = 0.010), with this conclusion being homogeneous (Tau2 = 0.00; Q = 0.24, p = 0.63; I2 = 0%). This was the same for the analysis of the association between switching attention and psychological IPV (r = 0.10, 95% CIs [−0.84, 0.89]; Z = 0.95, p = 0.341), with this result being explained by the heterogeneity across studies (Tau2 = 0.00; Q = 2.94, p = 0.09; I2 = 66.04%) (Table 11).
Continuous attention performance was weakly but significantly associated with physical IPV (r = −0.05, 95% CIs [−0.13, 0.04]; Z = −2.30, p = 0.021), with this conclusion being homogeneous (Tau2 = 0.00; Q = 0.31, p = 0.86; I2 = 0%). However, it was not related to psychological IPV (r = −0.05, 95% CIs [−0.30, 0.20]; Z = −0.88, p = 0.377), which was a consistent conclusion across studies (Tau2 = 0.00; Q = 2.48, p = 0.29; I2 = 19.47%) (Table 11).
The analysis of cognitive flexibility performance and physical IPV revealed a non-significant association (r = −0.04, 95% CIs [−0.22, 0.15]; Z = 2.44, p = 0.015), which was homogeneous across studies (Tau2 = 0.00; Q = 0.04, p = 0.85; I2 = 0%). This was similar for the association with psychological IPV (r = −0.06, 95% CIs [−0.77, 0.71]; Z = −0.84, p = 0.402), which was consistent (Tau2 = 0.00; Q = 0.96, p = 0.33; I2 = 0%) (Table 11).
Planning abilities were not related to physical and psychological IPV (r = −0.01, 95% CIs [−0.72, 0.70]; Z = −0.19, p = 0.851; and r = −0.04, 95% CIs [−0.10, 0.03]; Z = −7.13, p < 0.001, respectively). This conclusion was homogeneous across studies (Tau2 = 0.00; Q = 0.83, p = 0.36; I2 = 0% and Tau2 = 0.00; Q = 0.00, p = 0.94; I2 = 0%, respectively) (Table 11).
The analysis of inhibitory control was not related to physical and psychological IPV (r = 0.00, 95% CIs [−0.60, 0.60]; Z = 0.01, p = 0.993 and r = −0.02, 95% CIs [−0.80, 0.79]; Z = −0.22, p = 0.829). This conclusion was homogeneous across studies (Tau2 = 0.00; Q = 0.51, p = 0.47; I2 = 0% and Tau2 = 0.00; Q = 1.23, p = 0.27; I2 = 28.75%) (Table 11).


Comments (0)