
Remember me


Participants were drawn from a natural history protocol conducted at the NIH Clinical Center in Bethesda, Maryland, USA (protocol number 11-M-0144; NCT01339767). The study was approved by the NIH Institutional Review Board. Consent from the parent or guardian of each child was obtained prior to participation. Inclusion criteria were being between the age of 9 of 21 months, born full-term, no significant medical or motor impairment deemed responsible for the delays (or any known genetic disorder for the typically developing group), and English reported as the primary language spoken in the home. Additionally, at the initial evaluation, eligibility for the language delay (LangD) group included receptive and expressive language T-scores ≥2 standard deviations below average on the Mullen Scales of Early Learning [30] (MSEL), and eligibility for the typically developing (TD) group included T-scores within 1.5 standard deviations of average on all domains of the MSEL.
A total of 62 (LangD, n = 19; TD, n = 43) toddlers enrolled in the natural history study. Participants were included in the current analysis if they had at least one analyzable sleep study, resulting in n=55 toddlers (LangD, n = 16; TD, n = 39) aged 12 to 22 months at their first visit (mean age 17.4±2.8 months) (Table 1). The sample was majority male (n = 34, 62%) and white (n = 36, 65%). Seven (44%) of the LangD participants received a research ASD diagnosis (based on clinical judgment of DSM-5 criteria informed by research-reliable administrations of the Autism Diagnostic Interview and Autism Diagnostic Observation Schedule) during their study participation, but no other formal diagnoses were systematically evaluated. This small sample size precluded investigation of relationships to eventual ASD diagnosis.
Table 1. Sample characteristicsProceduresThe study design was longitudinal, comprising study visits at 12 and/or 18 months (depending on age of study entry), 24 months, and 36 months. At each study visit, participants received a neurodevelopmental assessment supervised by doctoral-level clinicians, including the MSEL and Vineland Adaptive Behavior Scales, 2nd Edition [31]. Two scores were computed from the MSEL and used in the current analysis: the Verbal Developmental Quotient (VDQ; using the Receptive and Expressive subscales) and the Nonverbal Developmental Quotient (NVDQ; using the Fine Motor and Visual Reception subscales). DQs are analogs of IQs and are calculated by averaging the age equivalents from each subscale, dividing by the chronological age, and multiplying the result by 100. From the Vineland-II, the Socialization standard score was used to reflect a continuous metric of social skills relative to normative expectations. The Socialization score is norm-referenced with a population mean of 100 and SD of 15.
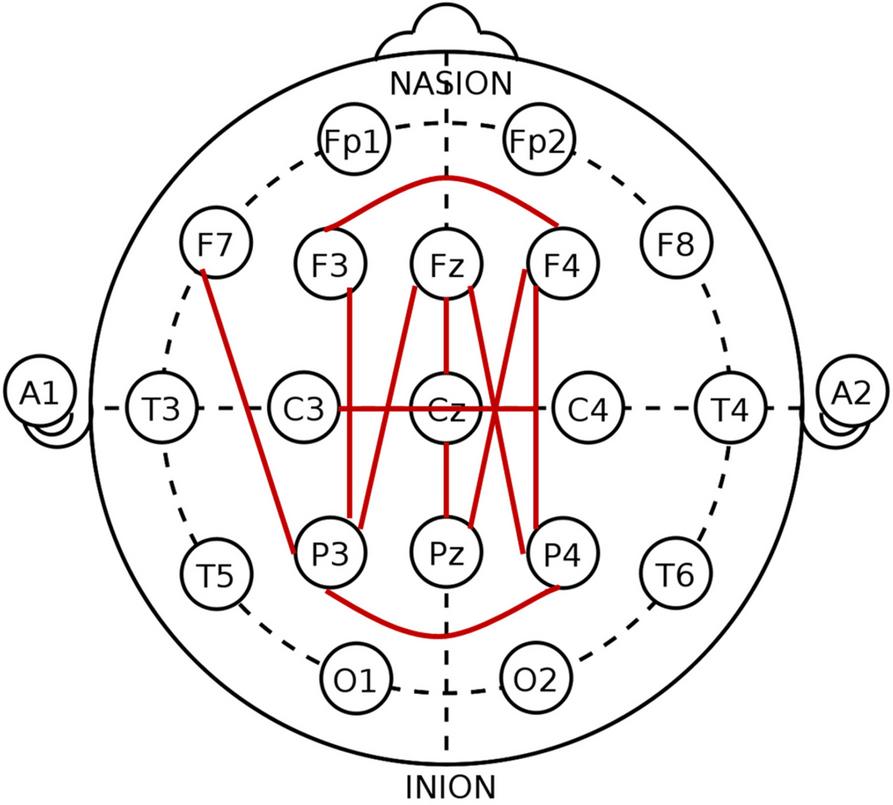
An optional polysomnogram was performed at the participants’ first visit (baseline; BL) and at the 36-month visit (follow-up; FU); those with valid sleep EEG data at either visit were included in the current analysis. A total of 34 (LangD, n=11; TD, n=23) participants had both BL and FU sleep studies, while 21 (LangD, n=5; TD, n=16) had only BL. Digital EEGs were recorded during awake, drowsy, and sleep states using the 10-20 system of electrode placement (Fig. 1).
Fig. 1
Electrode placement. Red lines indicate electrode pairs pulled for coherence analysis
AnalysisEEG CoherenceClean 10-minute segments of awake, slow-wave sleep (SWS), and rapid eye movement (REM) sleep were selected for coherence analysis, which was performed masked to participant group using Neuroguide software (Applied Neuroscience Inc., St. Petersburg, FL) with a linked-ear montage.
Electrode pairs (F3-P3, F4-P4, F4-Pz, P3-Fz, P4-Fz, P3-F7, C3-C4, Cz-Pz, F3-F4, Fz-Cz, and P3-P4; Fig. 1) were selected for coherence analysis based on findings from Buckley et al. [32] which found increased coherence in children with ASD compared to typically developing controls, concentrated in frontal-parietal pairs. Frequency bands selected for coherence analysis are Delta (1-4 Hz), Theta (4-8 Hz), Alpha 1 (8-10 Hz), Alpha 2 (10-12 Hz), Beta 1 (12-15 Hz), Beta 2 (15-18 Hz), and Beta 3 (18-25 Hz). Analysis was performed across three sleep stages (awake, REM, SWS), eleven electrode pairs, and seven frequency bands, yielding 231 models.
Coherence values were subjected to Fisher transformation and fixed effects of group (LangD versus TD) and age in months (centered at 18 months) were evaluated with the lme4 [26] package for R version 4.2.1 [33] using a linear mixed model with a random subject-level intercept. These models addressed the questions of whether coherence depended on group, age, or both. False detection rate (FDR) p-value correction was applied to these effects (693 tests in total: three effects within each of 231 models). In separate exploratory analyses, we evaluated the relationship between coherence and behavioral features (MSEL VDQ and NVDQ, and Vineland-II Socialization standard score) by adding the mean-centered behavioral score as a fixed effect. Because these variables are aliased with group membership, we included an interaction between group and behavioral variable, and evaluated the slope of the behavioral variable on coherence within each group to avoid confounding. The parameters of interest in these models were the simple slopes of the behavioral feature within each group. FDR p-value correction was applied to the list of these slopes (462 tests).
Spindle PropertiesBoth slow spindles (9 Hz and 11 Hz) and fast spindles (13 Hz and 15 Hz) were evaluated separately for density (number of spindles per minute), amplitude, duration, frequency (Hz), and chirp (intra-spindle frequency change). Spindle data were analyzed from all 16 channels using Luna (http://zzz.bwh.harvard.edu/luna/), a software package developed at Harvard Medical School designed to analyze polysomnogram recordings and automate spindle analysis. The Luna software utilized a Morlet wavelet transformation method of spindle detection. Spindle frequency, amplitude, duration, and epoch counts were recorded for each spindle and plotted on a graph for visual analysis and verification.
The effect of age on spindle features was evaluated using linear mixed effects models with fixed effects for study visit (baseline, BL vs. follow-up, FU), group, and sex, and a random subject-level intercept. Differences between LangD and TD group were tested using logistic regression where diagnostic status was a dependent variable and spindle characteristics at each channel as an independent variable with age and sex added as covariates. FDR p-value correction was applied separately for two sets of the analyses: BSL vs FU with mixed effect regression (320 tests in total – 16 channels x 5 spindle metrics x 4 spindle frequencies); LangD vs TD with logistic regression (528 tests in total – 16 channels x 11 spindle metrics at spindle frequencies were significant effect between BSL and FU was observed x 3 conditions BSL, FU, FU-BSL). The relationship of spindle density to behavioral scores were evaluated as described above for coherence.
For all analyses, the p-values were corrected using the FDR method as described above. To make the large number of statistical tests tractable for presentation, we use a graphical approach. The complete set of uncorrected and corrected p-values and test statistics is available as a supplement.
Comments (0)