
Remember me


This case-control, cross-sectional study was conducted at the outpatient clinics of a university hospital. Participants included patients aged between 18 and 64 years who were diagnosed with fibromyalgia according to the American College of Rheumatology 2016 Revisions to the 2010/2011 Fibromyalgia Diagnostic Criteria [11], as well as healthy controls matched by age and gender. The exclusion criteria were: (1) Peripheral nerve lesions, central nervous system lesions/diseases, or other factors (e.g., hyperthyroidism, severe electrolyte imbalance) that could interfere with deep tendon reflexes; (2) Pregnancy; (3) Clinical conditions that prevent proper evaluation of deep tendon reflexes (e.g., severe contracture in the adjacent joint); (4) Clinical conditions in which sEMG examination is not appropriate/permitted (e.g., cardiac stimulants, metallic implants, uncontrolled epilepsy, deep brain stimulators, open wounds). Ethical approval was obtained prior to the study (date: 8-December-2023, number: 139 − 33) from the Local Ethics Committee of Cukurova University. Written informed consent was obtained from each participant.
Sample sizeSample size was computed by the computer software G*Power 3.0.18 system (Heinrich-Heine-Universität Düsseldorf, Germany) with the selected parameter being: “t-test: difference between two independent means”. The sample size, according to the article by Tsuji et al. [12], having the sEMG measurement as the primary way of evaluation with an allocation ratio of 0.83 and an effect size of 0.8, was calculated to be 38 in the patient group and 32 in the control group. This calculation was made with 90% power and an alpha level of 0.05, resulting in a total sample size of 70.
Demographic and clinical evaluationsThe demographic data of the participants (age, gender, body mass index (BMI), smoking/alcohol use) were recorded. In the patient group, disease duration and details of pharmacological and non-pharmacological treatments were documented. The Revised Fibromyalgia Impact Questionnaire (FIQR) was used to evaluate functionality and disease impact [13, 14]. The Beck Depression Inventory (BDI) and Beck Anxiety Inventory (BAI) were administered to assess psychological status. These are 21-item questionnaires, which each item is scored from 0 to 3. The possible minimum and maximum scores range from 0 to 63. Higher scores represent more severe depressive mood/anxiety [15,16,17].
Deep tendon reflexes were tested in both the patient and control groups using a reflex hammer (Queen Square™ Hammer, handcrafted reflex hammer redesigned by MDF®, MDF Instruments Medifriend Inc., Shangai, China). In the upper extremity, the triceps reflex was recorded, while in the lower extremity, the quadriceps reflex was tested. Reflex testing was conducted with the relevant extremities in a relaxed position. The responses were rated on the following scale: 0 (no response), 1+ (hypoactive), 2+ (normal), 3+ (hyperactive without clonus), and 4+ (hyperactive with clonus) [18, 19]. Reflex testing was conducted three times for each tendon and taps were applied to the tendon with an interval of 5 s between each tap. The demographic and clinical evaluations were performed by medical doctors from the Department of Physical Medicine and Rehabilitation.
Electromyographic acquisitionSurface electromyography (sEMG) was used to assess the activation of the muscle groups associated with tendons (rectus femoris and triceps brachii-long head) bilaterally. This non-invasive method utilized a wireless, mobile measurement system (TRIGNO, Delsys Inc., Natick, MA, USA), with the following specifications: sampling at 2000 Hz bandwidth 20–450 Hz, input impedance < 10 ohms, baseline noise < 750nV root mean square (RMS), effective EMG signal gain 909 V/V ± 5%, full-wave rectified, and smoothed with a second-order Butterworth low-pass filter. This system is validated for the quantitative determination of deep tendon reflexes [12].
Skin preparation (to ensure stable electrode contact and low skin impedance) and electrode placement were performed according to the recommendations of the Surface Electromyography for the Non-Invasive Assessment of Muscles (SENIAM) project [20]. Lightweight (< 15 g) wireless rectangular sensors (37 × 26 × 15 mm) with parallel bar silver contact electrodes were placed over the muscle belly using double-sided adhesive tape. The electrode was positioned at 50% of the line from the anterior superior iliac spine to the superior part of the patella for rectus femoris, and at 50% of the line between the posterior crista of the acromion and the olecranon, two-finger-width medial to the line for triceps brachii [20].
Following skin preparation and electrode placement, maximum voluntary isometric contraction (MVIC) was performed to normalize (comparison of the voltage obtained from the muscle to a reference value) the sEMG signals collected during deep tendon reflex assessments. For the rectus femoris, participants were seated with the hip at 90° and knee at 45° flexion, and the column aligned. Manual resistance was applied to achieve maximum knee extension [21]. For the triceps brachii, the shoulder and elbow were maintained at 90° abduction and flexion, respectively. Manual resistance was applied to achieve maximum forearm extension [22]. Measurements were taken three times, each with a duration of 5 s per muscle, and data normalization was based on the highest value [23]. After MVIC measurements, raw sEMG signals of the deep tendon reflex-induced muscle activity were collected bilaterally. Electromyographic acquisition was conducted by a physiotherapist with a Doctor of Philosophy (PhD) and medical doctors.
Electromyographic analysisComputerized analysis of the sEMG data was performed by EMGworks® software (version: 4.8.0, Delsys Inc., Natick, MA, USA) and included amplitude and temporal analysis.
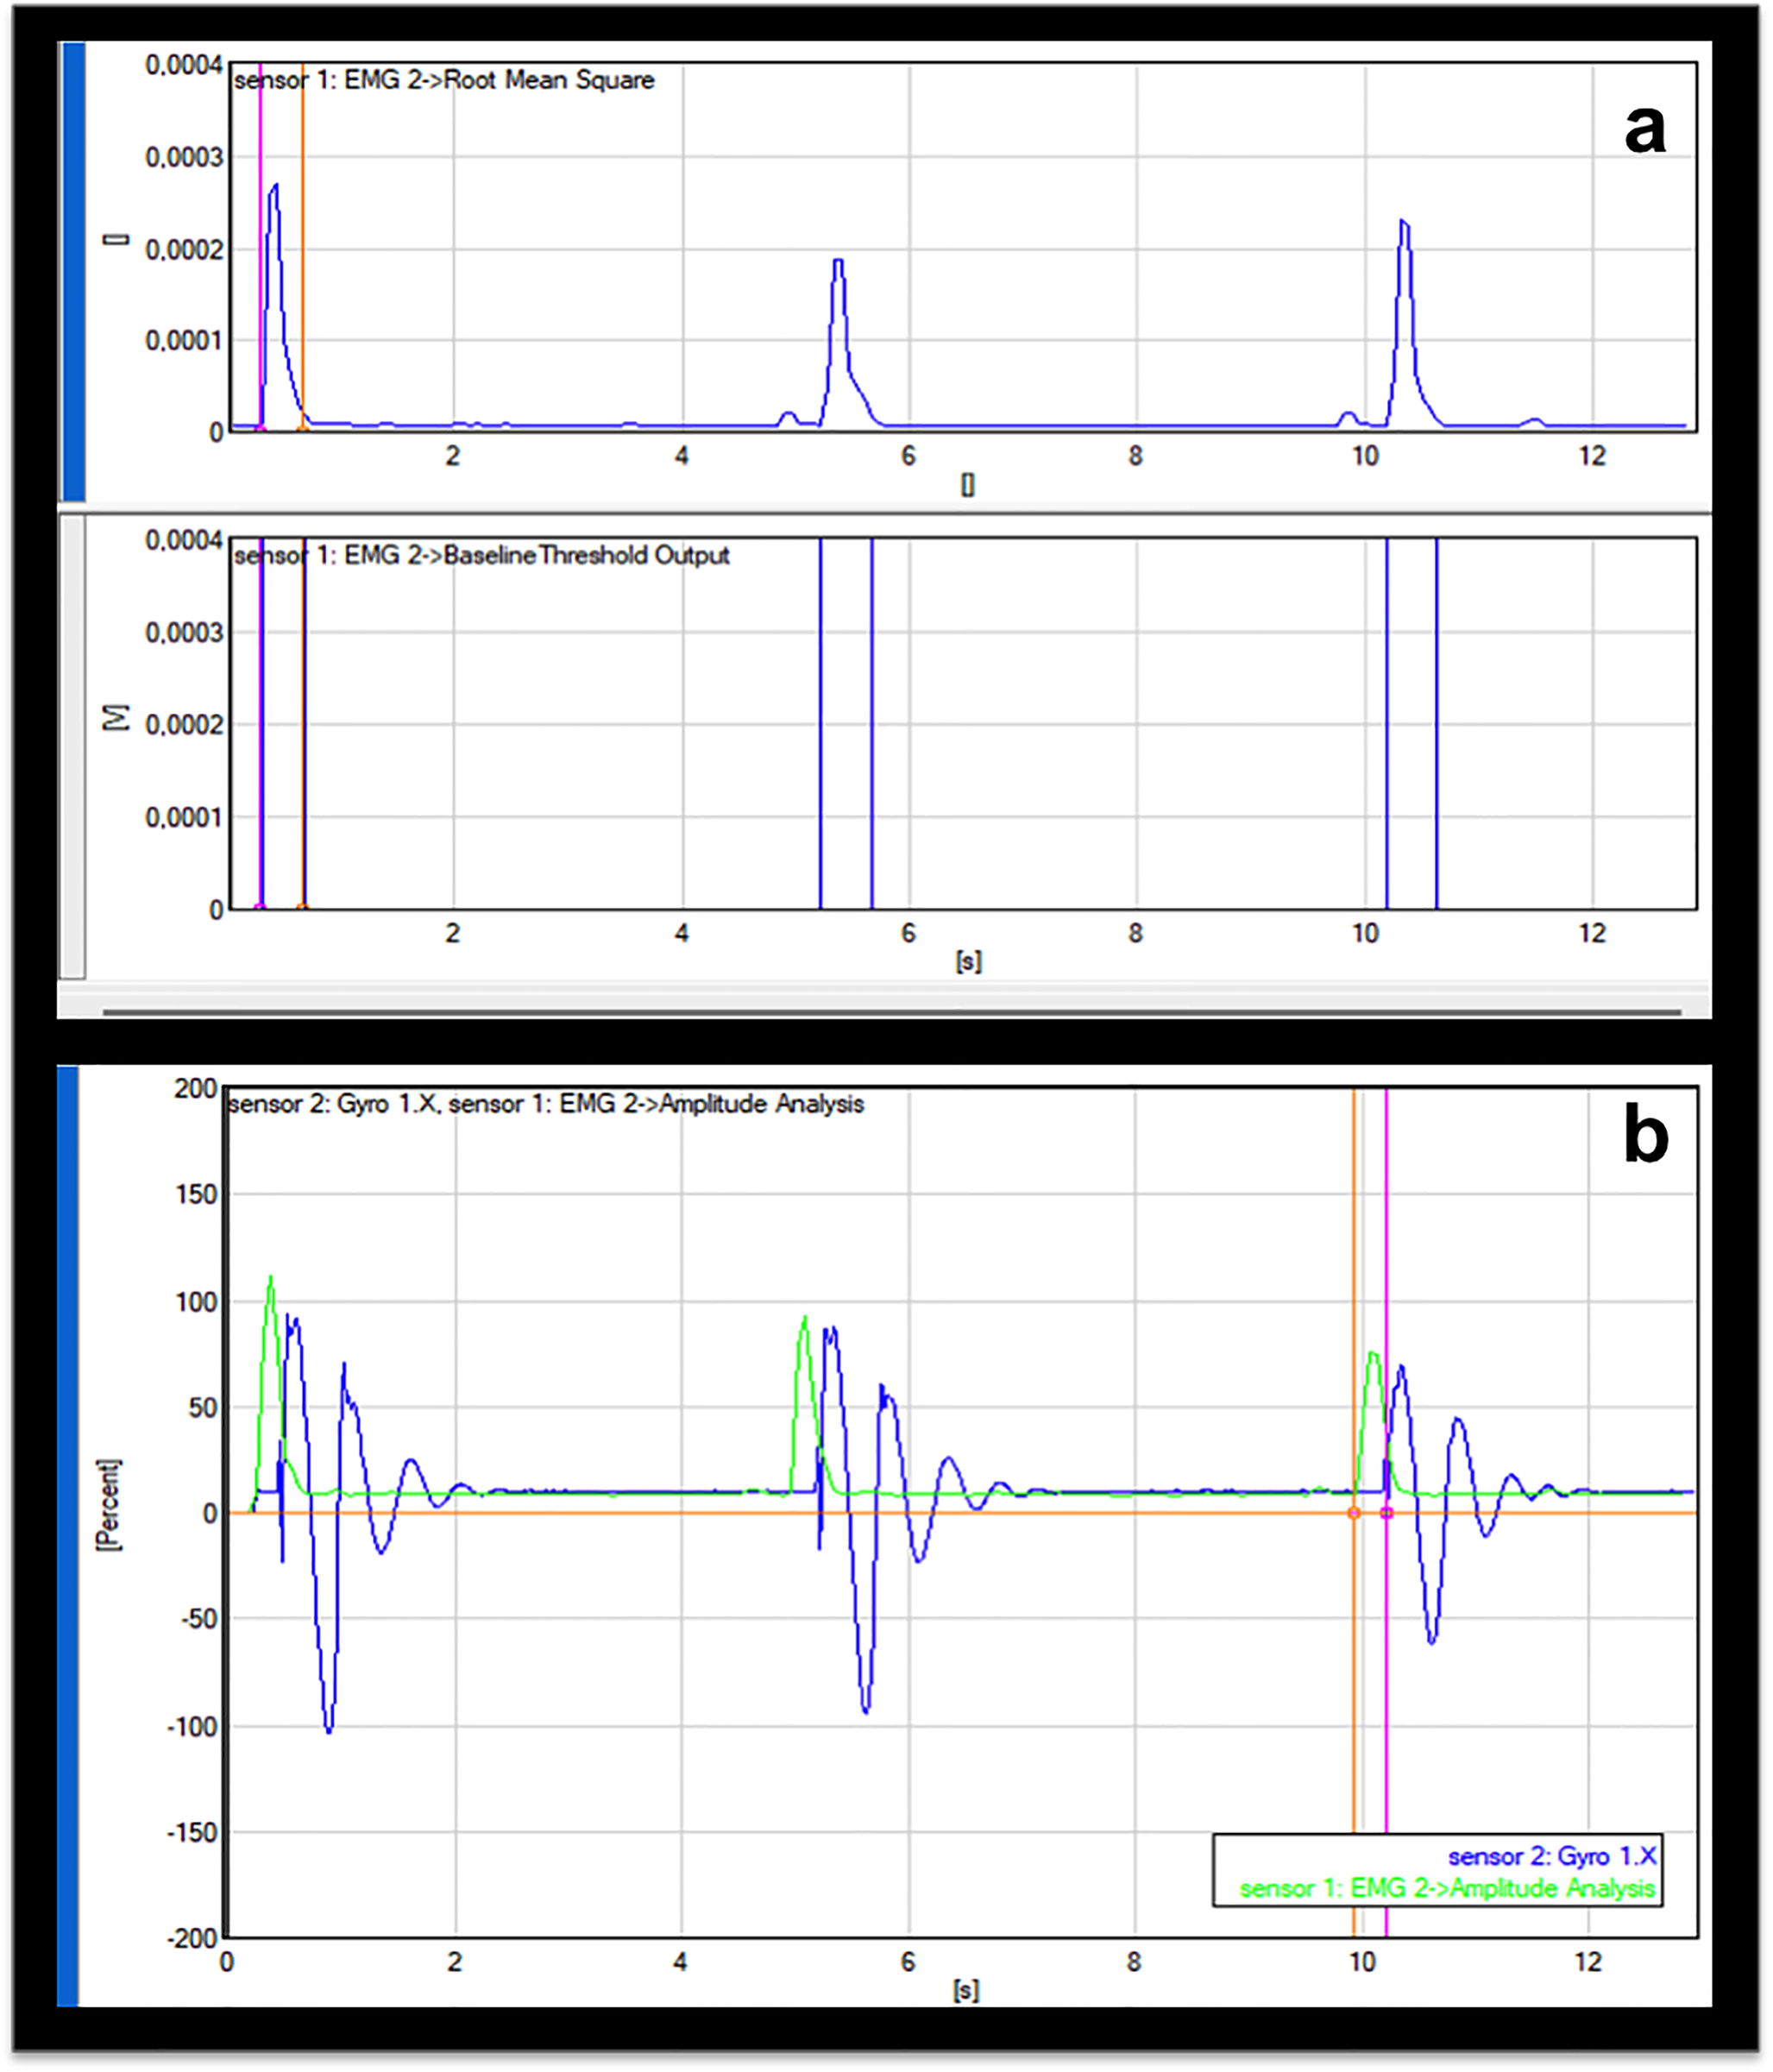
Amplitude analysisThe values of the rectified sEMG data during deep tendon reflex testing were normalized to the values of the MVIC and expressed as a percentage of the MVIC (%MVIC = muscle activation during deep tendon reflex -RMS/MVIC of the muscle-RMSX100). This process was performed for three deep tendon reflex measurements for each muscle and the average values were recorded (Fig. 1a).
Fig. 1
Amplitude of the rectified and smoothed sEMG signal is observed in the upper rectangle and the duration of muscle activation is depicted in the lower rectangle (a), the electromechanical delay; the normalized muscle activation is showed in green and the gyroscope signals in blue; the temporal interval between the pink and orange vertical lines indicates the electromechanical delay (b)
Temporal analysisDuration of the muscle activation is the temporal interval between the onset and offset time of the electrical activity of the muscle. Muscles were considered ‘‘on’’ when their amplitudes were 3 standard deviation (SD) points above the baseline signal for a 25-millisecond window. Muscles were considered to be ‘‘off’’ when the amplitude dropped below 3 SD points above the baseline signal [24] (Fig. 1a).
Inertial measurement unit analysisThe inertial measurement unit (IMU) used in this study was integrated into the sEMG sensor (Avanti; Delsys Inc., Natick, MA, USA) by the manufacturer, with temporal synchronization between the IMU and sEMG signals ensured during production. Both IMU and EMG signals were collected simultaneously using a single Bluetooth connection. The IMU recorded triaxial acceleration (± 16 g range) and angular velocity (± 2000 degrees/second range), with a sampling frequency of 2000 Hz and bandwidth 20–450 Hz. To reduce noise and improve signal clarity, a low-pass Butterworth filter with a cut-off frequency of 10 Hz was applied to the signals. The sensors were placed vertically to the midpoint of the leg and midpoint of the forearm and fixed with adhesive tape. The primary kinematic outcomes, including angular velocity (rotational speed) and acceleration of the leg and forearm in the sagittal plane, were derived from the processed IMU data.
Electromechanical delay analysisElectromechanical delay is defined as the latency between the onset of electrical activity in a muscle and the onset of force production by contraction of that muscle. The main reason of electromechanical delay is the latency of force transmission due to the structural slack of the tendon and the non-contractile filaments of the muscle [25]. The value of the electromechanical delay can be used as a useful biomarker for the muscle viscoelasticity such as tone and stiffness [26]. Previous studies revealed that the increased muscle tone makes electromechanical delay shorter than the electromechanical delay of normally functioning muscles [27,28,29]. In this study, electromechanical delay was measured as the temporal interval between the onset of the sEMG and the onset of the motion production demonstrated by the increasing phase of the gyroscope signals (Fig. 1b).
Statistical analysisStatistical analyses were carried out using the Statistical Package for Social Sciences (version 22.0; SPSS, Chicago, IL). Data distribution was assessed using both visual methods (histograms and probability plots) and analytical methods (Kolmogorov-Smirnov test). Categorical data were presented as numbers (n) and percentages (%), parametric data as means and standard deviations, and nonparametric data as medians and interquartile ranges. Comparisons between groups were conducted using the Chi-square test, unpaired t-test, and Mann-Whitney U test. The receiver operating characteristics (ROC) curve was used to determine the sensitivity, specificity, and cut-off values of the rectus femoris and triceps brachii normalized activations (MVCI%) in distinguishing between patients and controls. Area under curve (AUC) values above 0.70 were interpreted as indicating an acceptable diagnostic performance of the test. Alpha value of less than 0.05 demonstrated statistical significance. Correlation analysis was used to examine the potential association of confounders with the dependent variables.
Comments (0)