
Remember me
Since the last two decades the relevant role of the actin cytoskeleton for the development and function of the nervous system has been extensively studied. Both growth cone dynamics and neurite extension (for a review see Omotade et al., 2017), as well as synaptic plasticity (for a review see Cingolani and Goda, 2008), have been shown to depend on actin dynamics. Actin binding proteins (ABP) are key factors that convey extracellular cues to actin cytoskeleton rearrangements. Only a few ABPs have been genetically linked to neurodevelopmental or neurological disorders in humans, either through copy number variation (CNV) or single nucleotide variation (SNV) and microdeletions, including: inverted formin 2 (IFN2) (Boyer et al., 2011; Mademan et al., 2013), profilin 1 (PFN1) (Wu et al., 2012; Smith et al., 2015), the cytoplasmic FMR1 interacting protein 1 and 2 (CYFIP1 and CYFIP2) (Oguro-Ando et al., 2015; Nakashima et al., 2018; Peng et al., 2018), spectrin beta III (SPTBN2) (Avery et al., 2017), microtubule actin crosslinking factor 1 (MACF1) (Dobyns et al., 2018), dystonin (DST) (Fortugno et al., 2019). The relevance of ABPs in neurodevelopmental and neurophysiological processes has also been assessed in mouse models, which have shown phenotypes ranging from neuronal cell migration impairment to neuronal development defects, as well as to alterations in synaptic maturation, connectivity and plasticity (Soderling et al., 2003; Grove et al., 2004; Bellenchi et al., 2007; Pilo Boyl et al., 2007; Bozdagi et al., 2012; Pathania et al., 2014; Han et al., 2015; Di Domenico et al., 2021; Klemz et al., 2021). Often these mouse models displayed certain anatomical or physiological conditions typical of neurodevelopmental disorders, such as autism spectrum disorder (ASD), intellectual disability, schizophrenia, and epilepsy (Soderling et al., 2003; Bozdagi et al., 2012; Han et al., 2015; Davenport et al., 2019), however, the behavioral phenotypes were mild possibly due to heterozygosity, or to compensatory mechanisms, or to functional redundancy of paralogs, or because deletion of the specific gene occurred too late in brain development.
The profilin 2 (Pfn2) conventional knock-out (ko) mouse model (Pfn2−/−) is viable and has been already shown to display synaptic, physiological, and behavioral phenotypes typical of neurodevelopmental disorders (Gareus et al., 2006; Pilo Boyl et al., 2007). The Pfn2 ko mouse model has two distinct features when compared to other ABPs knock-out models: (1) PFN2 function seems to be mainly restricted to regulating actin dynamics at the synapse, both in pre-synaptic boutons and in dendritic spines (Ackermann and Matus, 2003; Pilo Boyl et al., 2007), the neuronal compartment that has been recently proposed to be a hotspot for mental disorders (Yan et al., 2016); and (2) in this mouse model, PFN2 is absent during the entire embryonic development without resulting in pre-natal or juvenile lethality (Pilo Boyl et al., 2007; Di Domenico et al., 2021), as happens for many ABPs knock-out mouse models. The viability of Pfn2−/− mice can be explained by the restricted expression and function of PFN2, which only starts in post-mitotic neurons around embryonic day 12.5, and to a partial compensatory effect from its paralog, profilin 1 (Di Domenico et al., 2021). This combination of factors allows the study of the knock-out phenotype, which originates during embryonic development, in adult and aging mice. Functionally PFN2 is a small 14 kDa protein that forms a 1:1 complex with globular (G-) actin (profilactin) and accelerates the ADP to ATP exchange that primes G-actin to polymerization (Gieselmann et al., 1995; Paul and Pollard, 2009). In principle, this allows profilin 2 to coordinate the rate, place, and type of actin polymerization through the interaction with numerous specific actin nucleation and elongation factors (Krause et al., 2003; Faix and Grosse, 2006; Pollard, 2007) via its poly-L-proline (PLP) binding domain.
The human genomic locus 3q25-27, encompassing the PFN2 gene, has been linked to autism spectrum disorder in two past studies on Finnish families in Scandinavia and the USA (AUTS2, now, due to a nomenclature overlap, renamed AUTS8, OMIM: 607373) (Auranen et al., 2002; Coon et al., 2005), but until now no gene inactivating SNVs, CNVs, or microdeletions affecting specifically the PFN2 gene have been reported in exome sequencing studies. The absence of a clear association of the ASD phenotype to any of the genes included in the 3q25-27 human locus together with the findings on the specific synaptic function of PFN2 has prompted us to revisit a potential role of profilin 2 in autistic-like behavior. The core ASD traits are defined by the DSM-5 guidelines (American Psychiatric Association, 2013) as: (i) Social interaction deficits; (ii) Repetitive, ritualistic, and stereotyped behavior. In this work we show that the Pfn2 ko mouse presents with deficits in both these core traits. In addition, we investigate comorbid traits that often accompany the main autistic phenotype, in particular vocal communication, that we studied in the mouse pups, and motor coordination. We find that these behaviors are robustly altered in the Pfn2−/− mouse model, which could therefore represent an interesting in vivo model to study or validate one possible pathway causing autism spectrum disorder.
2 Results 2.1 Infantile mortality and shorter life expectancy of Pfn2−/− micePfn2 mutants are born in Mendelian ratio but in heterozygous breeding pairs we noted delayed growth of the Pfn2−/− pups compared to Pfn+/− and wt control littermates in larger size litters, suggesting a competitive disadvantage during rearing. Genotyping at weaning age (P21-P25) showed a reduced mendelian ratio to about 22% for Pfn2−/− animals (Figure 1A), pointing to a mortality rate of Pfn2−/− pups before weaning that was not observed in Pfn2+/− and wt control littermates (Figure 1B).
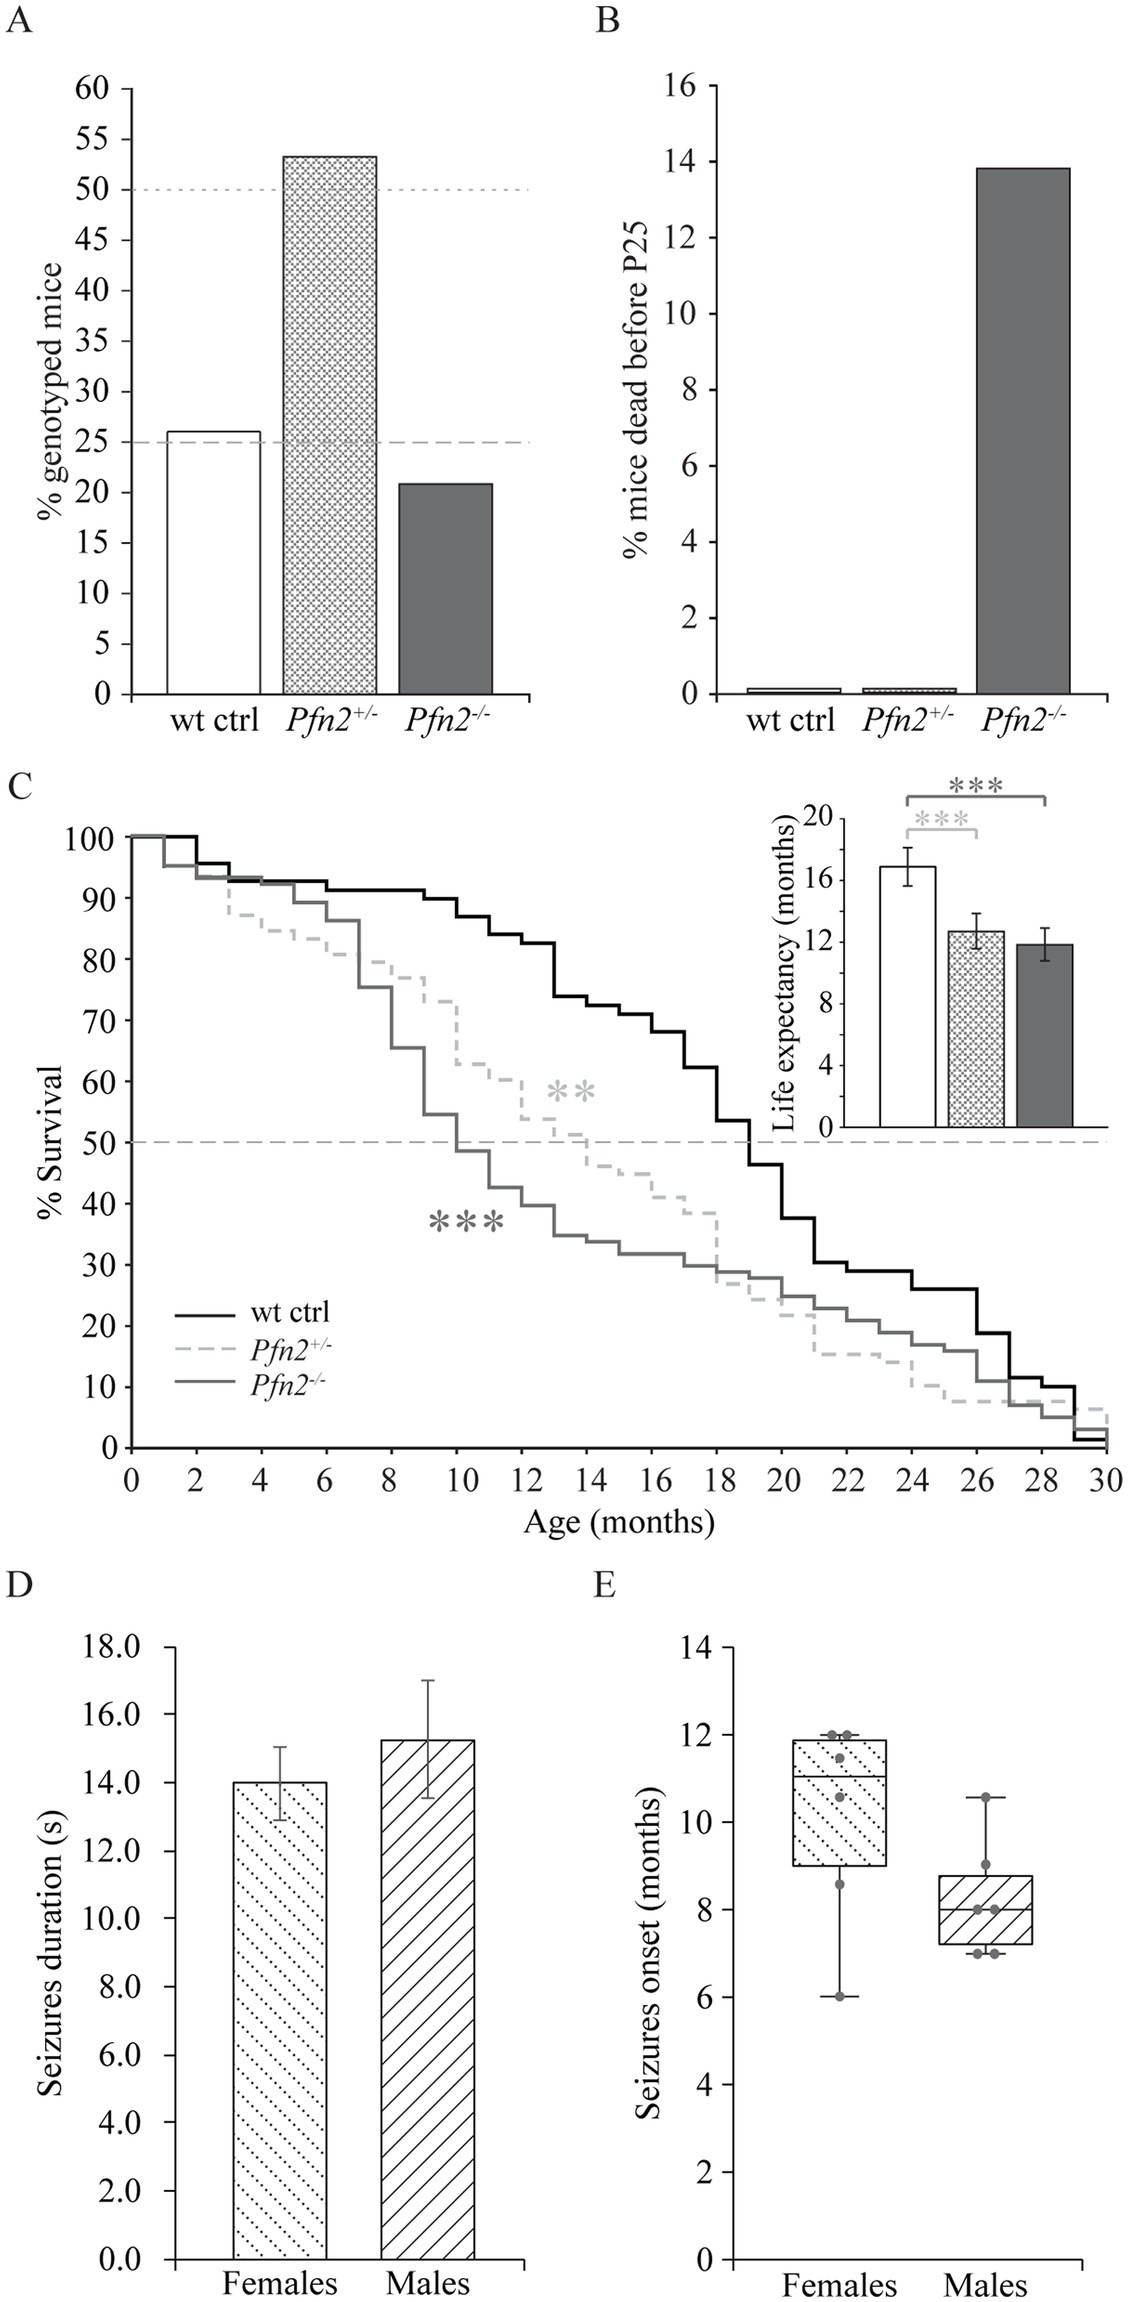
Figure 1. Reduced survival before weaning and shorter life expectancy of Pfn2−/− mice. (A) In Pfn2+/− matings, fewer Pfn2−/− offspring mice were found than expected from Mendelian ratio (dashed and dotted gray lines) at weaning (P21-P25). N = 47 wt, N = 97 Pfn2+/−, and N = 38 Pfn2−/− genotyped animals from 24 litters. (B) Pre-weaning loss of Pfn2−/− pups. Offspring were genotyped at P8, when all genotypes obeyed the Mendelian ratio, and followed until weaning (P25): 14% of Pfn2−/− mice died during this period, but no wt and Pfn2+/− mice. N = 76 wt ctrl, N = 178 Pfn2+/−, N = 75 Pfn2−/− P8 animals. (C) Kaplan–Meier plot of survival data shows higher mortality rate of Pfn2−/− mice between 6 and 14 months of age with an intermediate phenotype for Pfn2+/− mice (Peto-Prentice generalized Wilcoxon test: Pfn2−/− vs. wt ctrl, p < 0.001; Pfn2+/− vs. wt ctrl, p = 0.001). The median survival (dotted line in the graph) was 10 months for Pfn2−/− mice, 14 months for Pfn2+/− and 19 months for wt controls. Inset shows life expectancy (average life span) for each genotype, 12.9 ± 0.8 months for Pfn2−/− mice, 13.8 ± 0.9 months for Pfn2+/− and 18.3 ± 1.0 months for wt controls (two-tailed t-test: Pfn2−/− vs. wt ctrl mice, p < 0.0001; Pfn2+/− vs. wt ctrl mice, p = 0.0008). N = 69 wt ctrl, N = 78 Pfn2+/−, N = 101 Pfn2−/− animals. (D) Average duration of seizures in male and female Pfn2 ko mice. No difference was detected (two-sided t-test, p = 0.5384). (E) Box plot representation of the seizures onset for male and female Pfn2 ko mice, with single units per group indicated by the gray dots and horizontal bar indicating median. A tendential earlier onset in males was observed (Mann–Whitney U-test, p = 0.1467). N = 70 Pfn2−/− mice. **p ≤ 0.01, ***p ≤ 0.001.
These findings prompted us to investigate survival and life expectancy of Pfn2−/− mice through a standard survival analysis. The Kaplan–Meier plot showed a significant mortality of Pfn2−/− mice between 7 and 13 months (Peto-Prentice test, p < 0.001), with the median survival halved compared to wt littermate controls (Figure 1C). Interestingly, Pfn2 heterozygote mice displayed an intermediate phenotype, with significantly reduced survival compared to wt controls (p = 0.001), indicating a gene dosage effect on mouse survival. As a consequence, life expectancy (average life span) of both Pfn2−/− and heterozygote mice was significantly reduced by 30 and 25%, respectively (Figure 1C, inset).
Premature mortality has been reported in autism spectrum disorder (Hirvikoski et al., 2016). One associated cause is epilepsy, in a recent study found in 12% of individuals with autism (Lukmanji et al., 2019). In a small-scale study (N = 70 Pfn2−/− mice) we observed spontaneous, sensory induced, seizures in 12.5% of Pfn2−/− mice, irrespective of their sex. The seizures were tonic or tonic–clonic, had an average length of 14 s in females and 15 s in males (Figure 1D), and the mice typically recovered within 60–120 s. The seizures’ onset was tendentially earlier in male mutant mice (8 months) than in females (11 months, Figure 1E). Since the onset of seizures coincides with the period of higher mortality of the Pfn2−/− mice, we suspect that they might contribute to their reduced life expectancy.
2.2 Impaired maternal and social behavior of Pfn2−/− miceThe competitive disadvantage of Pfn2−/− pups during rearing hinted at altered social behavior, either in the relationship of the mutant pups with the mother or with the other littermates for successful breastfeeding. To study sociability more in detail, we addressed two established behaviors in adult mice: maternal behavior of Pfn2−/− mice toward the pups and social interactions of Pfn2−/− male mice.
Maternal behavior was found severely affected in Pfn2−/− mice. Nest building was almost absent in Pfn2−/− females (Supplementary Figure 1) and when Pfn2−/− mothers were allowed as single parents to rear their litters, all pups were lost irrespectively of the pups’ genotype (Table 1, top part). Interestingly, with the cohabitation of a wt or Pfn2+/− father, all litters of Pfn2−/− mothers could be rescued and survived. However, only about half of the litters survived when both parents were Pfn2−/− animals (Table 1, bottom part). One possible reason for the rearing deficit of Pfn2−/− mothers was a severely compromised pup retrieval behavior: when challenged to retrieve P7 pups dispersed in the cage, wt mothers quickly collected all pups within 7 min back into the nest (Figure 2A). Instead, Pfn2−/− mothers never retrieved a single pup within the maximally allowed experimental time (30 min). Thus, Pfn2−/− dams completely lacked pup rearing behavior.
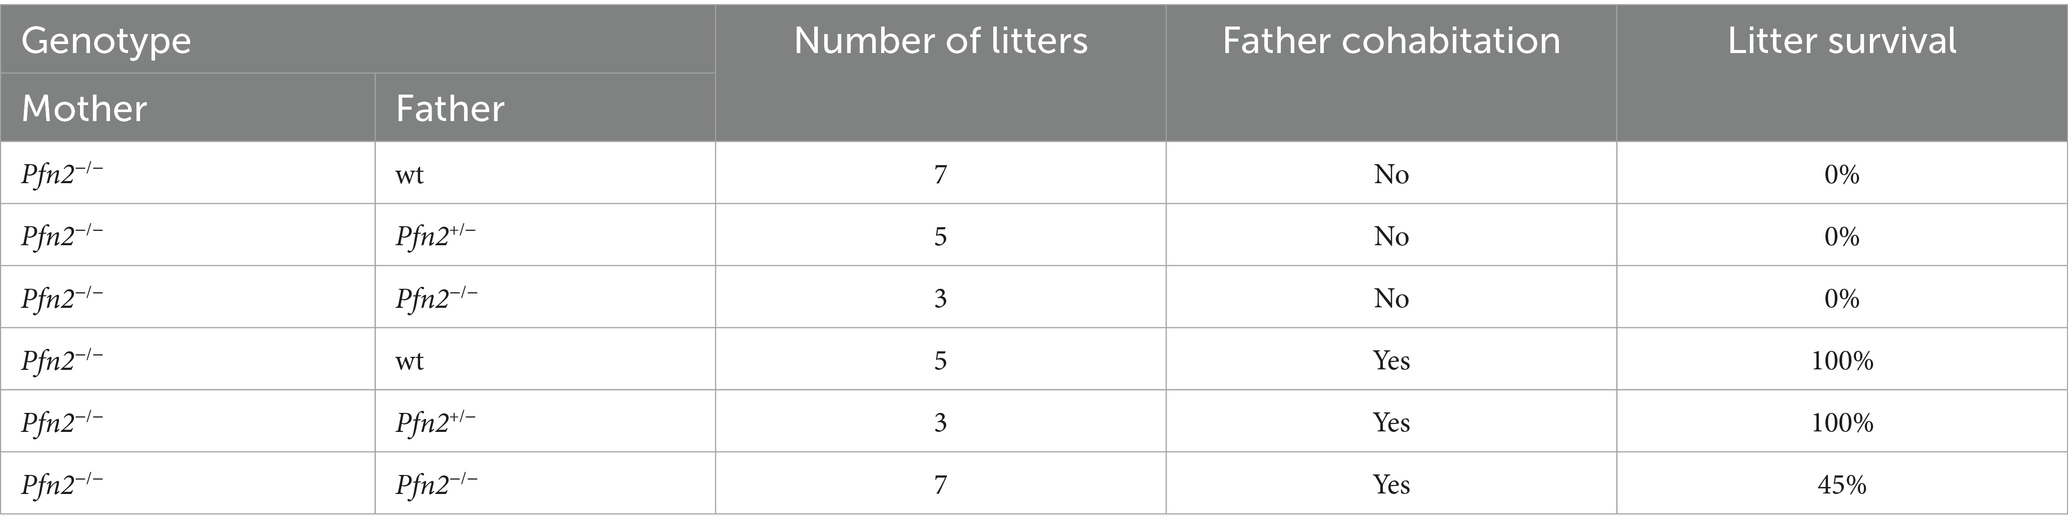
Table 1. Maternal behavior.
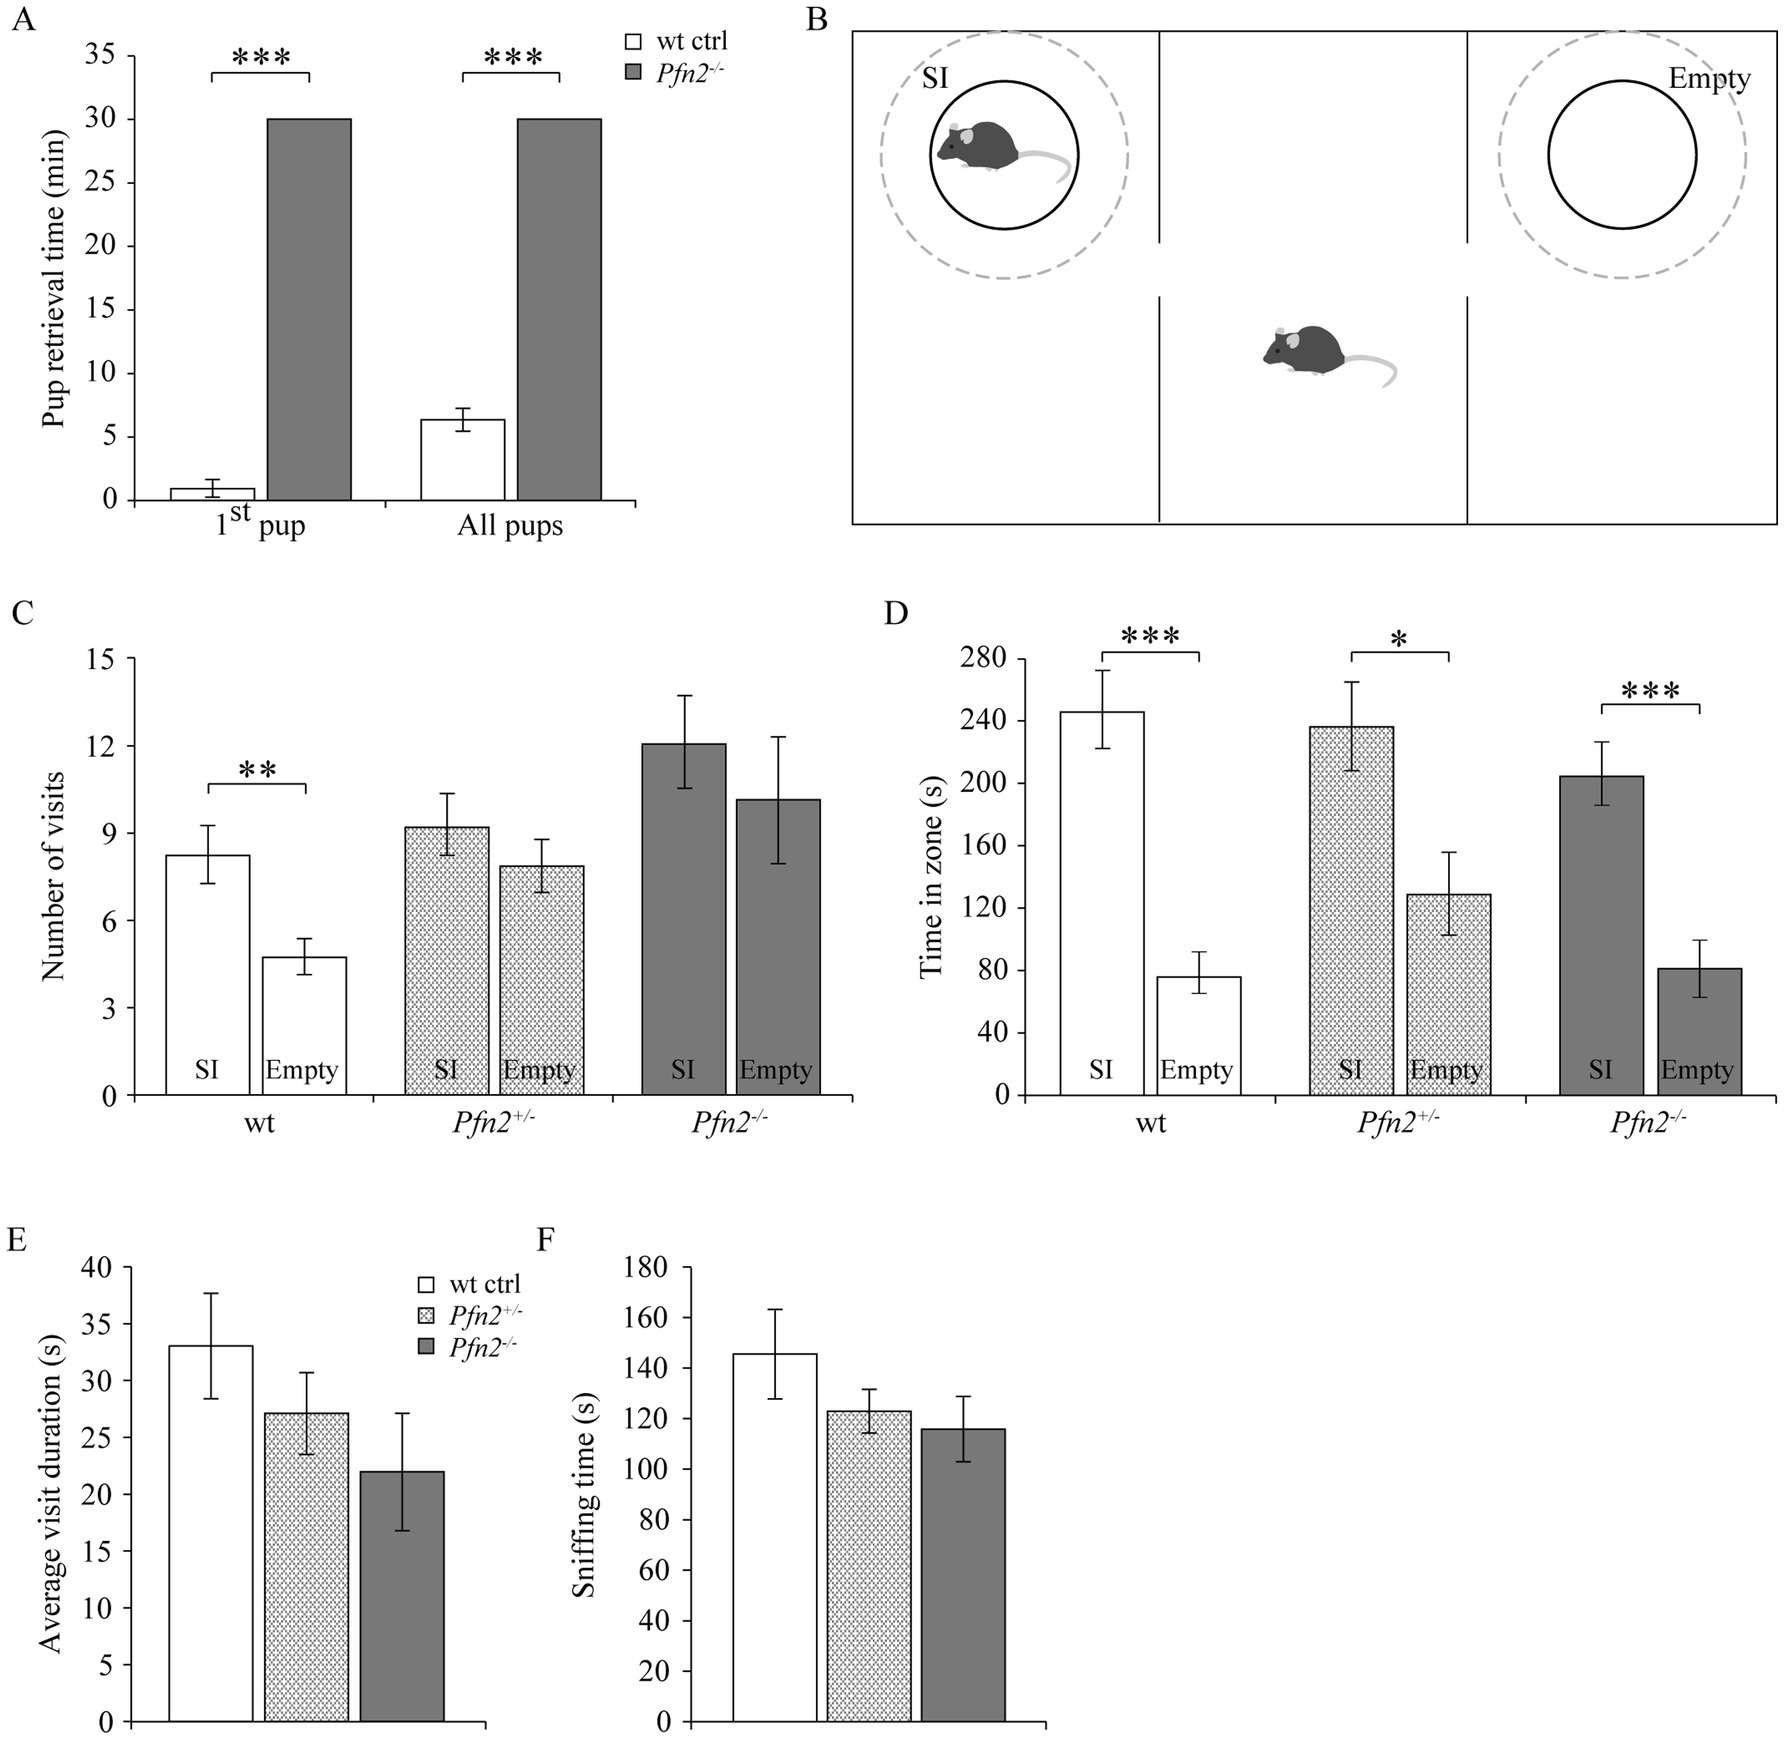
Figure 2. Maternal and social behavior are impaired in Pfn2−/− mice. (A) Maternal behavior: pup retrieval by Pfn2−/− females was completely missing within the experimental time of 30 min, while on average wt control females retrieved the first pup within 1 min (0.8 ± 0.7 min) and the entire litter in 6.2 ± 0.9 min (one-sided t-test, p < 0.001 for both tests). N = 5 wt ctrl and N = 7 Pfn2−/− females. (B) Schematic of the 3-chambered social interaction test. Dashed circles delimit the SI (Social Interaction) zone hosting in our set-up a novel juvenile (~P25) mouse to control for the hyper-excitability of Pfn2−/− mice, and the Empty zone used for social behavior quantification. (C) By number of visits, Pfn2−/− and Pfn2+/− mice showed no significant preference for the SI zone compared to the Empty zone (two-sided t-test, p = 0.4683 and p = 0.3276, respectively) while wt control mice showed a significant preference for the SI zone (two-sided t-test p = 0.0098), indicating social interaction impairment in mutant and heterozygous mice. (D) By the time spent socializing, all genotypes spent more time in the SI zone than in the Empty zone, although Pfn2−/− mice showed the least preference. (E) On average Pfn2−/− mice spent less time per visit in the SI zone compared to wt control mice. Heterozygous mice performed in the middle. (F) Sniffing in the SI zone was reduced in Pfn2 mutant mice compared to wt controls. N = 8 wt ctrl, N = 7 Pfn2+/− and N = 9 Pfn2−/−. *p ≤ 0.05, **p ≤ 0.01, ***p ≤ 0.001.
Suspecting a general social interaction deficit upon reduction of profilin 2 levels, we applied to adult male mice the Social Interaction paradigm in the 3-chambered maze to assess adult sociability (Figure 2B) (Moy et al., 2007). When social interaction between the adult test mouse and a stranger juvenile was assessed, Pfn2−/− mice showed a mild reduction of sociability. Only wt controls showed a significant preference for the Social interaction (SI) zone in terms of number of visits (SI: 8 ± 1 vs. Empty: 5 ± 1), while both Pfn2+/− (SI: 9 ± 1 vs. Empty: 8 ± 1) and Pfn2−/− (SI: 12 ± 2 vs. Empty: 10 ± 2) mice failed to do so (Figure 2C). Wt control mice also showed the highest preference for the social compartment when measuring the time spent in the SI zone compared to the Empty zone (Figure 2D), although also Pfn2−/− and Pfn2+/− mice showed some degree of preference for the SI compartment. The average visit duration of Pfn2−/− mice to the stranger juvenile mouse was tendentially reduced compared to wt controls (Figure 2E), as well as the average sniffing time (Figure 2F). In addition, the interaction of Pfn2−/− mice with the stranger juvenile mouse was qualitatively very different from control mice: direct nose contacts of Pfn2−/− mice with the juvenile mouse were rare, with the mutant mice mostly running around and over the metal enclosure. In a previous study (Pilo Boyl et al., 2007) we reported a striking increase of novelty-seeking behavior in Pfn2−/− mice, which spent more time than wt control littermates to explore novel objects. We suspect that this phenotype might have masked the social behavior in our set-up, where the juvenile mouse has represented an interesting novel object due to its immature sociability and its motility, triggering a novelty-seeking behavior in the Pfn2−/− mice.
2.3 Increased stereotypic behavior in Pfn2−/− miceRitualistic and repetitive behavior, accompanied by resistance to changes, is the second core symptom that characterizes ASD and can be measured in mouse models for ASD as stereotypic behavior (Peça et al., 2011; Schmeisser et al., 2012). We therefore assessed an array of stereotypic behaviors in control and Pfn2 mutant mice after transfer into a novel cage. In this context, no significant differences were observed for self-grooming and digging. However, Pfn2−/− animals showed significantly higher occurrence of circling, and wall leaning stereotypies compared to Pfn2+/− and wt control mice (Figure 3A), indicating a stronger susceptibility to repetitive behavior. Also jerking, a tic-like stereotypic behavior that can have both physiologic or pathologic origin, was significantly increased in Pfn2−/− mice (Figure 3A).

Figure 3. Stereotypic and repetitive behavior is increased in Pfn2−/− mice. (A) Five stereotypic behaviors were measured after transfer in a novel cage environment. Circling (two-sided t-test, p = 0.0442), wall leaning (two-sided t-test, p = 0.0273) and jerking (two-sided t-test, p = 0.0015) were increased in Pfn2−/− mice compared to wt controls, grooming and digging were not changed. N = 10 wt ctrl, N = 11 Pfn2+/− and N = 15 Pfn2−/− mice. (B,C) Y-Maze: spontaneous alternation (SPA) exploration strategy was diminished in Pfn2−/− mice compared to wt controls (two-sided t-test, p = 0.0159) in favor of same arm return (SAR) exploration, performed by 50% of the Pfn2−/− mice (one-sample t-test, p = 0.0122), indicative of a resistance to changes in the mutants. (D) Latency to start exploring the maze by entering the first arm was higher in Pfn2−/− animals compared to wt controls (two-sided t-test, p = 0.0409). N = 11 wt ctrl, N = 10 Pfn2−/− animals. *p ≤ 0.05, **p ≤ 0.01.
Complementary to this general compulsive behavior, we evaluated the resistance to changes in Pfn2−/− mice, using a more sophisticated paradigm. For this purpose, we tested the animals in a Y-maze set-up, where mice typically explore the arms of the maze in sequential order (spontaneous alternation, SPA). Pfn2−/− mice displayed decreased SPA (Figure 3B), and while in our experiment no control mouse ever returned to the same arm (SAR), about 50% of the tested Pfn2−/− mice showed this repetitive behavior (Figure 3C). Pfn2−/− mutants also showed a marked deficit in decision making, as suggested by the longer latency to initiate exploration (Figure 3D). These data suggest a propensity to repetitive behavior and an increased resistance to changes in Pfn2−/− mice.
2.4 Altered vocalization pattern in Pfn2−/− pupsASD typically emerge within the first 2 years after birth and crying behavior of babies is the first way of communication in humans. Atypical crying behavior has been reported in incipient ASD infants, often resulting in a negative response of the mother (Esposito and Venuti, 2009). In mouse newborns, up to 8–9 days after birth, “crying” behavior is an important communication pathway, triggered by separation distress. Separated pups emit ultrasonic calls in the 30–110 kHz frequency range to attract their mother’s attention. We monitored ultrasonic vocalizations (USV) from P7 pups and found increased number of USVs in Pfn2−/− pups compared to wt controls (Figure 4A, medians Pfn2−/− males: 592, wt males: 165; Pfn2−/− females: 990, wt females: 311 calls/5 min). Similar observations have been reported in other mouse models of autism (Scattoni et al., 2009; Tsai et al., 2012). Detailed analysis of the USV traces revealed that, despite Pfn2−/− and wt control littermates displaying a collection of vocalizations of similar shape and frequency, Pfn2−/− pups communicated with a more monotonous vocalization pattern, with persistent use of long (20–90 ms), sometimes interrupted, calls in the middle range of US frequencies (<70–75 kHz) and rather flat frequency modulation (examples shown in Figure 4B). Pfn2−/− male and female pups showed, respectively, a 6- and 4-fold median increase of this type of “flat calls” compared to wt control littermates (Figure 4C, medians Pfn2−/− males: 144, wt males: 22.5; Pfn2−/− females: 216, wt females: 49 flat calls/5 min). In Pfn2−/− mutants these “flat calls” were often arranged in particularly long trains of calls that were uniformly spaced (with a regular inter-call interval of 150 ± 10 ms, see Supplementary Figure 2) and more intense (<−50 dB, darker gray tone). In comparison to wt control littermates, Pfn2−/− male and female pups presented significantly higher number of long trains of calls composed of more than 10 of these monotonous “flat calls” (Figure 4D). About 50% of Pfn2 mutant pups presented one or more very long trains of over 20 “flat calls,” while none of the control mice showed this behavior (call train example in Supplementary Figure 2). Vocalization patterns are usually made of groups of 2 or 3 closely spaced calls (with short inter-call intervals, <50 ms), within which frequency variations and harmonics are seen. We observed an increased group size and extended group of calls duration in both Pfn2−/− males and females compared to wt control littermates (Figures 4E,F).

Figure 4. The ultrasonic vocalization pattern in Pfn2−/− pups is more monotonous. (A) Box plot representing the total number of US calls from P5-P7 Pfn2−/− and wt control pups isolated from the nest in 5 min recording time. The median for Pfn2−/− pups is more than 3-fold the median of wt controls (Mann–Whitney U test, p = 0.0642 for males and p = 0.0083 for females). (B) Graphic representation of two sample flat call traces, one continuous and one interrupted. Of note the uniform frequency below 70 kHz and the length (90–100 ms). (C) Box plot representing the number of flat calls from Pfn2−/− and wt control pups in 5 min recording time. The median for Pfn2−/− pups is about 6-fold the median of controls in males and 4-fold in females (Mann–Whitney U test, p = 0.0231 for males; p = 0.0051 for females). (D) The number of trains with more than 10 calls per mouse was strongly increased in Pfn2 mutants compared to wt controls (Mann–Whitney U test, p = 0.0062 for males; p = 0.0120 for females). (E) The average size of the group of calls (number of shorter calls with inter-call time < 50 ms) was increased in Pfn2−/− compared to wt control pups (two-sided t-test, p = 0.0087 for males; p = 0.0298 for females). (F) The average duration of group of calls was higher in Pfn2−/− compared to wt control pups (two-sided t-test, p = 0.0351 for males; p = 0.0542 for females). N = 16 wt ctrl and N = 11 Pfn2−/− males, N = 13 wt ctrl and N = 12 Pfn2−/− females. *p ≤ 0.05, **p ≤ 0.01.
In summary, Pfn2−/− pups appeared to be in distress when separated from the mother and engaged in a despair calling behavior with increased calling and reduced frequency modulation (monotony) compared to control pups.
2.5 Motor coordination impairment in Pfn2−/− miceIn addition to the core symptoms and the possible communication deficits, impaired motor coordination is often found as a comorbidity in ASD (Fournier et al., 2010). We tested basic motor performance and coordination in Pfn2−/− mice using a fixed rotation speed RotaRod paradigm, while we assessed motor learning by constantly increasing the rotation speed. In older Pfn2 mutants, motor performance and coordination at fixed low rotation speed was significantly impaired (Figures 5A,B), while younger mutant mice did not show significant deficits (Figures 5C,D). Motor learning, on the other hand, was unaffected at all ages in Pfn2−/− mice, in line with previous findings in the conditioned learning paradigm (Pilo Boyl et al., 2007). Thus, Pfn2−/− mice showed an age dependent impairment of motor performance that could depend on impaired coordination.
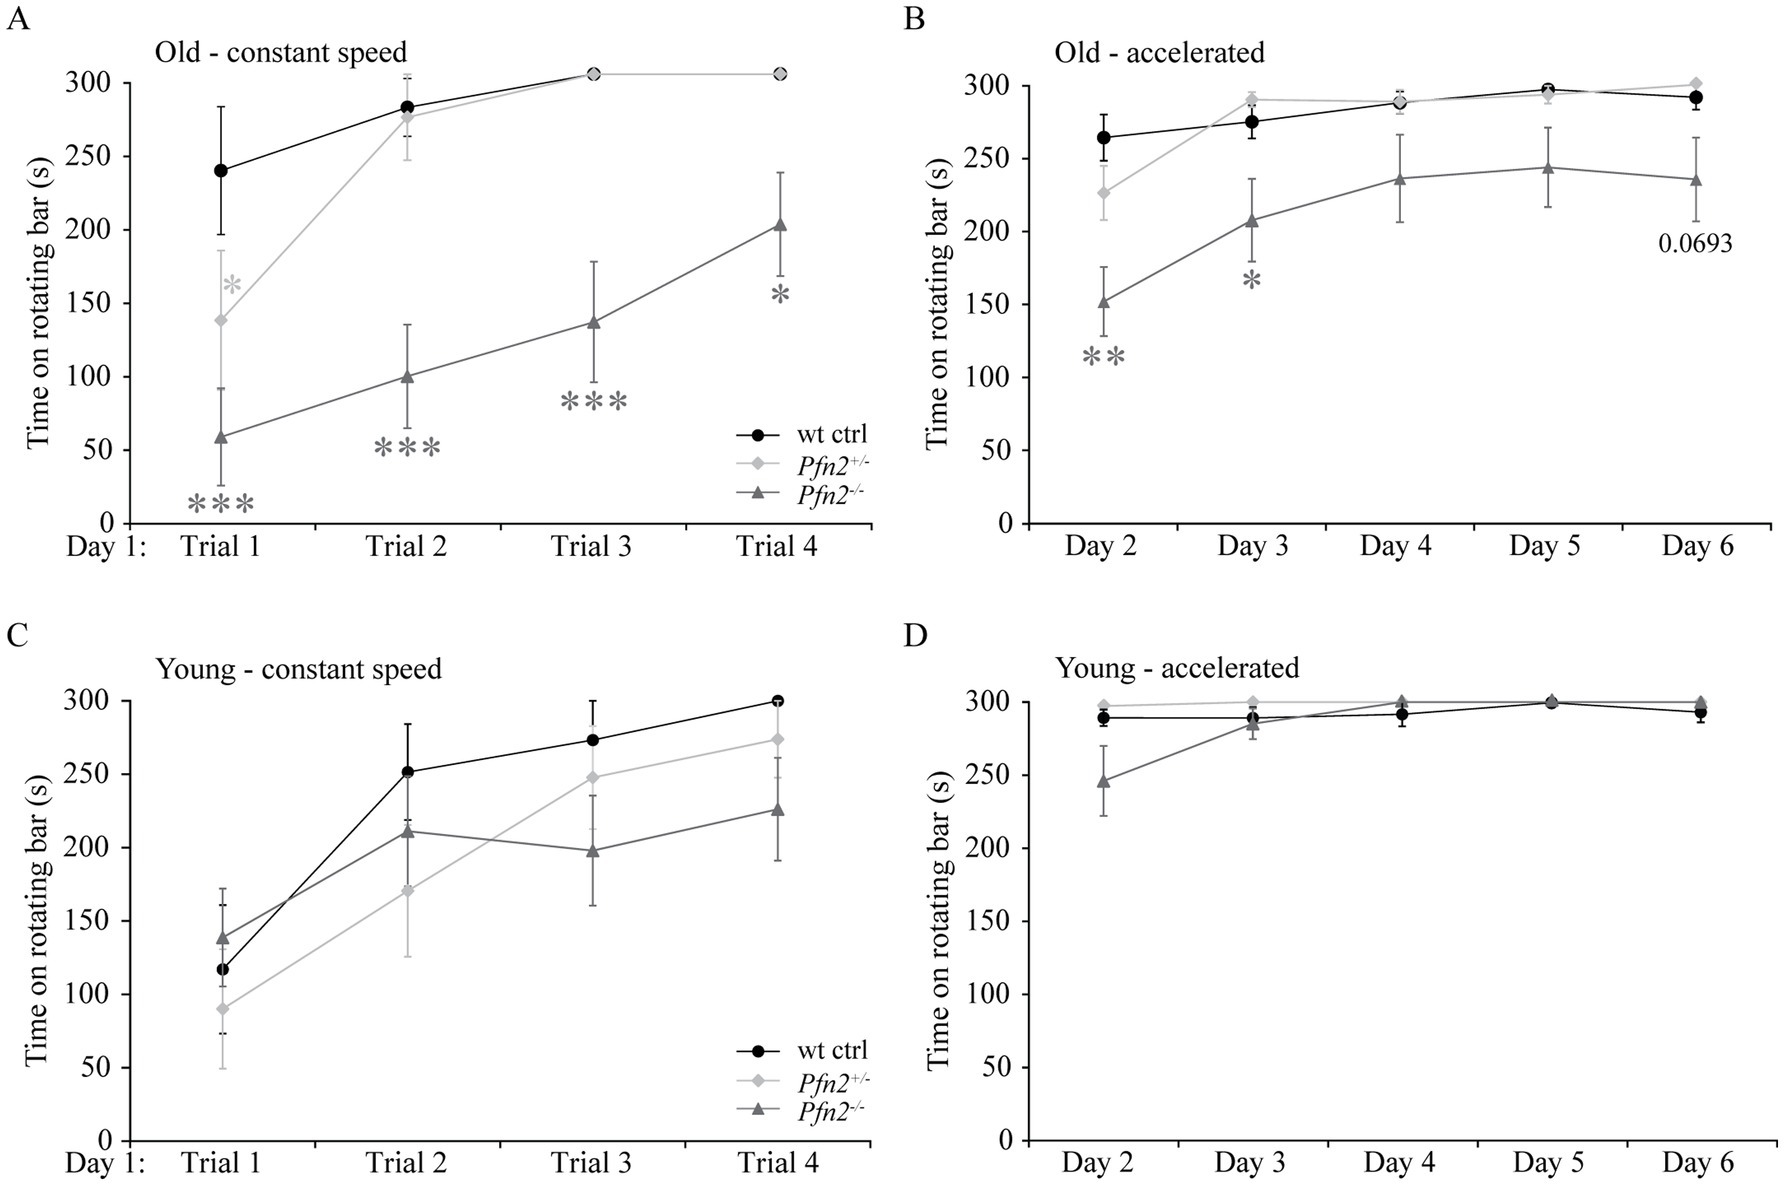
Figure 5. Motor performance decreases with age in Pfn2−/− mice. (A) Old (6–8 months) Pfn2−/− mice showed lower performance on a RotaRod (constant speed, 3 rpm) than wt controls (two-way ANOVA with repeated measures, genotype effect F(2, 25) = 19.09, p < 0.0001; Tukey’s post-hoc test for Pfn2−/− vs. wt control: Trial 1, p = 0.0001; Trial 2. p = 0.0001; Trial 3, p = 0.0004; and Trial 4, p = 0.0487). Pfn2+/− mice showed a motor deficit only in Trial 1 (p = 0.0425). (B) Old Pfn2−/− mice also showed lower performance on a RotaRod in an accelerated rotation paradigm (3–30 rpm in 300 s: two-way ANOVA with repeated measures, genotype effect F(2, 25) = 6.285, p = 0.0061; Tukey’s post-hoc test for Pfn2−/− vs. wt control: Day 2, p < 0.0001; Day 3, p = 0.0224; Day 6, p = 0.0693). Notably, motor learning remained unaffected [Day effect F(4, 100) = 22.68, p < 0.0001]. (C) In young mice (3–5 months) no significant differences were seen between Pfn2−/−, Pfn2+/− and wildtype mice in the performance at constant speed, as well as (D) in the accelerated Rotarod mode. Represented data are the average of the best performances of the day ± SEM. Old mice, N = 9 wt ctrl and Pfn2−/−, N = 10 Pfn2+/−; young mice N = 11 per genotype. *p ≤ 0.05, **p ≤ 0.01, ***p ≤ 0.001.
Coordination skills were further investigated with the Hanging test, which addresses both muscle strength and coordination between legs and body. The performance of Pfn2−/− mice was markedly impaired at both young (Figure 6A) and older age (Figure 6B). In the group of older mice, the Pfn2+/− animals showed a gene dosage-dependent intermediate phenotype.

Figure 6. Motor coordination is reduced in Pfn2−/− mice. (A) In the Hanging test young (3–5 months) Pfn2−/− mice showed deficits compared to wt controls (two-sided t-test, p = 0.0004) and Pfn2+/− mice (two-sided t-test, p = 0.0018). (B) Older mice (6–8 months) performed in general less well than young mice, but Pfn2−/− mutants again displayed significant coordination impairment compared to wt controls (two-sided t-test, p = 0.0103) and to Pfn2+/− mice (two-sided t-test, p = 0.0207). Heterozygous mice showed an age dependent loss of coordination ability. (C) Independently of the mouse age, muscle strength of the forelimbs was significantly reduced in both Pfn2−/− mice (two-sided t-test, p < 0.0001) and Pfn2+/− mice (two-sided t-test, p < 0.0001) compared to wt controls. When all 4 limbs were engaged, only Pfn2−/− mice were found impaired (two-sided t-test, p = 0.0003), while Pfn2+/− mice performed similarly to wt controls (two-sided t-test, p = 0.0002 Pfn2+/− vs. Pfn2−/− mice). Same animals as in Figure 5 were used. *p ≤ 0.05, **p ≤ 0.01, ***p ≤ 0.001.
To discriminate between muscle strength and coordination, we measured the mice grip strength. While gripping only with the forelimbs depends exclusively on the muscle control and strength, when the mice are allowed to grip with all four limbs, the coordination between fore- and hindlimbs affects the gripping strength. Both Pfn2−/− and Pfn2+/− mice showed about 20% less pulling strength with their forelimbs (Figure 6C, left), suggesting a mild deficit in muscle strength. However, grip strength with all four limbs was reduced only in Pfn2−/− mice (Figure 6C, right), while Pfn2+/− animals were comparable to wt controls, suggesting that the main motor function affected by loss of PFN2 was coordination.
Coordination issues could be spotted already at very early age (i.e., at P10) in Pfn2−/− mice by the characteristic hindlimb clasping when gently lifted by the tail instead of the normal hindlimb outward splaying (Supplementary Figure 3A), a phenotype typically present in mouse models with motor coordination and/or ataxia issues and cerebellar dysfunction (Lalonde and Strazielle, 2011; Yerger et al., 2022). Interestingly, the gait quality was only mildly affected in a foot-printing assay, where we only observed a slightly shorter pace (Supplementary Figure 3B).
Since motor coordination largely depends on cerebellar function, we studied Purkinje cell physiology in Pfn2−/− mice.
2.6 Increased glutamatergic input in Purkinje cells of Pfn2−/− micePurkinje cells (PC) are large inhibitory neurons of the cerebellar cortex organized in a monolayer between the inner granule cells and the external molecular layer, in which they extend their large dendritic arbors. These arbors receive extensive excitatory input from parallel and climbing fibers that generate dense trains, respectively, of simple and complex spikes (Sugimori and Llinás, 1990; Ghez and Thach, 2010). The central part of the cerebellum comprising the vermis region, the spinocerebellum, has been shown to regulate motor execution (Ghez and Thach, 2010).
We performed electrophysiological studies on Purkinje cells. Spontaneous excitatory post-synaptic currents (sEPSCs) recorded from PCs showed a significant leftward shift of the cumulative probability of the inter-event intervals in Pfn2−/− mice, indicating a significant increase of the sEPSCs frequency (Figure 7A), while their amplitude distribution did not change significantly (not shown). Moreover, the paired-pulse ratio (PPR) between pairs of stimuli on parallel fibers with increasing inter-stimulus interval (ISI) was significantly reduced in Pfn2−/− cells between 10 and 50 ms paired-pulse (PP) intervals (Figure 7B), indicative of an altered short-term synaptic plasticity that we can attribute to higher release probability of glutamatergic vesicles, since we have shown in a previous work that synaptic density is not altered in Pfn2−/− mice (Pilo Boyl et al., 2007). To confirm the increased excitatory input from parallel fibers onto PCs, two additional experiments were performed. First, we studied the effect of PFN2 depletion when manipulating the release probability by increasing the extracellular [Ca2+] from 2 mM, in standard control ACSF conditions, to 4 mM. In these conditions, the increase of EPSCs amplitude was 22% larger in Pfn2−/− than wt neurons (Figure 7C, Pfn2−/−: 2.75 ± 0.25 vs. wt: 2.27 ± 0.24-fold increase), indicating that PCs in Pfn2−/− animals experience higher excitatory stimulation. In a second experiment, frequency-dependent plasticity of the parallel fiber-PC synapse was analyzed. Increasing the frequency of stimulation from 0.05 to 0.2 Hz produced a mild potentiation of the EPSCs in both Pfn2−/− and wt control cells (Figure 7D), however, an additional frequency increase up to 1 Hz produced potentiation only in wt control neurons but not in Pfn2−/− cells that reached a plateau at much lower stimulation frequency than wt controls (Figure 7D, linear regressions, dotted lines). These results support the previous findings of a higher basal probability of glutamate release in Pfn2−/− glutamatergic neurons.
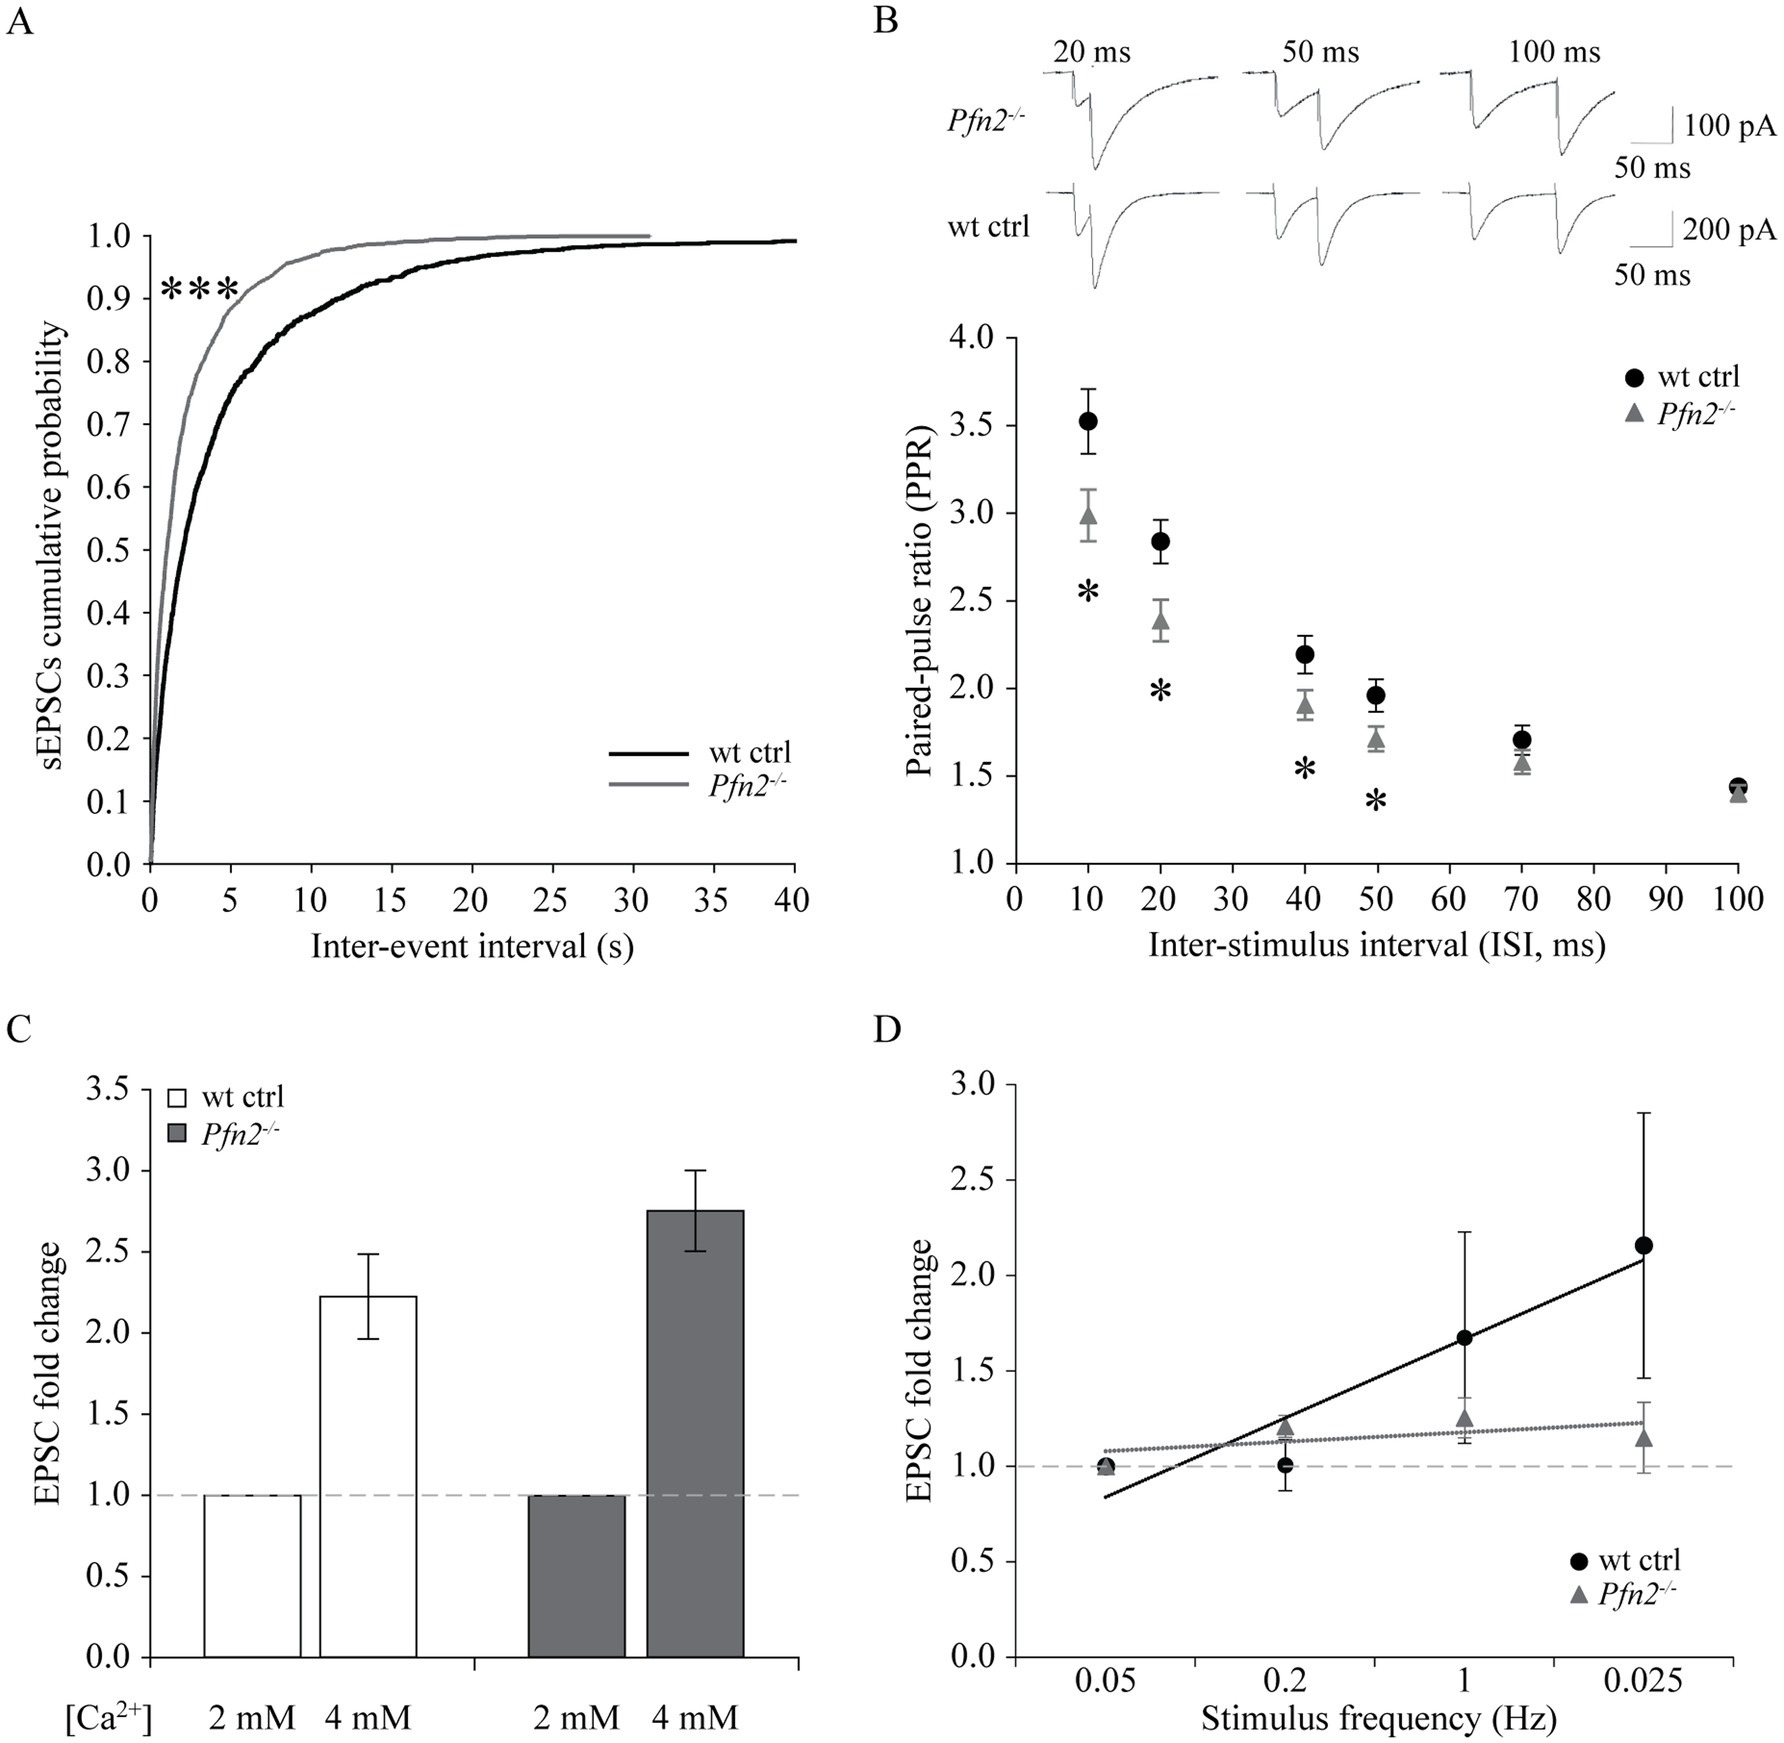
Figure 7. Increased glutamatergic input into Purkinje cells of Pfn2−/− mice. (A) Percentage cumulative frequency graphs of the average inter-event interval (IEI) distribution of sEPSCs recorded in PCs. The leftward shift for Pfn2−/− neurons indicates higher percentage of small IEIs, equivalent to increased frequency of events (Kolmogorov–Smirnov test, p < 0.001). N/n = 2/4 wt ctrl, N/n = 3/6 Pfn2−/− mice/cells. (B) Paired-pulse ratio (PPR) of parallel fiber-Purkinje cell synapses at different inter-stimulus intervals (ISI: 10, 20, 40, 50, 70, 100 ms). At ISI ≤ 50 ms, Pfn2−/− neurons showed significantly reduced PPR compared to wt control, indicating higher probability of synaptic vesicle exocytosis. Upper traces: sample traces of Pfn2−/− and wt control neurons at different ISI. N/n = 3/8 wt ctrl and N/n = 4/10 Pfn2−/− mice/cells. (C) Hyper-excitability of Pfn2−/− neurons in response to extracellular calcium increase. Raising the [Ca2+] from 2 to 4 mM increased the EPSCs by 2.75 ± 0.25-fold in Pfn2−/− neurons, but only by 2.22 ± 0.26-fold in wt control neurons. Dotted line marks the normalized value for [Ca2+] = 2 mM. N/n = 2/6 wt ctrl and N/n = 2/6 Pfn2−/− mice/cells. (D) Normalized frequency-dependent plasticity of evoked EPSCs increasing the stimulation from 0.05 Hz to 1 Hz. Stimulation was then reduced to 0.025 Hz to test the maintenance of the potentiation. Pfn2−/− neurons showed potentiation of EPSCs at 0.2 Hz stimulation but immediately reached a low plateau, while wt control neurons further potentiated their response up to 1 Hz stimulation and maintained it during the final low Hz stimulation. Linear regression analysis shows the different slope of the wt and Pfn2−/− neurons facilitation (respectively, black and grey dotted lines). The dashed grey line indicates the normalized level at the initial 0.05 Hz stimulation. N/n = 2/3 wt ctrl and N/n = 2/3 Pfn2−/− mice/cells. *p ≤ 0.05, ***p ≤ 0.001.
In summary, our results showed that PFN2 is regulating cerebellar physiology by restraining the glutamatergic input in PCs from afferent projections. The findings in the cerebellum are in line with our previous observations in striatum (Pilo Boyl et al., 2007), strengthening the point that PFN2 has a critical function in limiting glutamatergic release in the CNS.
2.7 Age-dependent loss of Purkinje cells in Pfn2−/− micePCs of the cerebellum are a class of neurons particularly vulnerable to excessive glutamatergic input due to their double connectivity with parallel and climbing fibers. Excitotoxicity is predominantly a glutamate-dependent event, mediated by NMDA receptors, which, in conditions of dysregulated glutamate homeostasis, cause excessive and/or prolonged rises in intracellular calcium that trigger neuronal cell death pathways (for a review, see Armada-Moreira et al., 2020). The increased glutamatergic output observed in profilin 2 knock-out mice led us to investigate the structure of the PC layer in 4 and 10 months old Pfn2−/− mice in spinocerebellar slices, the time points aligning with the motor coordination experiments previously described. At 4 months the PC layer in Pfn2−/− mice was essentially normal (Figure 8A), showing no significant difference in the linear density of PCs compared to wt controls (Figure 8B). At this age motor performance was not affected. However, at 10 months of age we observed severe changes in Pfn2 mutant mice: the PC layer in the central part of the cerebellum was highly disorganized, with long stretches completely devoid of PC cell bodies (Figure 8C), resulting in significantly reduced linear PC density (Figure 8D, Pfn2−/−: 2.27 ± 0.23 vs. wt: 4.60 ± 0.17 cells/100 μm). Severe motor coordination and performance deficits were indeed present at this age. These findings also suggest that PCs in Pfn2−/− mice are slowly lost throughout life.
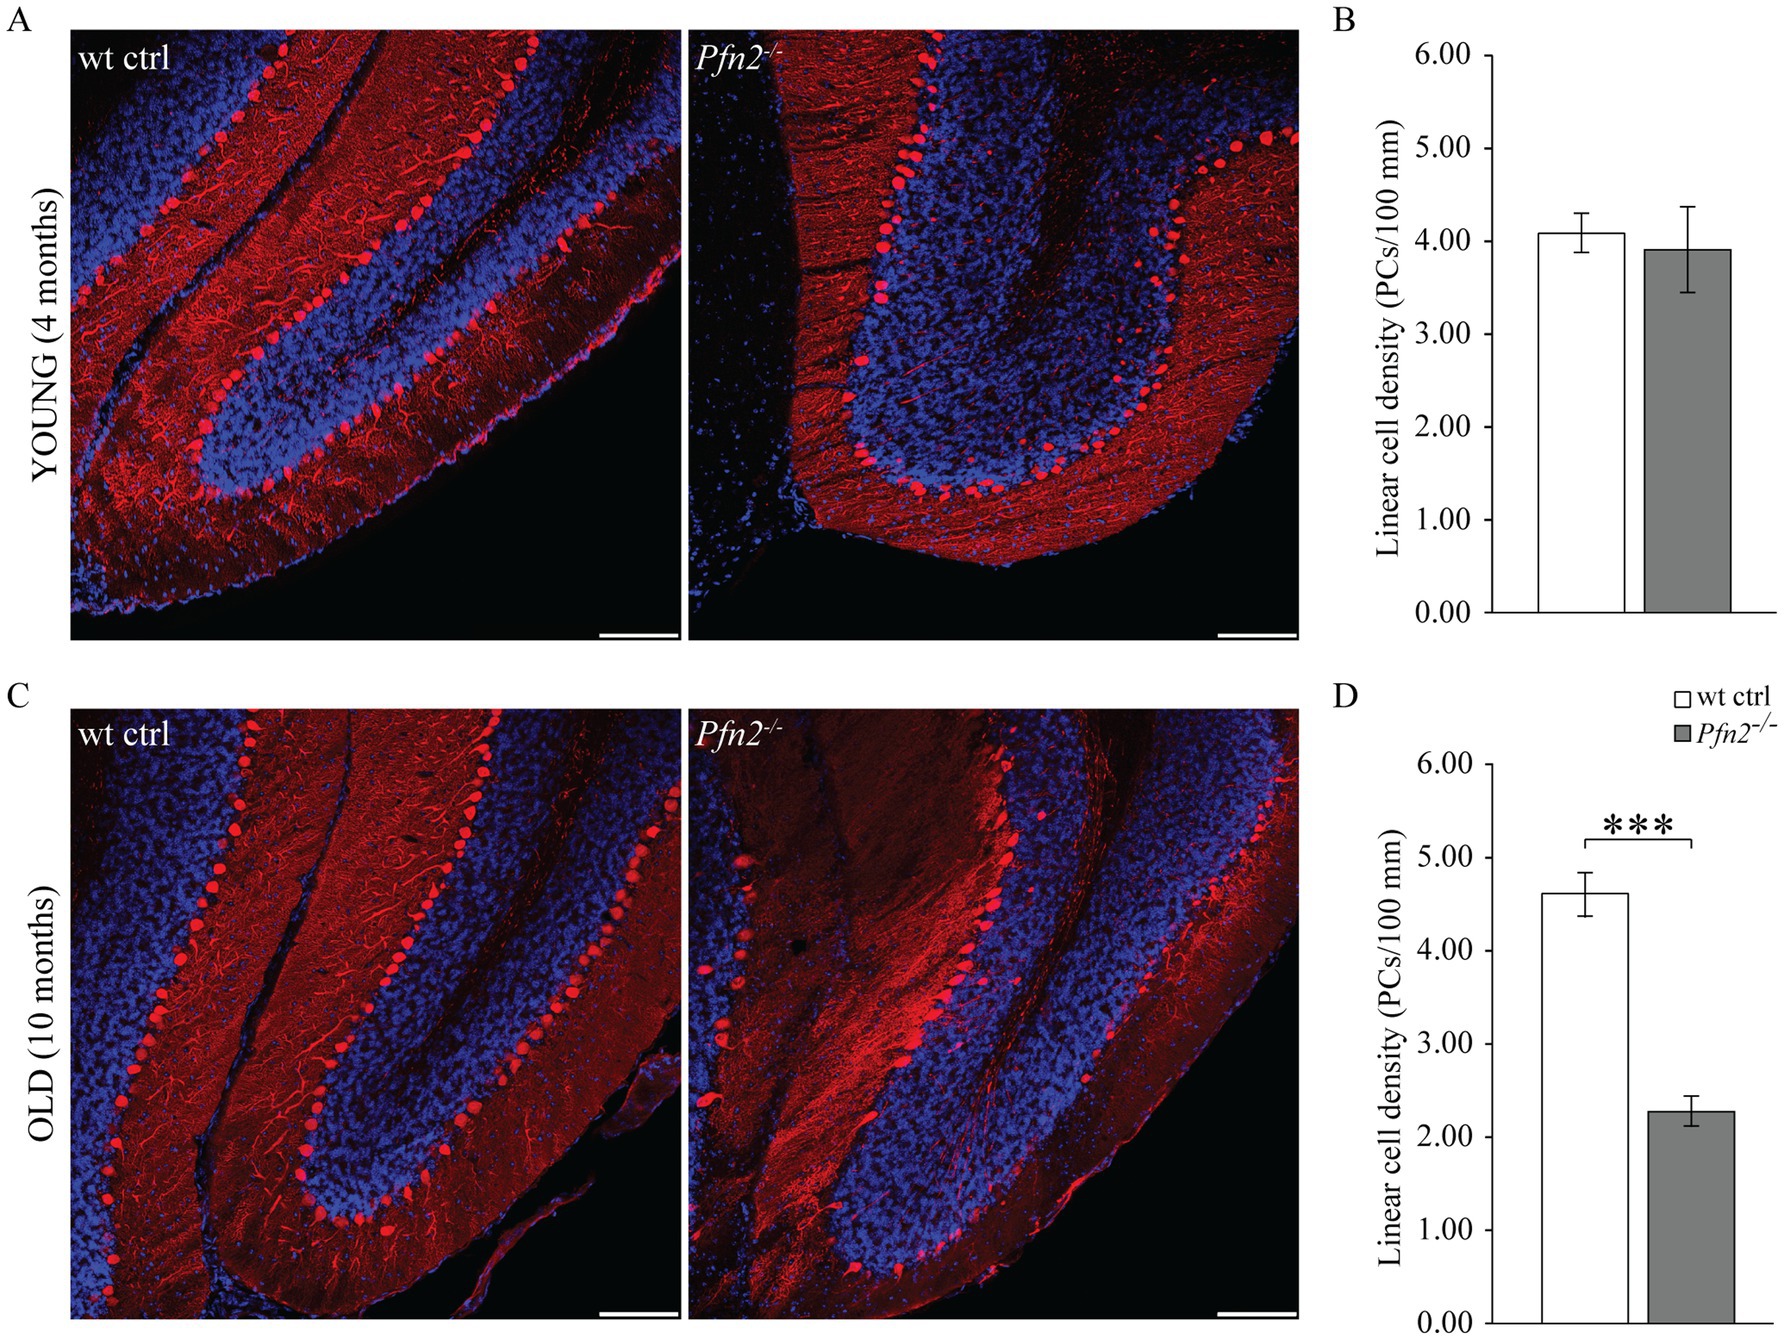
Figure 8. Age dependent loss of Purkinje cells in Pfn2−/− mice. (A) Sample confocal microscopy images of cerebellar folia from 4 months old wt control (left) and Pfn2−/− (right) mice, using calbindin antibodies (red) to specifically identify Purkinje cells and DAPI (blue) for the nuclei to highlight the granule cell layer. (B) Quantification of the linear cell density of Purkinje cells in 4 months old mice: no difference between Pfn2−/− and wt ctrl mice was found. (C) Sample confocal microscopy images of cerebellar folia from 10 months old wt control (left) and Pfn2−/− (right) mice. Large patches of PCs were lost in Pfn2−/− compared to wt control mice. (D) Quantification of the linear cell density of Purkinje cells in 8–10 months old mice: significantly reduced density in Pfn2−/− mice compared to controls (two-sided t-test, p = 2.6*10−8). Scale bar 100 μm. Quantification of N = 3 wt ctrl and N = 3 Pfn2−/− 4 months old and 8–10 months old mice, from at least 2 stained sagittal spinocerebellar slices per mouse. ***p ≤ 0.001.
Interestingly, we also observed in Pfn2−/− cerebella the presence of calbindin positive cells in the internal granular layer (Figures 8A,C right panels), which hint to a late neurodevelopmental migration defect, conceivable according to the proven function of profilins in cell motility (Zhou et al., 2019).
2.8 Imbalanced glutamatergic/GABAergic transmission in the hippocampus of Pfn2−/− miceThe etiology of ASD remains largely unknown, but one hypothesis suggests it could be based on a shift of the excitation/inhibition (E/I) ratio in the brain or in select neuronal circuits (Rubenstein and Merzenich, 2003; Lee et al., 2017). We previously documented increased glutamatergic transmission in Pfn2−/− mice, through higher glutamatergic vesicle exocytosis (Pilo Boyl et al., 2007), and we provided additional findings in this work supporting the possibility that a general increase of the glutamatergic neurotransmission not counterbalanced by an increase of GABAergic inhibition could underlie the autistic-like traits of Pfn2−/− mice. In order to prove this, inhibition needs to be measured. The CA3-CA1 Schaffer collaterals in the hippocampus are a well-characterized brain circuit to address the balance between excitatory and inhibitory synaptic inputs. We first analyzed excitatory transmission in this circuit using three different paradigms. We recorded miniature excitatory post-synaptic currents (mEPSCs) from CA1 pyramidal neurons, and then, while blocking GABAA receptors, we measured the paired-pulse ratio (PPR) and calculated the input–output (I-O) relation in the Schaffer collaterals pathway. Glutamatergic transmission, similarly to all other previously tested circuits, was increased also in the hippocampus of Pfn2−/− mice: mEPSCs were significantly more frequent in Pfn2−/− mice compared to wt controls, as indicated by the leftward shift of the cumulative curve for the inter-event intervals (Figure 9A), with only a mild reduction in their amplitude (Supplementary Figure 4A). By means of extracellular field recordings we showed that the paired-pulse ratio at 40 ms ISI was reduced by 40% (Figure 9B, Pfn2−/− 3.08 ± 0.30 vs. wt 1.80 ± 0.18) while the I-O relation was significantly increased in Pfn2−/− mice compared to control littermates (Figure 9C), indicating that for a similar number of stimulated pre-synaptic fibers, Pfn2−/− mice exhibited an increased post-synaptic response. There was no difference in the stimulation intensity to obtain the same fiber volley in the two genotypes (Supplementary Figure 4B), therefore similar numbers of pre-synaptic fibers responded to the same stimulation level.
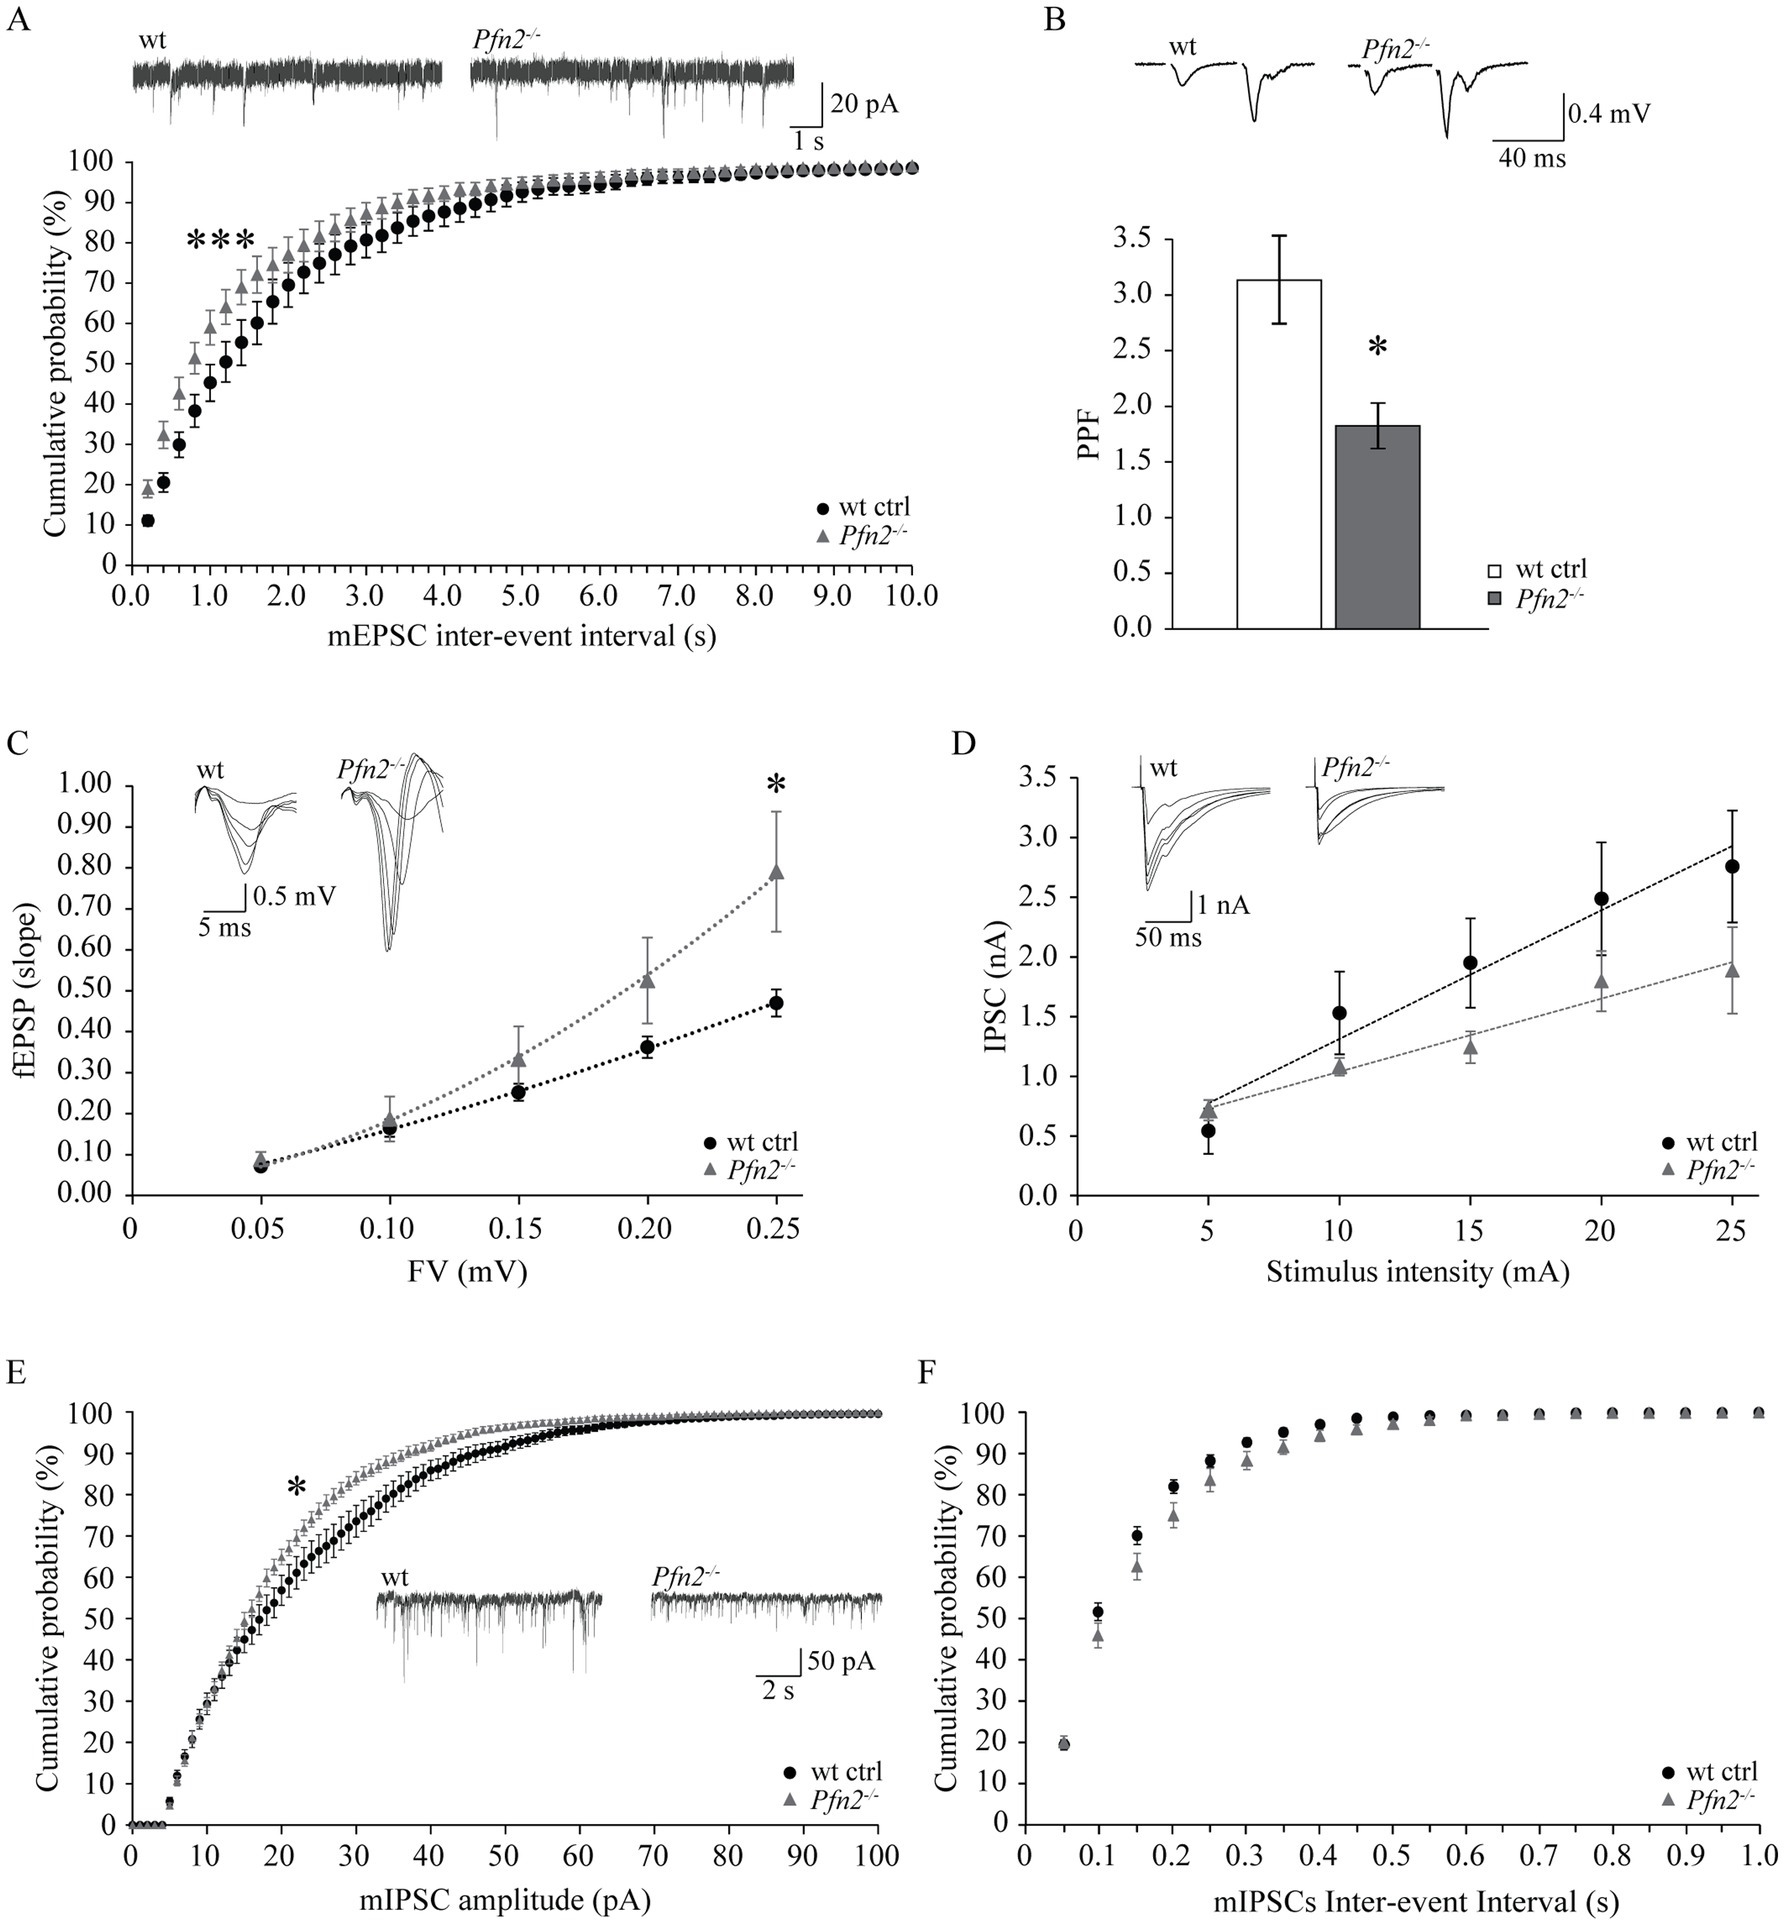
Figure 9. Increased ratio of excitatory versus inhibitory synaptic inputs in the hippocampus of Pfn2−/− mice. (A) Percentage cumulative frequency plot of the inter-event intervals distributions of mEPSCs recorded in CA3 neurons showed increased frequency of events in Pfn2−/− compared to wt control mice (Kolmogorov–Smirnov p = 0.001). Upper traces, sample mEPSCs traces. N/n = 4/7 wt ctrl and N/n = 3/8 Pfn2−/− mice/cells. (B) Field PPR with 40 ms inter-stimulus interval in the Schaffer collaterals of Pfn2−/− mice was significantly reduced by ca. 40% compared to wt controls (two-sided t-test p = 0.0102), indicating higher vesicle exocytosis probability. Upper traces: sample fEPSC response traces with 40 ms ISI. N/n = 6/15 wt ctrl and N/n = 5/9 Pfn2−/− mice/slices. (C) fEPSP input–output (I-O) relation in the Schaffer collaterals was increased in Pfn2−/− mice compared to wt controls, indicating a stronger excitatory transmission. Polynomial regression analysis (dotted lines) shows the higher I-O relation in Pfn2−/− slices compared to wt controls (y = 8.6734x2 + 0.9515x for Pfn2−/− mice, y = 1.9042x2 + 1.4053x for wt mice). Upper traces: superimposed traces from a sample recording at increasing fiber volley. N/n = 7/19 ctrl and N/n = 7/14 Pfn2−/− mice/slices. (D) IPSC I-O relation showed a mild decrease of the inhibitory synaptic transmission in Pfn2−/− pyramidal neurons compared to wt controls. Upper traces: superimposed traces from a sample recording at increasing stimulus intensity. N/n = 3/6 wt and N/n = 3/5 Pfn2−/− mice/cells. (E) Percentage cumulative frequency plot of the amplitudes of mIPSCs shows a significant decrease of inhibitory transmission in Pfn2−/− mice compared to wt littermate controls (Kolmogorov–Smirnov, p = 0.025). Inset traces: sample mIPSCs traces. (F) No difference was found in the inter-event interval of mIPSCs between Pfn2−/− and wt control mice, as shown by the cumulative probability plot. N/n = 3/10 wt and N/n = 4/10 Pfn2−/− mice/cells. *p ≤ 0.05, ***p ≤ 0.001.
Next, we studied inhibitory transmission in the same circuit, measuring miniature inhibitory post-synaptic currents (mIPSCs) in CA1 pyramidal neurons and calculating the I-O relation while blocking AMPA receptors. Contrary to the excitatory drive that was clearly increased, the inhibitory transmission was unchanged or mildly reduced. In the input–output relation experiment, Pfn2−/− pyramidal neurons showed a tendential loss of GABA-dependent currents (Figure 9D), which was confirmed by a significant decrease in the amplitudes of mIPSCs (Figure 9E) with no change in mIPSCs frequencies (Figure 9F), suggesting a prevalent post-synaptic defect in CA1 pyramidal neurons, where PFN2 was shown to interact with gephyrin scaffolds and was proposed to regulate receptor densities (Giesemann et al., 2003; Murk et al., 2012). Overall our data indicate that in Pfn2−/− mice excitatory synaptic inputs are increased while inhibitory synaptic inputs are reduced, thereby suggesting a shift of the E/I balance toward excessive excitation.
3 DiscussionIn this work we report three important findings based on the constitutive Pfn2 knock-out mouse model: (1) that lack of PFN2 causes a variety of autistic-like phenotypes; (2) that increased glutamate release in Pfn2−/− mice alters excitatory synaptic connectivity in multiple circuits, suggesting that this is a general defect of all glutamatergic synapses lacking PFN2; (3) that inhibitory neurotransmission is not upregulated to counterbalance the increased glutamatergic drive in Pfn2−/− mice, thus suggesting a net increase of the excitation/inhibition ratio.
The conventional knock-out of Pfn2 produces conspicuous deficits in maternal/paternal behavior, vocal communication, and motor coordination, with an age-dependent effect on motor performance that correlates with the loss of Purkinje cells in the cerebellum. Therefore, the phenotypic spectrum ranges
Comments (0)