
Remember me
Succinic acid (SA) is a C-4 dicarboxylic acid that has gained great interest because of its use as a precursor for several synthetic resins, chemical reagents, herbicides, fungicides, biodegradable polymers detergents and inks, among other products (Rigaki et al., 2020; Corona-González et al., 2008). Fermentative SA production has been accomplished by using several strains, among which the facultative anaerobes Actinobacillus succinogenes, Basfia succiniproducens, and Mannheiimia succiniciproducens are the most used. The potential for bio-SA market is in the replacement of existing petrol-based SA (Prabhu et al., 2020). Therefore, SA is considered as one of the chemical platforms for the future development at industrial scale, and one of the fastest growing markets (Ercole et al., 2021; Stylianou et al., 2020).
SA is a fermentation end-product of the anaerobic metabolism of A. succinogenes. Starting from a glucose-based substrate, A. succinogenes can split its metabolic flux into two branches: (i) C3 pathway leading to formate, acetate, ethanol, and lactate production, and (ii) C4 pathway for succinate production. Several studies reported that the cellular global demand for ATP and cofactors (NADH produced in the C3 route) controls the glycolytic flux (Almqvist et al., 2016; Bradfield and Nicol, 2014; Vemuri et al., 2002). In anaerobic systems, where glucose cannot be completely oxidized, the microorganisms accumulate metabolic intermediates to maintain the redox balance (Vemuri et al., 2002; McKinlay et al., 2007). The increase of NADH supports SA production, since SA is a highly reduced fermentation product (the production of 2 moles of SA requires 4 moles of NADH), with such glucose conversion to SA being maintained during fermentation, even if cell density achieves an early stationary phase (Corona-González et al., 2008). In some cases, the need of reducing equivalents is ensured by providing additional reduced carbohydrates (e.g., sorbitol) (Chatterjee et al., 2001) or increasing NADH availability (Sánchez et al., 2005; Zhu et al., 2014). Both growth and succinic acid production are limited by culture pH, which tends to decrease following acids accumulation (Corona-González et al., 2008). Another critical factor in the fermentation is the initial high glucose concentration which inhibits cell growth, an effect mainly attributed to osmotic stress causing cell damage (Pateraki et al., 2016b).
Several different models have been reported to describe the fermentative SA production by various microorganisms (wild type or genetically modified), from different carbon sources (in either pure forms or occurring in waste streams) (Song and Lee, 2006; Akhtar et al., 2014). In some cases, the substrate and product inhibition phenomena in the process have been considered in the models. Lin et al. (2008) reported an unstructured model that predicts SA production by A. succinogenes cultivated on glucose and wheat hydrolysates. The model succeeded in describing the inhibitory kinetics caused by both externally added chemicals and the same chemicals produced during fermentation. Corona-González et al. (2008) reported a kinetic study of glucose conversion to SA by A. succinogenes, where substrate and product inhibition phenomena were described by Jerusalimsky equations. Song et al. (2008) proposed a model for the SA production by M. succiniciproducens from glucose using a modified Monod model incorporating inhibition of both glucose and acids accumulated in the fermentation broth. Using another carbon source as glycerol, Li et al. (2010) presented the inhibitory effects by major products in the SA fermentation by E. coli mutants. They proposed a logistic model to describe the overall synergistic inhibitory effects. Vlysidis et al. (2011) reported a model of SA production by A. succinogenes, where a modified Monod equation considered both substrate and product inhibition. Pateraki et al. (2016a) developed unstructured models, including both substrate and product inhibition, that predicted the cultivation of A. succinogenes and Basfia succiniciproducens on a mixture of C5 and C6 sugars used to mime the sugar composition present in spent sulphite liquor. More recently, Rigaki et al. (2020) investigated the dissolved CO2 effect on SA production by A. succinogenes and proposed a double substrate model (glycerol and CO2) in batch reactors, which succeeded in effectively predicting the transient concentrations of glycerol and MgCO3.
In a more general context, a powerful modeling approach is based on System Dynamics tools (Forrester, 1961) allowing to develop process-based models of simplified metabolic pathways avoiding fully explicit fluxomic models' representations (de Falco et al., 2022), but still able to capture the main emergent dynamics of biomass and main metabolites production. Examples of applications of this type of modeling have been proposed to describe the main metabolic dynamics of the yeast S. cerevisiae (Mazzoleni et al., 2015), as well as of two bacterial species of biotechnological interest, such as E. coli and B. subtilis (Carteni et al., 2020). These works highlighted the relevance of self-produced growth inhibitors during cell proliferation that, in long runs of fed-batch cultures, may reduce the maximal achievable cell density. Very recently, de Alteriis et al. (2023) experimentally demonstrated in yeast fed-batch cultures that such inhibitory compound was self-DNA released by the live cells and accumulated in the culture medium.
Moreover, it is known that the production of target metabolic products can be either enhanced or worsened according to intracellular ATP content manipulation (Wisselink et al., 2007), so that ATP can be supplied to regulate the production (Zhou et al., 2009).
Considering the relevance of ATP availability in cell metabolism, it is noteworthy to recall another general effect associated to the cell energy balance. As discussed by de Alteriis et al. (2018), the ATP dynamics during the glycolytic process can lead to an energy crisis in the presence of excess of glucose. This may seem counter-intuitive, but it is explained by the different dynamics of glycolytic reactions, because the first irreversible glucose phosphorylation reaction may lead to a rapid ATP depletion when the glucose-6-phosphate accumulation is not sufficiently processed by the following ATP-forming reactions. This logically explained the occurrence of the metabolic shift between respiration and fermentation in Crabtree positive yeasts and other microbial species (De Deken, 1966; Wolfe, 2005; Paczia et al., 2012), as an avoidance of the conditions determining the ATP energy crisis at high sugar concentration (de Alteriis et al., 2018).
To the authors' knowledge, so far, no modeling studies of bacterial batch cultures have considered the role of the energy balance (in terms of ATP/ADP ratio) in regulating cell growth dynamics. Based on these considerations, in this work we propose a novel process-based kinetic model able to describe the dynamics of A. succinogenes DSM 22257 growth on glucose as substrate at five different concentrations [data from Ferone et al. (2017)], taking into account the crucial role of the ATP/ADP ratio in cell metabolism. Thus, the proposed System Dynamics model of A. succinogenes metabolism addressed the regulation of glucose uptake and its effect on growth, and the related energy demand for maintaining the intracellular pH, on the growth and fermentation performances in this biotechnologically important bacterial species.
2 Materials and methodsThe present model was developed to describe the growth of A. succinogenes and the consequent production of acetic, formic and succinic acid in a batch reactor focusing on the fine-tuned energy balance of the bacterial cell.
Figure 1 represents the simplified metabolism of A. succinogenes in anaerobic conditions on glucose as carbon and energy source leading to the production of succinic, acetic and formic acids, as well as microbial mass, with the explicit representation of the main chemical reactions related to energy production and consumption involved in the processes. Although it is known that other by-products can be formed during glucose fermentation, including ethanol and lactic acid (C3 pathway), the specific strain used in Ferone et al. (2017) (A. succinogenes DSM 22257) does not produce lactic acid under the anaerobic experimental conditions, differently from other succinic producer species such as Basfia succiniproducens (Pateraki et al., 2016a). Regarding ethanol, it cannot be excluded that some ethanol may be produced by A. succinogenes, but in the experiments performed by Ferone et al. (2017), ethanol was not detected (pers. commun. by the authors).
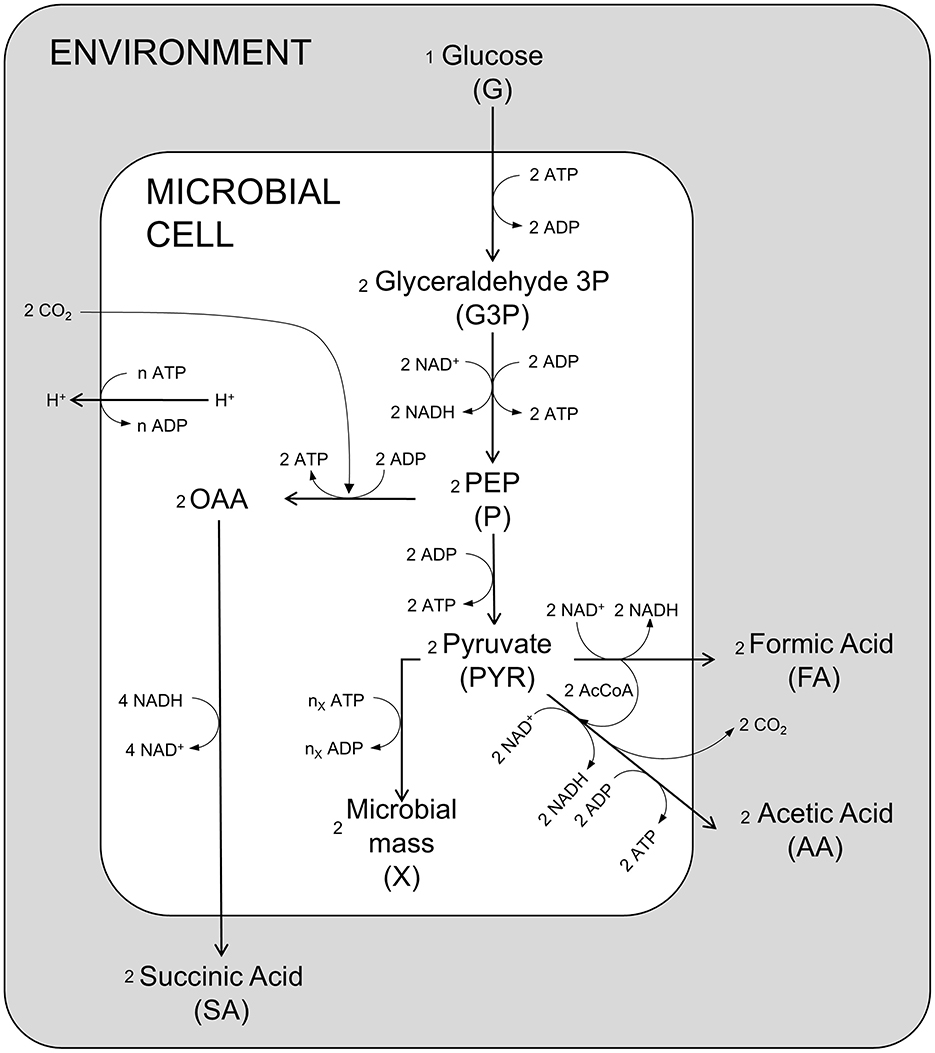
Figure 1. Schematic diagram of the main metabolic reactions of A. succinogenes. OAA oxaloacetate; PEP phosphoenolpyruvate; AcCoA acetyl coenzyme A.
Figure 2 shows a schematic diagram of the implemented processes in the model, providing a simplified representation of the complex network of the metabolism of A. succinogenes growing on glucose, producing the different acids, and where the influence of the different processes on the energy balance is taken into consideration affecting the ATP/ADP ratio inside the cell.
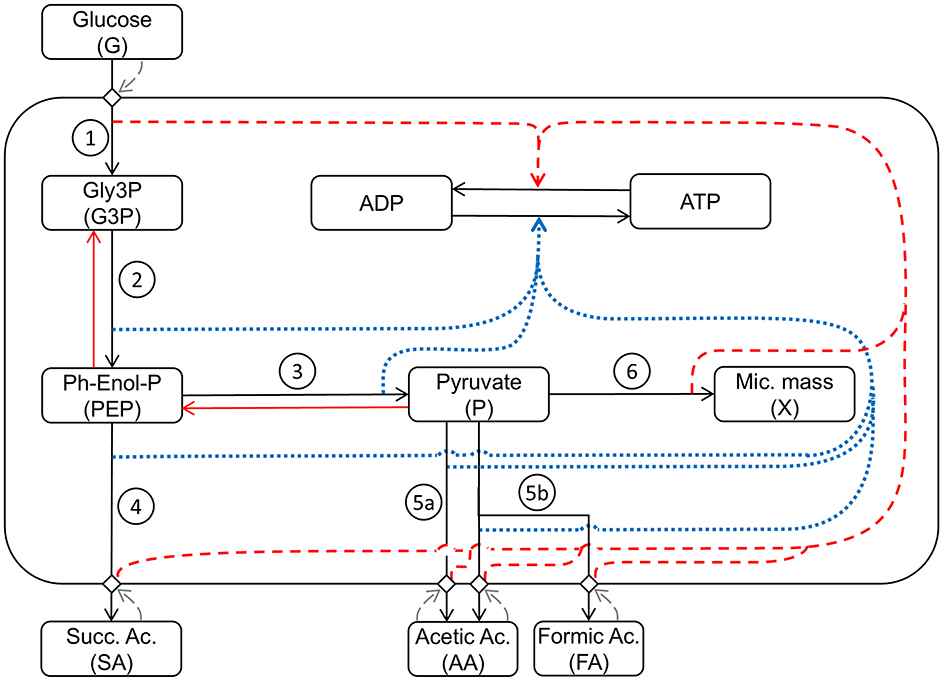
Figure 2. Schematic representation of the mathematical model structure and interactions between the considered metabolic pathways: (1) Glycolysis1: Glucose uptake/G3P production; (2) Glycolysis2: PEP production; (3) Glycolysis3: P production; (4) Production1: succinic acid production; (5a) Production2: acetic acid production; (5b) Production3: acetic and formic acid production; (6) Growth: microbial growth. Black arrows indicate direct metabolic reactions. Red arrows indicate reverse reactions. Blue dotted arrows indicate influence on ATP production. Red dashed arrows indicate influence on ATP consumption. Grey dashed arrows indicate response feedback effects.
The state variables explicitly represented in the model are:
• the carbon source, Glucose (G) in the growth medium;
• the glycolysis intermediates: Glyceraldehyde-3-phosphate (G3P), Phosphoenolpyruvate (PEP) and Pyruvate (P);
• the fermentation products, i.e., Succinic Acid (SA), Acetic Acid (AA) and Formic Acid (FA);
• the microbial mass (X);
• the energy molecules, ATP and ADP.
The key assumption of the model is that the A. succinogenes metabolism level is controlled by the ATP/ADP ratio; in particular, this ratio is assumed to be regulated by growth energy costs and the related costs associated to the production of acids and their secretion. Indeed, the acids produced by fermentation are rapidly released into the reaction environment, but their extrusion from the cell is slowed down over time because they are displaced against a concentration gradient (Fukuzaki et al., 1990; Corona-González et al., 2008).
Further, in the model, specific response curves (RC) of the modeled processes to controlling variables are defined by logistic functions with two parameters, k which defines the slope of the curve and mid which represents the value of the controlling variable for which the RC is half of its maximum (middle). The slope of the logistic curve represents how fast the system responds when the threshold conditions are reached. All response curves, with exception of RCv, assume values between 0 and 1, slowing down the metabolic processes when specific threshold concentrations of the involved state variables are reached.
In the model, seven main metabolic processes and the energetic balance ATP/ADP are taken into account (Figure 2). The first modeled process is the G uptake by the cell population. This is followed by the glycolytic process, which produces G3P in the first energy investment phase. The chemical reactions condensed in this first step are spontaneous, irreversible, and consume ATP, representing a fundamental regulatory point for glycolysis (Mor et al., 2011). The second set of reactions represents the production of PEP and P and the associated ATP production. These reactions are reversible (Boiteux and Hess, 1981) and produce the substrates used in the different fermentation routes leading to SA, AA, and FA. The step for producing SA in the presence of CO2, sees PEP as a reagent and oxaloacetate as starting intermediate product, with consequent production of energy leading to the final conversion into SA (Figure 1). Starting from P, two different fermentative pathways are available: the first promotes the release of CO2 with consequent production of ATP and AA; the second route allows the formation of FA and subsequently, passes through the intermediate AcetylCoA, which produces ATP and AA. Due to the anaerobic conditions, A. succinogenes cannot re-assimilate the produced acids through the respiratory processes; so, they accumulate in the medium.
In the model (Figure 2), the role of pyruvate is essential being assumed as the main building block for the biosynthesis of microbial mass (Wang et al., 2019). As in previous modeling work (Mazzoleni et al., 2015; Carteni et al., 2020), the model also considers the accumulation I in the medium inhibiting all metabolic processes.
The uptake of G and conversion to G3P is formulated as a Michaelis–Menten (MM) kinetics which, being an irreversible process, depends only on the substrate G with a first order dependency on the cell mass (X) that exerts the process. The process is formulated as follows:
GLYCOLYSIS1=vGly1·RCv1·RCv2· GkGly1+G·X·(1-G3PG3Pmax·MWG3PMWX)·RCATP (1)where vGly1 is the maximum rate of the process, kGly1 is the half-saturation constant and MWX represents the molecular weight of A. succinogenes obtained from the composition of its biomass CH2O0.5N0.18 (Samuoelov et al., 1990). MWG3P is the molecular weight of G3P, while G3Pmax, represents its maximum concentration within the cell (McKinlay et al., 2007). RCv1 represents the response curve function to the external concentration of G. In the case of limiting glucose concentration, the cell maximizes the glucose uptake rate, upregulating the phosphotransferase system (ptsG) whereas, at high G concentration, the uptake rate is reduced (Plumbridge, 1998; Neumann et al., 2012). This G uptake regulation is then formulated by two RCs, the first, describing the increased uptake rate at low glucose concentrations, formulated as:
RCv1=1-a11+e(-k1·(G-Gmid1MWG)) (2)where a1 and k1 are, respectively, the response curve affinity coefficient and the slope affinity, MWG is the molecular weight of G, while Gmid1 is the G middle concentration.
A second response curve, RCv2, affects the uptake rate, slowing down the process in cases of high glucose availability, as defined by the following formulation:
RCv2=a2+1-a21+e(-k2·(log(GX)-Rmid)) (3)where a2 and k2 represent, respectively, the response curve affinity coefficient or minimum value to which the response curve tends, and the slope affinity, while Rmid is the glucose/microbial mass ratio middle concentration. In this case, the logistic curve used is defined as a function of the logarithm of the G/X ratio due to the different orders of magnitude of this ratio assumes in different conditions.
The processes requiring ATP or ADP present a specific RCATP, which is a function of the ratio between the available chemical energy and the microbial mass X and it is formulated as:
RCATP =11+e(-k3·(ATPX·MWX-ATPmid)) (4)where k3 is the energy slope affinity, while ATPmid is the ATP middle concentration. The ADP response curve (RCADP) is equivalent to 1 minus the RCATP.
The process leading to the production of PEP in the cell of A. succinogenes, formulated as the MM kinetics of a reversible process, is formulated as follows:
GLYCOLYSIS2=vGly2· G3PkGly2+G3P·X·(1-PEPPEPmax·MWPEPMWX)·RCADP (5)where vGly2 is the maximum rate of this process, kGly2 is the half-saturation constant, MWPEP is the molecular weight of PEP, while G3P is the reaction substrate. As this is a reversible step in the glycolysis process, it is limited by the saturation of the product (PEP), therefore PEPmax represents its maximum concentration.
The glycolytic pathway ends with the production of P described by an MM kinetics in which the only substrate is PEP. The process is formulated as follows:
GLYCOLYSIS3=vGly3· PEPkGly3+PEP·X·(1-PPmax·MWPyrMWX)·RCADP (6)where vGly3 is the maximum rate of the process, kGly3 is the half-saturation constant, MWP is the molecular weight of P, while Pmax represents the maximum concentration of the product, necessary in order to be able to define this process as reversible.
The processes that describe the different fermentation pathways always show MM kinetics, but change the substrate used in compliance with the reactive network. In particular, Production1 promotes the production of SA starting from PEP, Production2 allows to obtain only AA starting from P and finally, Production3 produces both AA and FA having P as substrate. These processes are defined in the following equations:
PRODUCTION1=vP1·PEPkP1+PEP·X·RCADP (7) PRODUCTION2=vP2·PkP2+P·X·RCADP (8) PRODUCTION3=vP3·PkP3+P·X·RCADP (9)where vP1,2,3 and kP1,2,3 are the maximum rate and the half-saturation constant, respectively, of the fermentative process considered.
Cell duplication in the bioreactor is described by Growth process which exhibits P-dependent MM kinetics as a substrate. The process is described by the following equation:
GROWTH=vG· PkG+P· X·RCATP·RCG (10)where vG and kG are the maximum rate and the half-saturation constant, respectively. RCG is the growth metabolic response curve which is a function of the external concentration of G and which inhibits it in conditions of lack of nutrients. The response curve is then formulated as:
RCG=11+e(-k4·(G-Gmid2MWG)) (11)where k4 is the slope affinity, while Gmid2 is the G middle concentration at which the phenomenon begins to become more relevant to the point of inhibiting the growth process.
Based on the above model description, the following eleven mass balance equations are defined:
dGdt=-GLYCOLYSIS1 (12) dG3Pdt=+νG3P·GLYCOLYSIS1-GLYCOLYSIS2X (13) dPEPdt=+νP·GLYCOLYSIS2-GLYCOLYSIS3-PRODUCTION1X (14) dPdt=+νPyr·GLYCOLYSIS3-PRODUCTION2-PRODUCTION3-GROWTHX (15) dXdt=ηX·νX·GROWTH-SECRETION (16) dSAdt=+νSA·PRODUCTIO
Comments (0)