
Remember me

Data were collected across 58 sites within 25 agencies certified to provide PBRSS that are delivered by PRS in a state located in Northeastern United States. These agencies were required to follow standard policies and procedures, quality improvement, and data collection and reporting standards as mandated by the Department of Behavioral Health. Agencies varied in the services they provide, with some being purely recovery-oriented (these are often non-profit, independent organizations headed by community leaders), and others offering standard therapy and crisis stabilization (often with a Chief Executive Officer, where the agency may be for-profit or not-for-profit). The use of de-identified data for this study was approved by the Institutional Review Board (IRB).
The state where the study took place certifies PRS that can be reimbursed through Medicaid. Certification involves a 46-h training focused on advocacy (e.g., to promote person-centered support services), wellness and recovery (e.g., assist the individual to identify and build on their strengths and resiliencies; assist individual in identifying basic needs), mentoring and education (e.g., serve as a role model for an individual; educate through shared experience), and ethical responsibility (e.g., recognize and maintain professional and personal boundaries; maintain current, accurate knowledge of trends and issues related to wellness and recovery). Certified PRS then complete a 500-h paid or unpaid internship to gain experience providing services. Following internship, PRS are eligible to take a 75-question multiple choice exam provided by the state’s Certification Board, to become certified. In addition, agencies have used other funding sources when available to pay for PRS, and therefore not all PRS are certified. This may arise, for example, when agencies determine that some PRS may be disadvantaged to get certified if they lack education or if English is a second language.
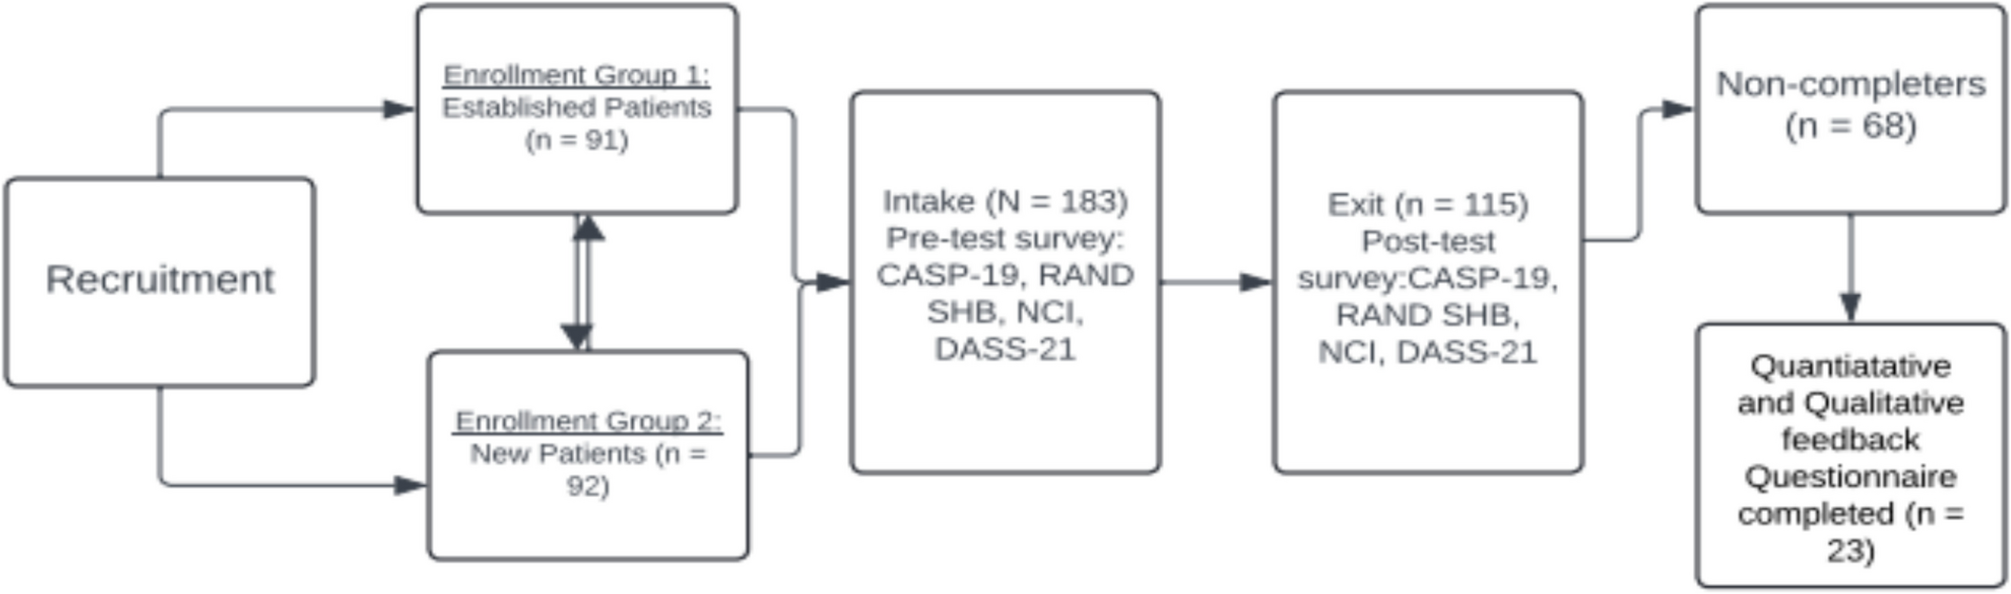
ParticipantsParticipants had to be 18 years old or older and be enrolled in services at one of the sites employing PRS. At baseline (i.e., time point 1 [T1]), N = 1544 completed the Recovery Oriented Measures Survey (ROMS; see measures below). Following baseline, N = 412 completed the ROMS at time point two (T2). Given interest in investigating the impact of peer services over two time periods, only participants who have data at both time points (N = 412) were included in the final sample. Of N = 412, most participants were White (70.6%), male (57.3%), and between the ages of 45 and 64 years (45.4%) (see Table 1 for more specific demographic information).
Table 1 Demographic information (N = 412)ProceduresIndividuals interested in or receiving services at one of the sites employing PRS were eligible if they wished to establish/maintain recovery and were also interested in being connected to a PRS. They were then scheduled for an intake to discuss needs and possible resources available. A second meeting was scheduled where the client completed the ROMS privately (see measures below). The length between the first and second meeting varied from days to weeks, depending on the client’s needs and desire to meet with the PRS. Clients generally completed this measure again 30 days after their second meeting with the PRS, followed by 60 days, and 90 days after that until the client was no longer receiving services.
MeasuresThe Recovery Oriented Measures Survey (ROMS) is a 53-item questionnaire created by the funding agency and stakeholders across the state who were to implement the measure. This questionnaire assessed demographic information (e.g., race, age, income), services sought and received from PRS (e.g., “In which of the following areas are you seeking/have received support from a Peer Recovery Specialist?”), substance use in the past 30 days (e.g., “In the past 30 days, how many times have you used alcohol?”), and utilization of services (e.g., Hospital Emergency Department, urgent care) for mental health and substance use (e.g., “In the past 30 days, approximately how many times did you visit the Hospital Emergency Department for treatment for Alcohol or Substance Use?”). Furthermore, clients were asked their perceptions of how PRS treat them (e.g., “My Peer Recovery Specialist believes that I can grow, change, and recover”) and their self-efficacy in relation to recovery (e.g., “I feel that I can manage my health and recovery process”).
Data preparationIndependent Variable (IV)The IV of interest in this study was “Dosage” of PBRSS, or the areas in which PRS have been of help/provided support to clients. There were 24 response options (Cronbach’s α = 0.767; e.g., mental health services, substance use services, benefits applications, relapse prevention, etc.), with respondents answering yes (1), they received help/support in that area, or no (0), they did not receive help/support in that area. An overall score ranging from 0 to 24 was created per client measuring the number of overall services they received help/support in, with the IV measured as a continuous variable.
MediatorsThere were two mediating factors of interest in this study: (1) client’s perception of PRS relationship/helpfulness (sample item: “My Peer Recovery Specialist helped me with decreasing self-stigma”), with nine items (Cronbach’s α = 0.939), rated on a Likert scale ranging from 1 (strongly disagree) to 5 (strongly agree). Higher scores indicate greater perceived helpfulness of and better relationship with their PRS. (2) Client’s self-efficacy (sample item: “I feel that I can manage my health and recovery process”), three items (Cronbach’s α = 0.857), rated on a Likert scale ranging from 1 (strongly disagree) to 5 (strongly agree). Higher scores on this scale are indicative of a higher sense of self-efficacy. For both mediators, an average was calculated ranging from 1 to 5.
CovariatesThe covariates of interest in this study included: (1) race/ethnicity, measured as a categorical variable of 0 = White and 1 = Non-White or Hispanic, given the small sample size (see Table 1) for other racial groups and ethnicity (i.e., Hispanic, Black, Asian, Multiracial, American Native/ Alaskan Native, and other); (2) sex, measured as a categorical variable of 0 = male and 1 = female (individuals who identified as transgender were removed from analyses due to low sample size, n = 2); and (3) age, measured as a categorical variable of 0 = 18–44 years old and 1 = 45 and over.
Dependent Variables (DVs)The outcomes of interest in this study were as follows: (1) client’s use of substances, consisting of 15 questions asking about substance use with the following stem: “In the past 30 days, how many times have you used…?” Substance categories include alcohol, cannabis, opiates, inhalants, hallucinogens, and an assortment of other substances. Alcohol use was assessed separately, with response options ranked so that 0 = none, 1 = 1, 2 = 2–4, 3 = 5–10, 4 = 11–15, 5 = 16–20, and 6 = more than 20, and an average score of alcohol use frequency created. All other substances (e.g., cannabis, opiates, hallucinogens) were grouped together into an unregulated substance use category and a score computed measuring the maximum frequency of unregulated substance use across these substances (e.g., if a participant reports using cannabis 16–20 times in the past 30 days and all other substance use frequency is lower than that [e.g., using cocaine 2–4 times, etc.], the maximum frequency was counted as 16–20 times, or a ranked score of 5).
(2) Next is client’s use of emergency services, consisting of four items assessing frequency of visits to the ER for either mental health or emotional issues, alcohol or substance use treatment, overdose, or other medical reasons (sample item: “In the past 30 days, approximately how many times did you visit the Hospital Emergency Department for treatment for Mental Health or Emotional Issues?”). Response options were ranked so that 0 = none, 1 = 1, 2 = 2–4, 3 = 5–10, 4 = 11–15, 5 = 16–20, and 6 = more than 20. After ranking, a score per client was computed to assess the maximum frequency of utilizing emergency services across all four items (e.g., if a client endorses the following ranked scores: ER for emotional issues = 1, ER for substance use treatment = 3, ER for an overdose = 2, and ER for a medical reason = 1, the frequency of using emergency services would be coded as a ranked score of 3, or 5–10 times). (3) Client’s use of outpatient services is made of items assessing frequency of receiving outpatient treatment for a physical illness or injury, mental health or emotional issues, alcohol or substance use treatment, or other medical treatment (sample item: “In the past 30 days, how many times did you receive outpatient treatment (non-emergency visits to a doctor or clinic or urgent care) for Physical Illness or Injury?”). Response options were ranked so that 0 = none, 1 = 1, 2 = 2–4, 3 = 5–10, 4 = 11–15, 5 = 16–20, and 6 = more than 20. Similar to the above, a score per client was computed to assess the maximum frequency of utilizing outpatient services across all four items. (4) Client’s overall health is one item rated on a Likert scale of 1 (poor) to 5 (excellent), measured as a continuous variable with higher scores suggesting a better overall health rating. (5) Client’s report of their living situation (e.g., homeless, independent living) was measured as a ranked variable of 0 = homelessness or shelter, 1 = residential treatment or recovery/sober house, and 2 = staying with a friend or independent living. Higher scores on this variable suggest a better living condition.
Analytic planPreliminary analyses examined descriptive statistics, and data were analyzed for assumptions. While 1544 completed the ROMS, the sample in the current study is comprised of the N = 412 participants who completed the ROMS at T1 and T2. Therefore, independent samples t-tests compared baseline scores (substance use, outpatient/emergency services use, health ratings, living situation, self-efficacy, treatment by peers) between those in the current sample to those who were removed from the current study (N = 1132), and Chi-square tests were conducted at baseline for categorical variables (age, race/ethnicity, sex). For independent samples t-tests, Cohen’s d effect sizes were reported, with effect sizes considered small at 0.20, medium at 0.50, and large at 0.80.24 For chi-square tests, Phi coefficient (φ) effect sizes were reported, where φ = 0.1 is considered a small effect, 0.3 a medium effect, and 0.5 a large effect.25SPSS v.28 was used for generalizability analyses.26
Structural equation modeling (SEM)27 using cross-lagged panel models (CLPM)28 were used to test the longitudinal mediational models. Specifically, “half” longitudinal mediational CLPMs were conducted given the two waves of data. CLPMs allow for between differences to be assessed across time (e.g., individuals receiving a higher number of peer-based services show a larger reduction in alcohol use, compared to individuals with low number of services), compared with other models that require more waves of data and assess within-person differences (e.g., random intercepts CLPM).29,30
See Fig. 1 for an example of one of the longitudinal mediational CLPM tested, with X representing dosage of PBRSS, M representing the mediator (e.g., PRS relationship/helpfulness), and Y representing the dependent variable (e.g., alcohol use). Although not included in the figure, the model also included covariates (e.g., age). Subscripts signify the time point in which these variables were measured; subscript one = T1 and subscript two = T2. Complex modeling was conducted using RStudio and the Lavaan package.31 Full Information Maximum Likelihood (FIML) was used as an estimation technique for missing data to estimate the model.32 Each variable was allowed to predict subsequent follow-up assessments of the same variable (e.g., dosage of PBRSS at T1 predicting dosage of PBRSS at T2) to assess autoregressive effects. All possible indirect pathways and effect sizes are reported, as well as standardized path coefficients for all paths. For mediation, steps to test this “half” longitudinal model followed Cole and Maxwell’s recommendations.33 First, a pair of longitudinal tests were conducted to (1) estimate Path a (see Fig. 1) in the regression of M2 onto X1, controlling for M1 and (2) estimate Path b in the regression of Y2 onto M1, controlling for Y1. The product of ab provided an estimate of the mediational effect of X on Y through M. To determine statistical significance of the proposed indirect effect of dosage of PBRSS on the outcome through the mediator, a 95% bias-corrected confidence interval from 5000 generated bootstrapped samples was tested.33 Model fit was evaluated with the comparative fit index (CFI), with higher scores between 0.0 and 1.0 indicating better fit, as well as root mean square error of approximation (RMSEA), with acceptable scores below 0.06.
Figure 1
Example of cross-lagged panel longitudinal model tested. Notes. X1 = independent variable at T1; X2 = independent variable at T2; M1 = mediator at T1; M2 = mediator at T2; Y1 = dependent variable at T1; Y2 = dependent variable at T2; e = residuals. Covariates are not included in the figure to enhance figure clarity
Regarding statistical power, Kline34 recommends using the ratio of observations (participants) to estimated parameters (i.e., paths; N:q) as a guide in establishing statistical power for SEM. Specifically, Kline34 suggests that the N:q ratio should be 20:1, or 20 participants for each estimated path in the model. For this study, the largest model (with covariate[s]) tested included 17 paths, suggesting a sample size of 340, indicating that this study was well powered.
Comments (0)