
Remember me


In our previous study, a single round of AZA treatments (three doses in one week) using the C1498 mouse AML model only resulted in a modest increase in survival, probably indicating that a majority of blasts were still present(Cheng et al. 2018). To ensure full penetrance of AZA treatment to more resistant clones, we continuously treated C1498-implanted C57Bl/6 mice thrice weekly with AZA until survival endpoints were reached. C1498-implanted, AZA-treated mice (C1498-AZA) survived significantly longer than C1498-implanted, DMSO-treated mice (C1498-vehicle) (Fig. 1A, p< 0.0001, Mantel-Cox test, median survival 40 vs. 21 days, respectively). These data are consistent with human AML patients experiencing increased benefit from prolonged AZA treatment beyond initial response (Jeyaraju et al. 2024).
Fig. 1
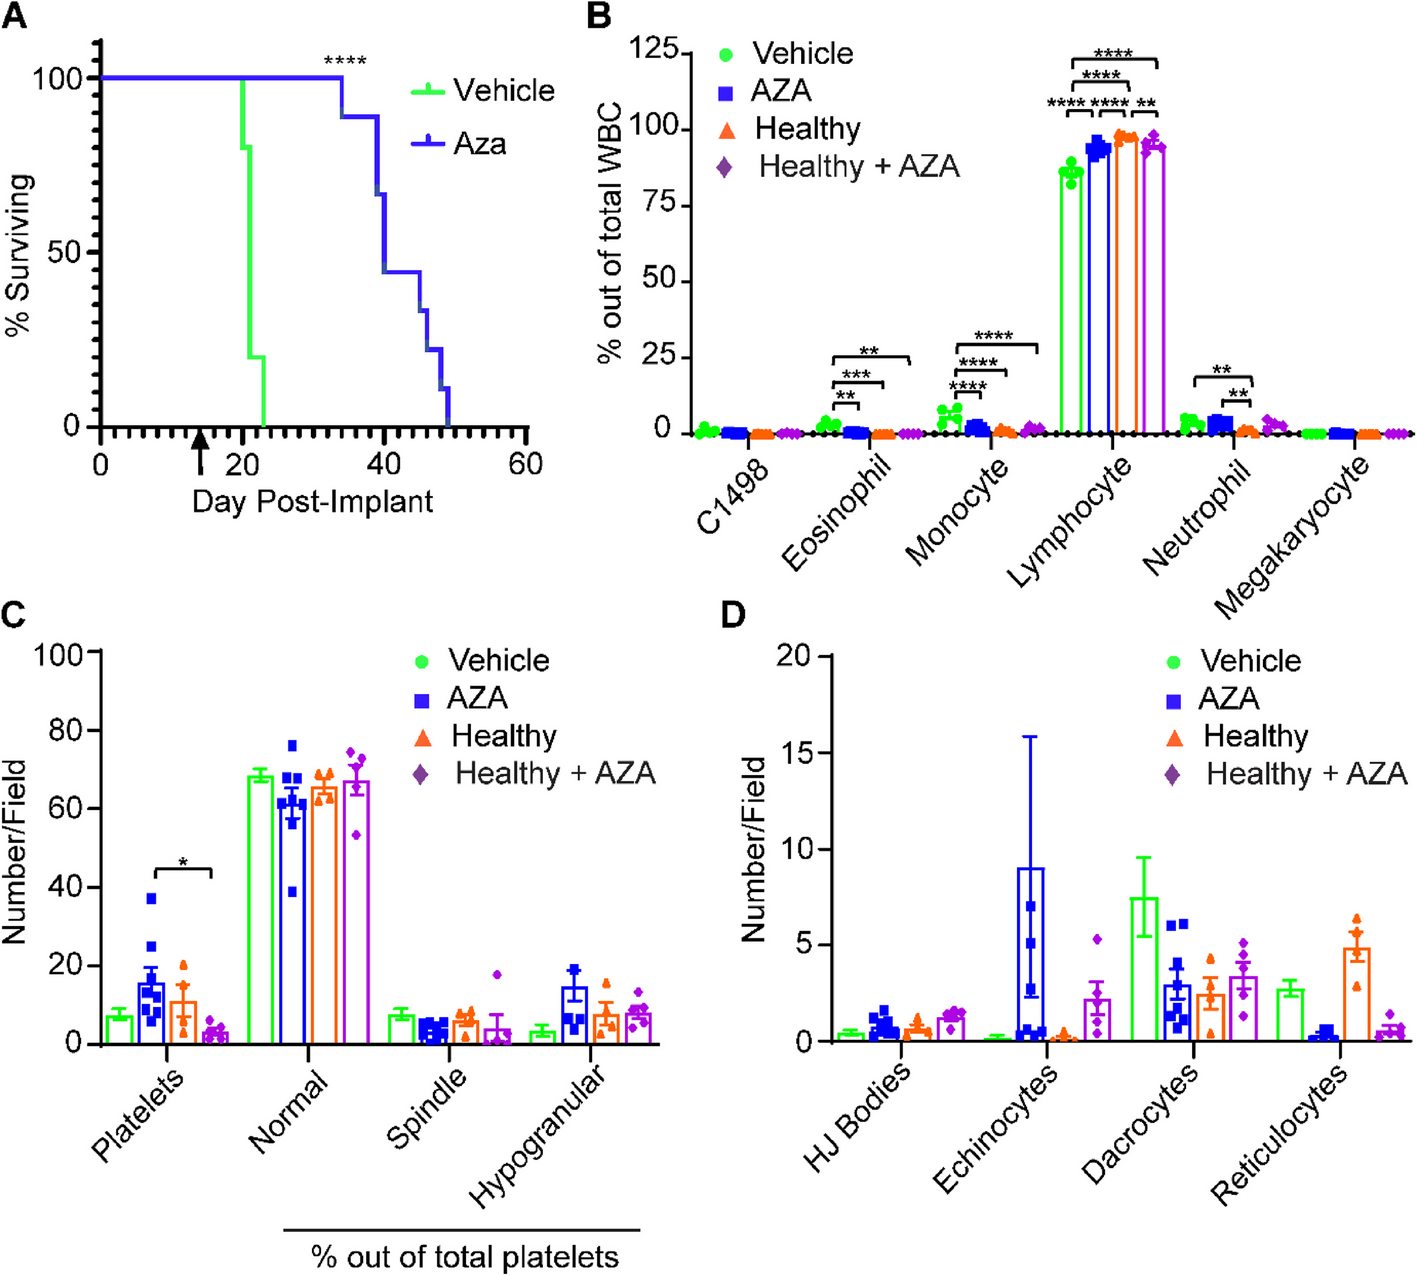
Survival and Hematologic Profiles of Leukemic and Non-Leukemic Vehicle- and AZA-treated Immunocompetent Mice. C1498 leukemia cells (80,000) were implanted in C57Bl/6 mice via tail vein injection. Treatment with DMSO in diluent (Vehicle) (n = 5) or 5 mg/kg/mouse AZA (n = 11) by intraperitoneal injection began on day 3 after implantation and continued thrice weekly until survival endpoints. A Mice were euthanized once they showed signs of terminal disease state and survival was recorded for each mouse and displayed as a Kaplan–Meier curve. Statistical significance was analyzed using the Log-rank (Mantel-Cox) test: ****p < 0.0001. The arrow (↑) indicates the timepoint at which retroorbital blood was drawn to assess hematologic profiles. B Blood drawn at week 2 after treatments was smeared and stained for manual complete blood counts. Blood from non-leukemic, untreated (Healthy) mice and non-leukemic, AZA-treated (Healthy-Aza) was also included. White blood cells (WBC) were counted manually, including C1498, and are presented as a percentage of total WBC counted. C Numbers of platelets and percentages of normal, spindle-shaped, and hypogranular platelet morphologies out of total platelets are presented. D Red blood cell morphologies including the presence of Howell-Jolly bodies (HJ Bodies), echinocytes, dacrocytes, and reticulocytes are presented as numbers counted per field. Statistical significance was analyzed using 2-way ANOVA followed by Tukey’s test for multiple comparisons: *p < 0.05, **p < 0.01, ***p < 0.001, ****p < 0.0001
In our previous study, we also observed that immunodeficient NSG mice implanted with C1498 and treated with a single course of AZA did not survive significantly longer than vehicle-treated mice (Cheng et al. 2018). We repeated this experiment with continuous AZA treatment, as in Fig. 1A, and found that survival of C1498-AZA NSG mice did not differ significantly from C1498-vehicle NSG mice (Figure S1 A, p = 0.0816, Mantel-Cox test, median survival 38.5 vs. 23 days, respectively).
Hematologic recovery of blood cell types is an important indicator of treatment efficacy and AML remission (Karakas et al. 1998). As it takes approximately three weeks for a minimal number of actively growing C1498 blasts to cause end stage AML, we interpolated that mice should be in remission/peak AZA efficacy after two consecutive weeks of treatment. Peripheral blood was drawn 48 h after the last treatment and complete blood counts (CBC) were conducted (Fig. 1B). At this timepoint, few C1498 blasts were observed in C1498-AZA and C1498-vehicle mice. C1498-AZA blood showed significantly decreased percentages of eosinophils and monocytes and an increased percentage of lymphocytes compared to C1498-vehicle mice. However, the percentages of neutrophils remained significantly higher, with lymphocytes concurrently lower, in C1498-AZA mice compared to healthy mice. Some of these effects may be due the action of AZA independent of the presence of C1498, as healthy mice treated with AZA (Healthy-AZA) showed decreased lymphocytes compared to healthy mice; however, percentages of neutrophils in healthy-AZA mice remained consistent with healthy mice (Fig. 1B). These results possibly indicate a mechanism of AZA efficacy or an indication of incomplete hematologic recovery at this timepoint. Interestingly, week 2 blood smears from C1498-AZA NSG mice were almost completely devoid of WBC. In C1498-vehicle NSG mice, blood was populated mostly by monocytes and neutrophils (Figure S1B) as is to be expected in this immunodeficient strain (Katagiri 2017). These data may indicate that AZA treatment removes immunosuppressive, myeloid cell types, but a lack of functional lymphocytes in NSG mice impedes the clearance of C1498 leukemia cells.
Total platelets did not differ significantly between C1498-vehicle, C1498-AZA, or healthy mice but total platelets were significantly lower in healthy-AZA mice compared to leukemic mice treated with AZA (Fig. 1C), this highlights another effect that is specific to AZA treatment in the context of leukemia. Platelets in all groups were largely of normal morphology (Fig. 1C). Although not significant, several C1498-AZA blood smears showed a high number of echinocytes (Fig. 1D). Because they are also found in high numbers in healthy-AZA mice, this is likely due to a direct effect of AZA treatment on RBCs as echinocytes can be found after exposure to other chemotherapeutic agents (Keating 2012;, Kobayashi 2020). Overall, these data suggest that therapeutic doses of AZA, leading to remission in leukemic mice, re-establishes profiles resembling a healthy blood microenvironment.
AZA treatment generates an anti-leukemic immune transcript profile in blood and decreases overall immune transcripts in the spleenBecause the bone marrow microenvironment is key in leukemogenesis and AML progression, human datasets comprised of bone marrow mononuclear cells (typically > 80% leukemic blasts) before and after HMA treatment have been analyzed for biomarkers of HMA efficacy, but no significant gene expression changes have been found (Konopleva and Letai 2018)(GSE77750 AML samples only, GSE116567). Studies of non-leukemic blood and spleen cells in human AML patients have been largely neglected despite the importance of normal immune cells in AZA-mediated cancer control (Cheng et al. 2018; –Ebelt et al. 2020).
To delve more deeply into the phenotypes of normal immune cells and other blood components in peripheral blood and spleens in our model, RNA isolated from whole blood or whole spleen samples from C1498-vehicle, C1498-AZA, or healthy, immunocompetent mice was assayed for gene expression using a panel of 543 immune-related genes. The genes in this panel focused on cell activation, cytokine production, adaptive immune response, immune effector processes, activation and regulation of the immune response, and leukocyte differentiation (Figure S2).
Peripheral blood cell types were enumerated by manual CBC in Fig. 1B, however deconvolution of cell types from bulk RNA provides transcriptomic differences in WBC phenotypes (Fig. 2). Hierarchical clustering of blood samples reveals that C1498-AZA cell type scores typically group with Healthy cell type scores, while C1498-vehicle scores cluster separately (Fig. 2A). When comparing specific cell type scores, C1498-AZA blood had significantly increased CD8 + T-cell, decreased Th1 cell, decreased regulatory T-cell (Treg), and decreased neutrophil scores compared to C1498-vehicle blood (Fig. 2B). In spleens, Healthy and C1498-vehicle samples cluster together overall regarding cell type scores (Fig. 2C). C1498-AZA mice had significantly lower scores for most cell types analyzed including CD45, T, CD8 + T, Th1, cytotoxic, exhausted CD8 +, Treg, B, macrophages, neutrophils, and CD56 dim NK cells (Fig. 2D). This is likely due to overall low reads for all AZA samples in the spleen specifically (Figure S3 A, B). This is not surprising, as AZA has been shown to significantly affect HSC and leukemic stem cells (LSC) in the spleen, causing their differentiation and death (Kornblau et al. 1999;, Kovacsovics et al. 2018). Analysis of immune subsets in blood following AZA treatment, however, appears to decrease the frequency of suppressive cell type scores (neutrophils and Treg), while increasing anti-tumor cell type scores like CD8 + T-cells, which is conducive for anti-leukemic immunity.
Fig. 2
In-depth Analysis of Immune Cell Abundance and Phenotypes by Gene Expression. C1498 (8 × 10⁴ cells) were implanted in C57Bl/6 mice via tail vein injection. Treatment with DMSO in diluent (Vehicle) (n = 4) or 5 mg/kg/mouse AZA (n = 8) by intraperitoneal injection began on day 3 after implantation and continued thrice weekly. Forty-eight hours after the 6.th treatment (week 2) mice were euthanized after harvesting whole blood and whole spleens. Whole blood and spleen were also isolated from a non-leukemic, untreated (Healthy) mouse. mRNA was isolated from blood and spleen and probed for gene expression using the Mouse PanCancer Immune Profiling Panel. Cell type scores were calculated from bulk mRNA expression per sample and are presented as heatmaps and bar graphs for both blood (A, B) and spleen (C, D). Statistical significance was analyzed using 2-way ANOVA followed by Tukey’s test for multiple comparisons: *p < 0.05, **p < 0.01, ***p < 0.001, ****p < 0.0001
Gene pathway alterations in blood induced by AZA treatment are largely anti-tumorigenicUsing gene expression data from the large-scale immune panel assay, weighted scores were developed for multiple immune response pathways (Fig. 3). In blood, C1498-vehicle and Healthy samples clustered together regarding overall pathway scores (Fig. 3A). Compared to both C1498-vehicle and Healthy blood samples, C1498-AZA mice scored significantly higher in adhesion, apoptosis, B-cell functions, cancer progression, CD molecules, cell cycle, leukocyte functions, macrophage functions, senescence, T-cell functions, tumor necrosis factor superfamily, and transporter functions. In dendritic cell and NK cell functions, C1498-AZA samples scored higher than C1498-vehicle samples, but were statistically comparable to Healthy. C1498-AZA mice scored significantly lower than C1498-vehicle and Healthy in adaptive immune pathways, basic cell functions, chemokines and receptors, cytokines and receptors, humoral immune pathways, inflammation, innate immune pathways, and interleukins. In the complement pathway and MHC signaling, C1498-AZA samples scored significantly lower than C1498-vehicle but not Healthy (Fig. 3B). In spleens, almost every pathway score was significantly lower in C1498-AZA samples compared to both C1498-vehicle and Healthy samples (Fig. 3C, D), again likely due to overall reduced reads for each gene (Figure S3B).
Fig. 3
In-depth Analysis of Immune Pathways by Gene Expression. Expression levels of genes from the Mouse PanCancer Immune Profiling Panel were used to calculate scores for various immune-related pathways. Pathway scores are presented as heatmaps and bar graphs comparing non-leukemic, untreated (Healthy), DMSO-treated leukemic mice (Vehicle), and AZA-treated leukemic mice (AZA) for blood (A, B) and spleen (C, D) samples. Statistical significance was analyzed using 2-way ANOVA followed by Tukey’s test for multiple comparisons: *p < 0.05, **p < 0.01, †p < 0.001, ‡p < 0.0001
Mirroring the decrease in pro-tumorigenic, immunosuppressive cell type scores in AZA-treated blood, decreased scores in inflammation and innate immune pathways along with increased T- and B-cell function scores appear to indicate an anti-tumor phenotype. There are conflicting data, however, such as decreased scores for adaptive immune signaling and basic cell functions, with increased scores for cancer progression and macrophage functions. These could indicate the persistence of suppressive cell types that decrease the adaptive immune response. A global decrease in pathway scores for C1498-AZA spleen samples also mirrors the downregulation of overall immune cell type scores seen in Fig. 2D. Taken together, these transcriptional profiles highlight the complex changes occurring in the non-cancerous cells of blood and spleen which may explain anti-leukemic AZA efficacy, while others may reflect compensatory mechanisms leading to resistance and relapse.
Differential gene expression analysis identifies common targets in blood and spleen modulated by AZAWhen comparing specific gene expression differences in C1498-AZA to C1498-vehicle blood samples, five distinct genes were significantly, differentially expressed: Anp32b (−2.02), Ccr3 (−1.81), Cfh (1.85), Itgb3 (2.75), and Thbs1 (3.43) (Fig. 4A). In spleen samples, 30 candidate genes had a significant fold change in expression in C1498-AZA compared to C1498-vehicle: Klra17 (−1.65), Il5ra (−1.64), Cd79b (−1.63), Cd69 (−1.46), Cxcr4 (−1.40), Stat4 (−1.40), Ms4a1 (−1.40), Ccr2 (−1.33), Havcr2 (−1.27), Il16 (−1.20), H2-Aa (−1.17), Bcl6 (−1.16), Abca1 (−1.03), Zbp1 (−1.02), Cybb (−0.98), Ly9 (−0.96), Cd244 (−0.95), Ddx58 (−0.94), Tnfaip3 (−0.85), Il13ra1 (−0.81), Ifngr1 (−0.64), Hif1a (−0.50), Psmd7 (0.84), Anp32b (1.08), Ccl17 (1.80), Blm (1.83), Thbs1 (1.93), Birc5 (2.06), Tal1 (3.03), and Mpo (3.78) (Fig. 4B). Two targets, Thbs1 and Anp32b, are shared between blood and spleen datasets (Fig. 4C). Anp32b is downregulated in blood and upregulated in spleen after AZA treatment, Thbs1 is upregulated in both blood and spleen after AZA treatment. Thbs1is a strong inhibitor of angiogenesis (Krenn 2022), and high levels in blood serum are associated with better prognosis in AML patients (Laverdière et al. 2016).
Fig. 4
Differential Gene Expression Analysis Between Vehicle- and AZA-treated Blood and Spleen Samples from Leukemic Mice. Differentially expressed genes from the Mouse PanCancer Immune Profiling Panel between DMSO-treated leukemic mice (Vehicle) and AZA-treated leukemic mice (AZA) are shown in volcano plots as fold change (log2) versus adjusted p-values (-log10). Fold changes are presented as AZA versus vehicle for blood (A) and spleen (B) samples with significant genes labeled. Statistical significance was analyzed with multiple unpaired t-tests and corrected for multiple comparisons using the Holm-Sidak method. C A Venn diagram of genes shared between blood and spleen samples is presented
Gene targets modulated by AZA are primarily expressed on cell surfaces and function in adhesion, angiogenesis and platelet aggregation in mouse and human blood samplesDespite most available human datasets containing only leukemia-burdened bone marrow or sorted leukemic blasts, we did find one dataset of peripheral blood mononuclear cells (PBMC) harvested from AZA-responsive, AML patients. Evaluating RNAseq expression data from these patients after three complete cycles of AZA treatment compared to pre-treatment, we identified a list of genes that were significantly differentially expressed (Table S2). Out of the 340 genes found to be significantly affected by AZA treatment, only ITGB3 was a common gene upregulated in our AZA-targeted gene candidates in blood and the patient gene set; however, when genes from the mouse and human blood datasets were analyzed for functional enrichment, considerable overlap was observed in the subontologies of Cellular Compartment, Molecular Function, Biological Process and PANTHER pathways (Fig. 5). Using the PANTHER gene ontology (GO) “Slim” analysis to return the top five most significant, non-redundant annotations, we found that the human differentially expressed genes were in enriched in the biological processes and pathways of T-cell activation and differentiation, integrin-mediated signaling and adhesion, inflammation mediated by chemokines, cytokines, and complement, as well as blood coagulation (Fig. 5A, C, G). Differentially expressed genes from our mouse dataset were in enriched in blood coagulation and platelet aggregation, integrin signaling and adhesion, angiogenesis, complement activation, and p53 pathway signaling (Fig. 5B, D, H). Gene products from both datasets were enriched in expression at the plasma membrane, focal adhesions, and in the extracellular space (Fig. 5E, F).
Fig. 5
Gene Ontology (GO) Annotations in Common Between Mouse and Human Differentially Expressed Genes. Differentially expressed genes from the Mouse PanCancer Immune Profiling Panel between DMSO-treated leukemic mice (C1498-Vehicle) and AZA-treated leukemic mice (C1498-AZA) were analyzed for statistical overrepresentation analysis in gene ontology annotations. The same analysis was performed for differentially expressed genes from Gene Expression Omnibus (GEO) data set GSE118558 when comparing peripheral blood mononuclear cells (PBMC) from AZA-responsive AML and MDS patients after three complete cycles of AZA treatment versus each patient’s matched, pre-treatment PBMC. The top five annotations significantly overrepresented from the PANTHER GO “Slim” analysis are represented in bar graphs plotted against the negative log (base 10) of their p-values. Annotations from the subontologies “Molecular Function”, “Biological Process”, “Cellular Compartment”, and “PANTHER Pathways” are presented for human (A, C, E, G) and mouse (B, D, F, H) differentially expressed genes, respectively. A separate analysis of the same differentially expressed genes was run for the complete list of statistically significant enriched GO terms. Terms in common between mouse (red) and human (blue) are represented in Venn diagrams for (I) Cellular Component (CC), (J) Molecular Function (MF), (K) Biological Process (BP), and (L) PANTHER pathways (PP)
A statistical overrepresentation analysis was also run for the complete list of gene ontology annotations in which both the mouse and human differentially expressed genes were found to be significantly enriched (Full annotations lists Table S3 (Mouse) and Table S4 (Human)). Annotations in common between human and mouse blood samples revealed that their products are expressed in the extracellular space, cell surface, integrin and adhesion complexes, and in platelet alpha granules (from the gene subontology “Cellular Component”) (Fig. 5I). These products function in immune receptor activity, protein binding, growth factor binding, fibrinogen binding, chemokine binding, integrin binding, and extracellular matrix binding (from the gene subontology “Molecular Function”) (Fig. 5J), and are implicated in the control of epithelial cell proliferation, inflammatory response, leukocyte migration, lymphocyte migration, body fluid levels, cell adhesion mediated by integrin, apoptotic process, extracellular matrix organization and adhesion, fibroblast migration, myeloid cell homeostasis, platelet aggregation, platelet activation, hemostasis, wound healing, bone remodeling, smooth muscle cell migration, phosphatidylinositol 3-kinase/protein kinase B signal transduction, angiogenesis and vasculature development(form the gene subontology “Biological Processes”) (Fig. 5K). The specific pathways in common that these genes are enriched in include blood coagulation and integrin signaling (Fig. 5L).
AZA alters leukemic disease outcome following relapseMany of these processes and pathways found to be replicated in both the mouse model and human data have implications in normal immune cell actions including cancer cell surveillance (Lawler and Lawler 2012; –Cancer 2013); however, they also have implications in leukemic proliferation, spreading to other organs via the blood stream, and even extramedullary metastatic growth of AML blasts (Li and Wu 2024; –Malik and Cashen 2014). Thus, we interrogated our model for differences in end-stage disease outcomes including the spread of C1498 growth in both vehicle and AZA-treated immunocompetent mice. The number of circulating C1498 cells at end stage disease did not differ between C1498-vehicle and C1498-AZA mice and make up about 6.63% of total WBCs (Fig. 6A). However, even at end stage disease, AZA treatment limited the expansion of neutrophils while maintaining a higher percentage of lymphocytes compared to C1498-vehicle, although not to the level of healthy mice. Total platelet counts did not differ between C1498-vehicle, -AZA, or healthy mice, but platelet morphology did differ significantly with both C1498-vehicle and C1498-AZA mice showing significantly higher percentages of hypogranular platelets with concurrent lower percentages of normal platelets compared to healthy (Fig. 6B). RBC in C1498-AZA mice showed a significant increase in echinocyte morphology compared to both C1498-vehicle and healthy blood smears (Fig. 6C).
Fig. 6
Hematologic Profiles and Tissues from Terminally Leukemic Vehicle- and AZA-treated mice. C1498 cells (80,000) were implanted in C57Bl/6 mice via tail vein injection. Treatment with DMSO in diluent (Vehicle) (n = 5) or 5 mg/kg/mouse AZA (n = 11) by intraperitoneal injection began on day 3 after implantation and continued thrice weekly until survival endpoints. Mice were euthanized once they showed signs of terminal disease including, but not limited to, labored breathing, a hunched posture, or decreased mobility. Whole blood was taken just prior to euthanasia, smeared onto slides and stained for complete blood counts. A White blood cells (WBC) were counted manually, including C1498, and are presented as a percentage of total WBC counted. B Numbers of platelets and percentages of normal, spindle-shaped, and hypogranular platelet morphologies out of total platelets are presented. C Red blood cell morphologies including the presence of Howell-Jolly bodies (HJ Bodies), echinocytes, dacrocytes, and reticulocytes are presented as numbers counted per field. Statistical significance was analyzed using 2-way ANOVA followed by Tukey’s test for multiple comparisons: *p < 0.05, **p < 0.01, ***p < 0.001, ****p < 0.0001. Multiple organs and tissues including hip and knee joints and livers were removed post-euthanasia, fixed, and stained by Hematoxylin and Eosin. Representative joint and liver tissues for (D) C1498-Vehicle and (E) C1498-AZA are shown (n = 5)
Terminally ill C1498-vehicle mice displayed a hunched position, labored breathing, and lower body temperature prior to euthanasia. Liver enlargement and splenomegaly was observed in all C1498-vehicle mice during gross anatomy. Histochemical staining of organs revealed infiltration by cancerous cells with atypical nuclei, dense chromatin, and a high nuclear/cytoplasmic ratio most notably in the liver (Fig. 6D). Similar infiltrations were observed in C1498-AZA mice but to a lesser extent (Fig. 6E). Terminally ill C1498-AZA mice did not outwardly show signs of morbidity but were euthanized due to mobility issues. Masses were palpable on hip and knee joints (typically a single mass per mouse), sometimes causing paralysis of the affected limb. Histologically, these masses appear to be cancerous cells that have expanded within the region of the bone rather than spreading to distal tissues via the blood stream. Nearly 100% of relapsed C1498-AZA mice displayed more growth of cancerous cells around bone compared to liver, with the opposite being true of C1498-vehicle mice (Fig. 6D, E).
Comments (0)