
Remember me


Forty-seven eligible GC patients received ICI or ICI plus chemotherapy were enrolled in this study between August of 2014 and February of 2022. The clinical and pathological characteristics are summarized in Table 1 and the procedure of data analysis was described in Fig. 1. The median age at diagnosis was 55 (range: 22–82) years, and the male: female ratio was 1.35:1. Patients predominantly had adenocarcinoma histology (89.4%) while other histologic subtypes included squamous cell carcinoma (4.3%), signet-ring cell carcinoma (4.3%) and mucinous adenocarcinoma (2.1%). Most patients were in clinical stage IV (95.7%) and were non-esophagogastric junction origination (72.3%), classified as intestinal (34.0%), or diffuse (31.9%), or mixed (21.3%) subtype. HER2 positivity was assessed using IHC or FISH, and all patients were HER2-negative. In fourty-six patients with available PD-L1, twenty-seven (57.4%) patients had tumors with PD-L1 CPS ≥ 1. Eight (17.0%) patients were dMMR/MSI-H and ten (21.3%) patients were confirmed to be EBV positive.
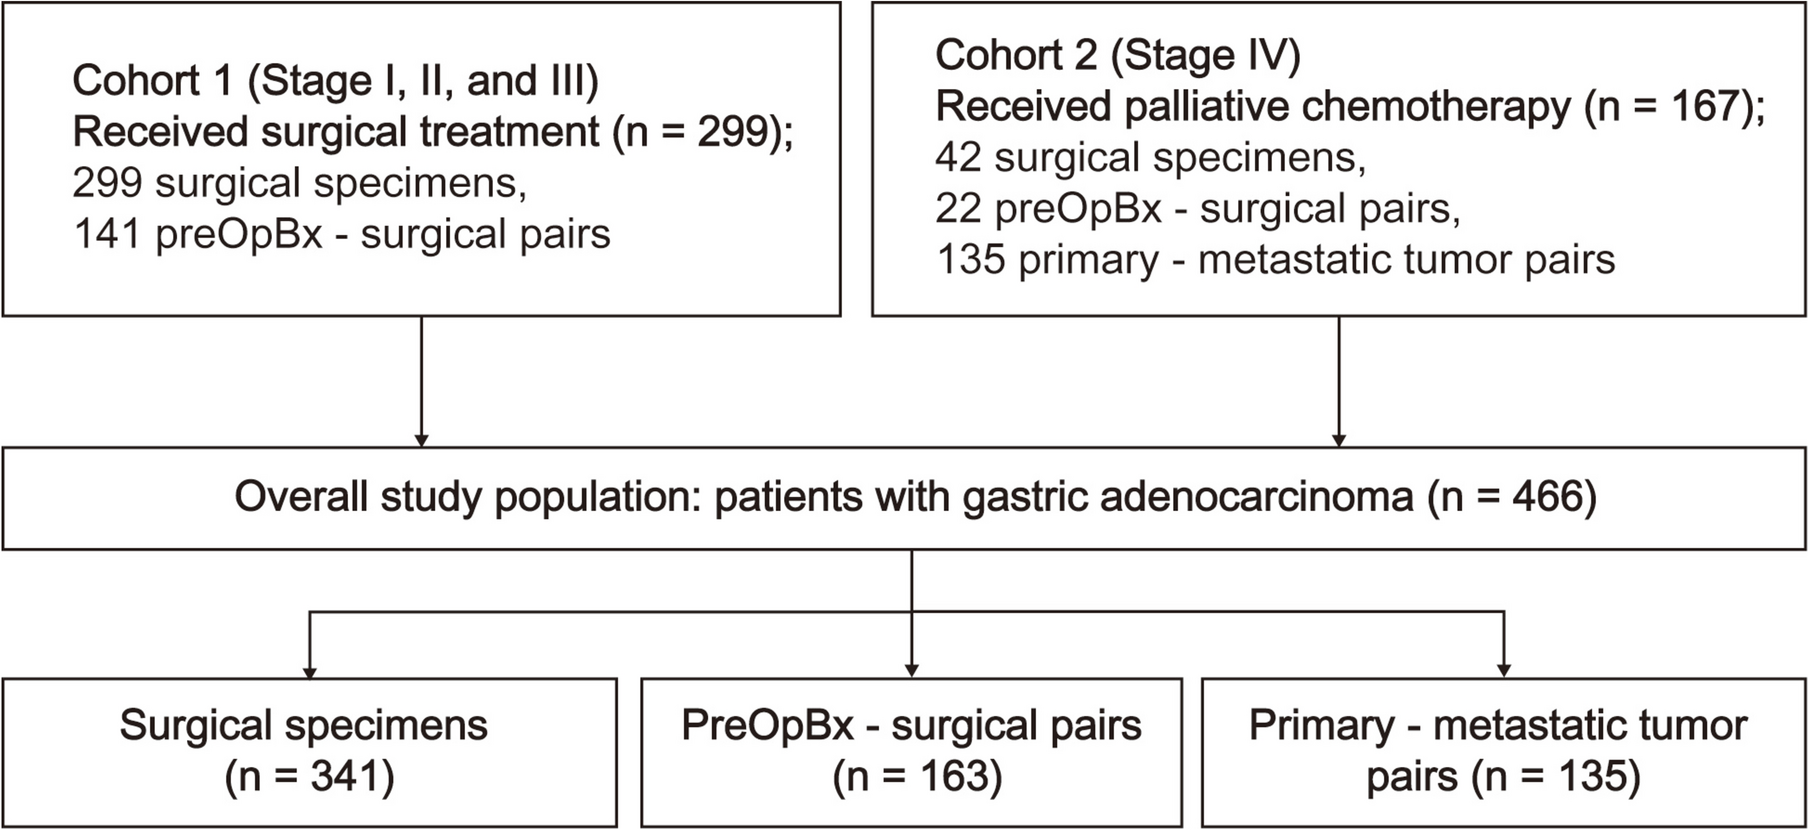
Table 1 Patient characteristics (N = 47)Fig. 1
A diagram illustrating the study workflow and samples used for each step. GC gastric cancer, NGS next-generation sequencing, ctDNA circulating tumor DNA, HER2 human epidermal growth factor receptor 2, MMR mismatch repair, EBV Epstein–Barr virus, RECIST response evaluation criteria in solid tumors, mVAF mean variant allele frequency
More than one third (36.2%) of the patients received anti-PD-(L)1 treatment plus chemotherapy as first-line therapy, while others received anti-PD-(L)1 (38.3%) or anti-PD-(L)1 plus anti-CTLA-4 treatment (25.5%) as first-line or late line therapy. The PD-1 antibody included Nivolumab, Pembrolizumab, Toripalimab, Sintilimab, Tislelizumab, Zimberelimab, Camrelizumab and LZM009. The PD-L1 antibodies included Durvalumab, Atezolizumab, Envafolimab, Sugemalimab and MSB2311. The CTLA-4 antibodies included Ipilimumab, Tremelimumab, IBI310 and bispecific PD-1/CTLA-4 antibody Cadonilimab. The combination chemotherapy regimens or drugs employed include XELOX (capecitabine plus oxaliplatin), SOX (tegafur plus oxaliplatin), and PTX. The median follow-up time was 10.03 months. Response evaluations were available for all patients, and the BOR was defined as the best response documented from initiation of treatment until the end of treatment. The median follow-up for BOR was 1.47 months. Specifically, sixteen (34.0%) patient achieved PR, sixteen (34.0%) had SD, and fifteen (31.9%) patients were PD, whereas no CR was observed in this cohort. The detailed clinicopathological information of all patients and specimens were concluded in Table S1.
Mutational profile assessed by baseline ctDNAPlasma ctDNA sequencing results were obtained using an OncoKB-based 733-gene panel (Table S2). A total of 658 somatic mutations involving 203 genes were identified among these 47 patients with HER2-negative advanced GC. The median number of mutations per sample was 11 (range: 0–73) with a mean variant allele frequency (mVAF) of 5.3% (range: 0.0–27.0%) and the maximum VAF of 85.3%. Figure 2 shows the mutational profile revealed from the baseline samples, restricted to genes mutated in more than 4% of the cases including pathogenic mutations and mutations of unknown clinical significance. The most frequently mutated genes revealed by ctDNA genotyping were TP53 in 68% of cases, BRCA2 in 38%, MSH6 in 36%, FGFR2 and MDC1 in 30% of cases (Fig. 2a). Among the pathogenic mutations, TP53 (64%), PIK3CA (19%), and KRAS (17%) were the most frequent gene alterations (Fig. 2b).
Fig. 2
The landscape of high-frequency genomic alterations detected in 47 baseline blood samples. Oncoplot of somatic mutations containing variants of unknown clinical significance (a) or only pathogenic variants (b) detected in the cohort using a 733-gene panel. Somatic variants are classified and interpreted according to AMP/ASCO/CAP standards and guidelines. Each column represents one sample and each row represents one gene. The upper bars represent the tumor mutational burden (TMB) in each patient. The right bars represent the numbers of patients for specific genes in the total cohort and the corresponding proportions are listed on the side. Cases are clustered according to MSI status. PD-L1 status, ORR, EBV status, gender, and tumor stage are also shown
Correlation between pretreatment ctDNA and baseline clinical factorsWe further compared pretreatment ctDNA parameters, including the ctDNA concentration, mVAF, maximum VAF and TMB detected, between patients grouped by different clinical factors including Lauren classification, tumor site, and MSI/PD-L1/EBV status. The mean concentration of pretreatment ctDNA was 20.9 (range: 0–631.4) ng/mL. The levels of pretreatment ctDNA concentration, mVAF and maximum VAF were higher in patients with mixed type of GC rather than diffuse type (P < 0.05). However, there was no significant difference between these parameters between intestinal and mixed or diffuse types (Fig. 3a–c). The mVAF was higher in patients with MSS GC compared to MSI-H (P < 0.05, Fig. 3b), and the TMB of patients who had a positive PD-L1 status was significantly higher than those who did not (P < 0.01) (Fig. 3d).
Fig. 3
Correlation between pretreatment ctDNA parameters and baseline clinical factors. Comparison of pretreatment ctDNA concentration (a), the mean VAF (b), maximum VAF (c), and TMB (d) detected in pretreatment cfDNA between Lauren classification (Intestinal N = 16, Diffuse N = 15, Mixed N = 10), tumor site (EGJ N = 13, NEGJ N = 34), MSI status (MSI-H N = 8, MSS N = 39), PD-L1 status (Negative N = 19, Positive N = 27) and EBV status (Negative N = 25, Positive N = 10). When using the logarithmic axis in (a–c), 2 cases with a value of zero are not plotted. The horizontal line represents the mean of each group. Kruskal–Wallis test was used to assess the differences among patients with different Lauren classification. Two-tailed unpaired t test with Welch’s correction was used to assess the differences among patients with different tumor site, MSI status, PD-L1 status and EBV status. *P value < 0.05; **P value < 0.01; ns not significant
Baseline ctDNA gene alterations as biomarkers of ICB efficacyBesides describing the mutational landscape of HER2-negative GC at advanced stage, we aimed at assessing whether specific mutations detected in ctDNA correlate with response to ICB treatment. For this, the 47 GC patients were divided into two groups based on their clinical response to the treatment. Sixteen patients with the BOR achieved PR were categorized into the responder group, while thirty-one patients achieved SD/PD were categorized into the non-responder group. Of the top ten differentially mutated genes in responders versus non-responders, six genes were found to be more likely to mutate in responders. These genes include MEN1 (P = 0.01), MLH1 (P = 0.01), CEBPA (P = 0.01), ATR (P = 0.03), GNAQ (P = 0.03), and FOXL2 (P = 0.04) (Fig. 4a).
Fig. 4
Mutational status of specific genes in baseline ctDNA predicted the clinical outcomes of ICB treatment. a Oncoplot of the top 10 differential baseline mutations in the responders versus non-responders. Responder refers to patients who achieved PR for best overall response (N = 16); non-responder refers to patients who achieved SD/PD for best overall response (N = 31). Each column represents one sample and each row represents one gene. The proportions of patients for specific genes in each cohort are listed on the side. MSI status, PD-L1 status, ORR, EBV status, gender, and tumor stage are shown by cases. The right bars show P values by Fisher’s exact test. b Progression-free survival (PFS) for patients with different IRS2 or CEBPA mutation status in baseline plasma ctDNA. c PFS for patients with different co-occurring mutation status including IRS2 & CEBPA, IRS2 & POLD1, TP53 & PIK3CA, POLD1 & CEBPA in baseline plasma ctDNA. d Overall survival (OS) for patients with different CDKN2A mutation status in baseline plasma ctDNA. e OS for patients with different co-occurring MSH6 & CDKN2A mutation status in baseline plasma ctDNA. Survival proportions were assessed by Kaplan–Meier survival analysis paired with Log-rank test. HR: hazard ratio, 95% confidence interval was shown and not available in d and e because nobody died in the mutant groups; mt mutant, wt wild-type
Furthermore, we conducted a survival analysis and observed a significant extension of median PFS (mPFS) in IRS2-mutant (12.47 vs. 3.42 months; log rank P = 0.0056; HR = 0.412; 95% CI 0.225–0.755) or CEBPA-mutant (15.89 vs. 3.95 months; P = 0.011; HR = 0.414; 95% CI 0.218–0.785) patients compared with wild-type patients (Fig. 4b, Table S4). Then, we analyzed the association of co-occurring genetic alterations with survival. Patients with both IRS2 and CEBPA mutations in their baseline plasma samples had a significantly better mPFS than the others (16.94 vs. 3.95 months; P = 0.003; HR = 0.356; 95% CI 0.187–0.678; Fig. 3c, Table S4). In addition, the presence of IRS2 & POLD1 (14.18 vs. 3.95 months; P = 0.006; HR = 0.399; 95% CI 0.206–0.772), CEBPA & POLD1 (14.18 vs. 3.98 months; P = 0.0315; HR = 0.453; 95% CI 0.230–0.893), TP53 & PIK3CA (10.25 vs. 3.95 months; P = 0.0166; HR = 0.350; 95% CI 0.171–0.714) mutations also predicted better mPFS than the others (Fig. 4c, Table S4). Moreover, both alteration of CDKN2A alone (P = 0.0289; Fig. 4d, Table S4) and co-mutations with MSH6 (P = 0.0355; Fig. 4e, Table S4) were significantly associated with superior OS. Based on our findings, it is estimated that alterations in the indicated genes might indicate a good response to ICB therapy in patients with advanced GC.
Decreasing ctDNA was correlated with higher response to ICBThe change in ctDNA immediately post-treatment has been reported to predict response to PD-(L)1 inhibition in solid tumors[6, 30, 31]. To test this hypothesis, dynamic sampling was performed at the on-treatment timepoint of average 8.3 weeks in 27 patients, varying between 3.9–19.1 weeks from the start of treatment. Among the responding patients, ctDNA concentrations decreased significantly at the on-treatment timepoint (P = 0.033), as did mVAF and max VAF levels, although not reaching statistical significance in the latter two parameters (Fig. 5a). Among the non-responding patients, an opposite trend could be observed in the indicated parameters. For example, a significant increase in mVAF was observed in non-responders from pretreatment to the on-treatment timepoint (P = 0.0441; Fig. 5a). Moreover, higher ctDNA concentration/mVAF/max VAF at the on-treatment time point were associated with poorer response (responders vs. non-responders, P = 0.028, 0.012, 0.0362 respectively; Fig. 5a). Taken together, these results suggest that dynamic changes in ctDNA and on-treatment ctDNA levels may be predictive of response to treatment with ICIs.
Fig. 5
CtDNA dynamics are predictive of clinical benefits from immune checkpoint blockade. a Comparison of the ctDNA concentration, mean VAF and maximum VAF between pre-treatment and on-treatment for the responders and non-responders. Responder refers to patients who achieved PR for best overall response (pre-treatment N = 16, on-treatment N = 3); non-responder refers to patients who achieved SD/PD for best overall response (pre-treatment N = 31, on-treatment N = 24). Mann–Whitney test was used to assess the differences between pre-treatment and on-treatment samples, or responders and non-responders. b ROC curves of molecular response and on-treatment mVAF to predict the best response. Waterfall plot of delta mVAF (c) or ratio mVAF (e) levels in descending order for individual patients, color coded by clinical responses evaluated by CT scan. The dotted line shows the cutoff of the molecular response as defined by either delta mVAF < 0 (c) or ratio mVAF < 50% (e). Kaplan–Meier estimates of PFS (left) and OS (right) according to delta mVAF (d) or ratio mVAF (f) levels. g Response rate, and forest plot for PFS and OS, based on different prognostic factors. The mutation load to classify TMB into high and low level was top 25% (cutoff = 13 mutations). Survival proportions were assessed by Kaplan–Meier survival analysis paired with Log-rank test. Conc. Concentration, HR hazard ratio; horizontal lines show the 95% confidence interval (CI) for each factor
The short half-life of ctDNA offers a unique opportunity to utilize early on-treatment changes in ctDNA for real-time assessment of therapeutic response and outcome, termed molecular response [3]. As both the change in ctDNA and on-treatment ctDNA level were notably associated with efficacy of ICB therapy, we further analyzed the predictive effect of the molecular response determined by integrating information from pretreatment and on-treatment VAF. Using receiver operating characteristic (ROC) analysis, we verified that the ratio-based and delta-based molecular response metric had similar association with RECIST response compared with on-treatment VAF alone (AUC = 0.89; 95% CI 0.69–1.00 for ratio mVAF; AUC = 0.83; 95% CI 0.65–1.00 for delta mVAF; AUC = 0.90; 95% CI 0.79–1.00 for on-treatment mVAF; Fig. 5b). Patients with pretreatment and on-treatment samples in the cohort were stratified into ctDNA-defined molecular responders and non-responders by a cutoff point of 0 in delta mVAF or of 50% in ratio mVAF, consistent with previous works[32,33,34,35]. Molecular responders stratified by delta mVAF had higher objective response rate (ORR) than molecular non-responders (20.0% vs. 5.88%, P = 0.535; Fig. 5c), with slightly longer mPFS (Fig. 4d). Stratification of the same cases by ratio mVAF demonstrated similar findings in ORR (40.0% vs. 4.55%, P = 0.0786; Fig. 5e) and a trend toward improved mPFS and median OS (Fig. 5f) in molecular responders.
In univariate analysis, established prognostic factors for immunotherapy including MSI status, PD-L1 status, EBV status, and TMB along with ctDNA kinetic parameters were incorporated. The data show that changes in ctDNA concentration levels and max VAF levels could be better indicators of treatment response than other established factors. Univariate analysis found that a reduction in ctDNA max VAF levels were associated with better PFS (P = 0.008; HR = 0.38; 95% CI 0.18–0.83; Fig. 5g). These findings suggest that ctDNA kinetics has great potential in capturing the clinical outcomes of ICB treatment in patients with advanced GC.
Changes in ctDNA predict resistance to ICBGC harbours intensive intrinsic molecular heterogeneity, which might be a critical driver of the resistance to immunotherapy. ctDNA provides good opportunities for longitudinal analysis which could be employed as a real-time tool for monitoring of emergent resistance mutations in patients receiving ICB therapy. Throughout the whole follow-up period, 43 patients had progressed with ICB therapies (mPFS = 3.98 months, range: 1.15–39.11 months). 26 of these progressed cases had available plasma samples at the time of progression, of which 10 cases developed acquired resistance (mPFS = 3.98 months) and 16 cases developed primary resistance (mPFS = 1.46 months). Generally, considerable consistency was present in the high-frequency mutations detected in the resistant population at PD and the total population at baseline, with TP53 and BRCA2 mutations ranked the top two (69% and 50% at PD, 68% and 38% at baseline, respectively; Figs. 2a and 6a). The proportion of mutations in most of these high-frequency mutant genes increased at PD in the resistant patients, including an 18% increase in POLE, 12% increase in BRCA2 and 8% increase in MDC1, ranked the top three.
Fig. 6
Molecular monitoring of ctDNA upon ICB treatment. a Heatmap of mutation profiles at the time of progression for resistant patients receiving ICB therapy according to response to treatment (N = 26). Each column represents one sample and each row represents one gene. The upper bars represent the TMB in each patient. b Mutation profiling of ctDNA before and at progression during ICB treatment for ten patients who progressed during follow-up. The two adjacent columns represent the baseline and on-progression data for the same patient pairing. The upper bars represent the change in TMB of each patient. The right bars represent the numbers of patients for specific genes in the subgroup and the corresponding proportions are listed on the side. c Comparison of molecular alterations at baseline and PD in acquired resistant patients. Each column represents one sample and the corresponding column matched to the same patient. The proportions of patients for specific genes in each cohort are listed on the side. AR acquired resistance (N = 10); P primary resistance (N = 16); BL baseline, PD progressive disease
To explore the acquired resistance of ICB treatment, we compared 10 available plasma samples at PD of the patients who had benefit from the treatment (achieved PR or SD) with paired baseline samples. Most of the TMB at PD were to varying degrees increased compared with baseline, and new genomic alterations were observed in 8 patients (Fig. 6b). Mutations of POLE gene were identified as new alterations in 3 patients, and BRCA1/FGFR2/CEBPA/MSH6 mutations were also found as new alterations in 2 patients. Other emerging genes found in one patient include BRCA2, EGFR, MYC, MDC1, etc. Specifically, the molecular alterations of POLE, FGFR2 and MDC1 were more frequent at PD than baseline in patients with acquired resistance (40% vs. 10%, 40% vs. 20%, 40% vs. 20%, respectively; Fig. 6c). These findings suggest that alterations in these genes may contributed to acquired resistance to ICB treatment.
Comments (0)