Patient samples
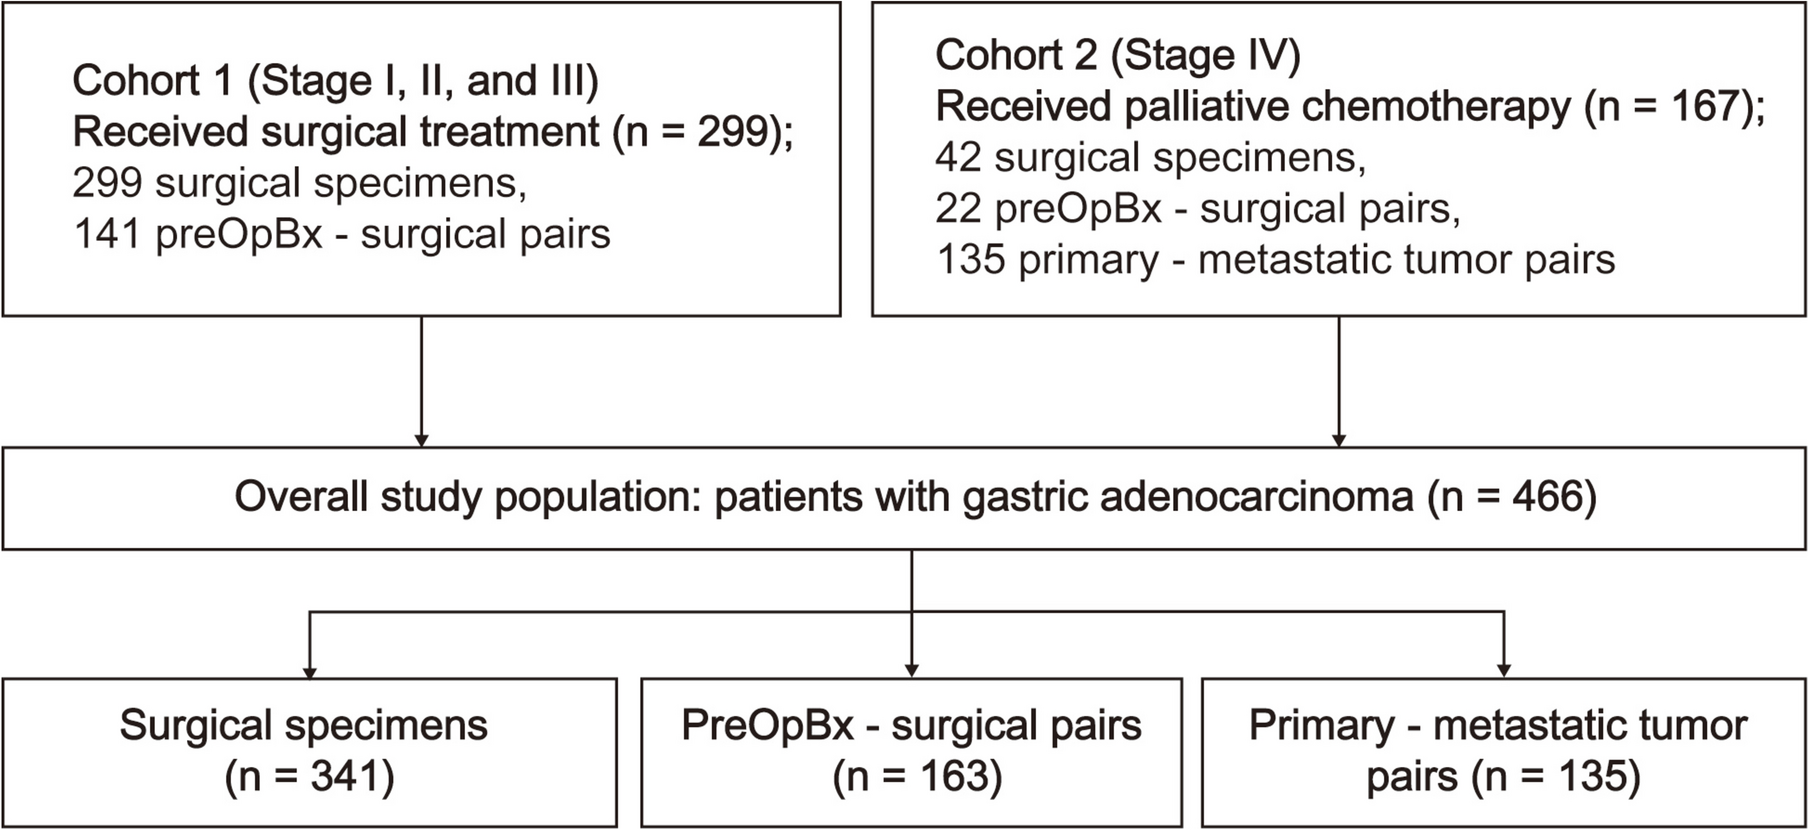
Cohort I was obtained from the GEPIA 2 database (http://gepia2.cancer-pku.cn/#index). Cohort II included surgical specimens from consecutive patients with GC who were surgically treated between January 2008 and December 2014 at Centro Hospitalar São João (CHSJ), Porto, Portugal. Tumor tissue, clinicopathological and treatment data, and follow-up information were available for all patients (n = 331). All samples were included in the biobank at CHSJ, and the study was approved by the Ethics Committee of CHSJ (CES 122/15). Relevant clinical information on this series has been previously provided [13, 14].
Immunohistochemistry
Immunohistochemistry (IHC) against YTHDF3 was performed in the GC samples included in the previously obtained tissue microarrays [13]. The samples were incubated with primary antibody against YTHDF3 (1:100 dilution, ab103328, Abcam, Cambridge, UK) overnight (O/N) at 4 °C and the procedure was as previously described [13, 14]. Samples were considered YTHDF3-Low when they were negative for YTHDF3 or when less than 20% of the malignant cells showed expression. Otherwise, the sample was considered YTHDF3-High. Classification required agreement among three observers.
Cell line culture
AGS, MKN28, MKN45, and SNU638 cells were cultured in RPMI-1640 + GlutaMAX supplemented with 10% fetal bovine serum (FBS). KATO III cells were cultured in RPMI-1640 + GlutaMAX supplemented with 15% FBS. GP202 cells were cultured in Dulbecco’s modified Eagle’s medium (DMEM) supplemented with 10% FBS. All human cell lines were cultured at 37 °C in a 5% (v/v) CO2 humidified atmosphere and were regularly tested for mycoplasma.
Western blot
The cell pellets were rinsed with phosphate-buffered saline (PBS) at 4 °C and resuspended in RIPA buffer supplemented with a protease inhibitor cocktail containing 1mM PMSF, 1mM Na3VO4, 20nM NaF (Roche, Basel, Switzerland) and 1x Complete (Roche Applied Science) for 30 min on ice. After centrifugation at 16000×g and 4 °C for 15 min, the supernatants were collected for protein quantification using the bicinchoninic acid (BCA) method. The samples were denatured in Laemmli buffer at 95 °C for 5min, separated by SDS-PAGE, transferred to a nitrocellulose membrane, and probed with appropriate antibodies O/N at 4 °C. The primary antibodies used included anti-YTHDF3 (ab220161, Abcam, Cambridge, UK), diluted 1:1000; anti-METTL3 (ab195352, Abcam, Cambridge, UK), diluted 1:1000; anti-YTHDF1 (ab252346, Abcam, Cambridge, UK), diluted 1:2500; and anti-YTHDF2 (ab220163, Abcam, Cambridge, UK), diluted 1:2500; anti-EZR (3145S, Cell Signaling Technology, Danvers, MA, USA), diluted 1:1000; and anti-β-actin (sc-47778, Santa Cruz Biotechnology, Dallas, TX, USA), diluted 1:900. Afterwards, the membranes were washed with TBS-1% Tween-20 (Sigma‒Aldrich, St. Louis, MO, USA) (3 × 10 min each), incubated with a suitable horseradish peroxidase-conjugated secondary antibody for 1 h at room temperature (RT) and resolved using an enhanced chemiluminescence (ECL) substrate. The bands were detected and quantified via a ChemiDoc imaging system using ImageLab 6.0.1 (Bio-Rad, Hercules, CA, USA).
RNA extraction and real-time PCR (qRT‒PCR)
Total RNA was extracted using TRI Reagent (Sigma‒Aldrich, St. Louis, MO, USA) according to the manufacturer’s protocol. RNA concentration and quality were assessed using a NanoDrop ND-1000 spectrometer (V3.5.2 Software, Thermo Fisher Scientific, Waltham, MA, USA). Total RNA was reverse transcribed to cDNA in two steps. First, by heating for 10 min at 65 °C, a mixture containing 1 μg of total RNA and 100 ng of random primers was produced in a final reaction volume of 13 μL. Second, 1x SuperScript Buffer, 5mM DTT, 0.5mM dNTPs, 0.6U/µL RNAseOUT RNase Inhibitor, and 5U/µL SuperScript III Reverse Transcriptase in DEPC-treated water were added, resulting in a final reaction volume of 20 μL. This mixture was incubated first at 25 °C for 5min, then at 50 °C for 30–60min, and finally at 70 °C for 15min. For PCR, each reaction was prepared with 4 μL of cDNA diluted 1:20 in DEPC-treated water, 10 μL of Power SYBR Green PCR Master Mix (Thermo Fisher Scientific, Waltham, MA, USA), 0.6 μL of each primer (10μM), and 4.8 μL of DEPC-treated water. The primers used are listed in Supplementary Table 1. The reactions were performed in a 7500 Fast Real-Time PCR System using the software v2.0.6 (Thermo Fisher Scientific, Waltham, MA, USA). Each experiment was performed in triplicate, and three negative controls (without cDNA) were included in each plate. The housekeeping control gene 18S was used to normalize target gene abundance. The data were analyzed using the comparative 2-ΔΔCT method [15].
CRISPR-Cas9-mediated YTHDF3 knockout cell generation
AGS and SNU638 knockout (KO) cell lines for YTHDF3 were generated using a previously published protocol [16, 17]. Briefly, a pair of single-guide (sg)RNAs (sgRNA1:5’-TGGGTAGCTCCTCGTAACAG-3,’ MIT score 95% and sgRNA2:5’-CTATATTCTTACCCTACGCA-3,’ MIT score 91%) flanking the 601bp genomic region that codifies the functional YTH domain were designed using the UCSC Human Genome Browser software [18]. Guide RNAs were designed to target all potential protein isoforms. The forward and reverse oligos were annealed and cloned into pSpCas9 (BB)-2A-GFP (#PX458, Addgene, Watertown, MA, USA) using the BsbI restriction site and T4-DNA ligase, transformed into Stbl3 competent Escherichia coli and sequenced for confirmation. AGS and SNU638 cell lines were transiently transfected with plasmids harboring the sgRNAs targeting YTHDF3 using Lipofectamine (Thermo Fisher Scientific, Waltham, MA, USA) and incubated at 37 °C in a 5% CO2 humidified atmosphere for 72 h. Single-cell sorting was performed using BD FACS Aria II Cell Sorter (BD Biosciences, California, CA, USA) to separate the GFP+ cells into 96-well flat-bottom plates with RPMI 1640+GlutaMAX supplemented with 10% FBS and 100µg/mL Primocin (InvivoGen, San Diego, CA, USA), which were subsequently incubated for 3 weeks. Clones harboring homozygous YTHDF3 deletions (designated ∆YTHDF3) were identified on the basis of two genotyping PCRs using the primers indicated in Supplementary Table 1. All homozygous KO clones were further validated with DNA sequencing and western blotting.
Hypoxia assay
Hypoxia was assessed using two methods. A 0.1M cobalt chloride (CoCl2) solution was used to induce hypoxia in the AGS and SNU638 cell lines and the corresponding ∆YTHDF3 clones [19]. The cells were plated in 24-well plates (5 × 10⁴ cells per well) and treated the next day for 24 h or 48 h with different concentrations of CoCl2 (AGS: 0, 50, 100, 200, or 300 μM; SNU638: 0, 50, 100, or 200 μM). Hypoxia was also assessed by incubating cells in a hypoxia chamber (1% O2) during 72 h. For both, cell viability was assessed using the PrestoBlue Cell Viability Reagent (Thermo Fisher Scientific, Waltham, MA, USA) according to the manufacturer’s instructions.
Treatment with chemotherapeutic drugs
To evaluate the impact of YTHDF3 on the response to 5-FU, cisplatin and paclitaxel (PTX) 1 × 10⁴ mock and KO cells/well were seeded into 96-well plates in complete media and incubated for 24 h before treatment with DMSO, 4.5 μg/mL 5-FU, 6 μg/mL cisplatin or different concentrations of PTX. Cell viability was measured using a PrestoBlueTM Cell Viability assay (Thermo Fisher Scientific, Waltham, MA, USA) according to the manufacturer’s instructions.
Modulation of EZRIN expression
NSC668394 (Merck KGaA, Darmstadt, Germany), a known pharmacological inhibitor of PKCι-mediated EZR phosphorylation at Thr567 and EZR-actin binding, was used to inhibit EZR activity. The cells were treated with NSC668394 at 1 or 2 μM, for 24–48 h, depending on the experimental requirements. The control cells were treated with an equivalent volume of DMSO. EZR downregulation and overexpression were performed using esiRNAs (Merck KGaA, Darmstadt, Germany) and pCMV-EZR expression vector (Addgene) transfected with Lipofectamine 2000 (Thermo Fisher Scientific, Waltham, MA, USA). esiRNAs against GFP and empty vector were used as controls, respectively.
Wound healing assay
5 × 10⁴ AGS mock and AGS ΔYTHDF3 cells per well and 1 × 10⁵ SNU638 mock and SNU638 ΔYTHDF3 cells were seeded in an Ibidi Culture-Insert 2 Well system (Ibidi, Gräfelfing, Germany) and maintained for 24 h at 37 °C and 5% CO2 to allow cell adhesion. Then the culture inserts were removed, and the cells were rinsed with PBS and incubated with fresh RPMI-1640 + GlutaMAX supplemented with 5% FBS for 24 h. During this period, images of the wounds were captured every 30 min with a 10x objective under phase contrast in a Leica DMI6000 Timelapse microscope (Leica, Wetzlar, Germany) at 37 °C and 5% CO2. ImageJ software was used to determine the percentage of the wound area closed, and two-way ANOVA was performed to assess statistical significance. Three wounds were sampled for each condition, and the experiments were performed in triplicate.
Transwell invasion assay
5 × 10⁴ cells were seeded in the upper compartment of the Transwell Matrigel-coated chambers with 8 µm pore-size membranes (Corning) in 500 µL of RPMI supplemented with 1% FBS. In the lower compartment, 750 µL of RPMI containing 10% FBS was added as a chemoattractant. Following 24 h incubation, non-invasive cells were removed with a cotton swab, whereas invasive cells were fixed in ice-cold methanol for 10 min. The membranes were cut and mounted with Vectashield (Vector) with DAPI. The number of invasive cells was counted after image acquisition using the PhenoImager HT (Akoya Biosciences).
Lung metastasis assay in mice
SNU638 cells (1 × 10⁵), either mock or ΔYTHDF3, were injected via the tail vein of 6–8-week-old NIH(S)II-nu/nu mice (5 mice per condition). The weight and well-being of the mice were evaluated twice a week for a maximum of 8 weeks after tumor cell inoculation. At this point, the mice were euthanized, and the lungs were harvested and fixed in 10% buffered formaldehyde for up to 48 h for further histological assessment of the metastatic burden. The lungs were serially sectioned at 50-μm intervals for comprehensive analysis, and the presence of metastasis was assessed in H&E-stained slides by two independent observers (RA and ASR). To quantify metastatic foci and metastatic burden, whole-slide images of lung sections were acquired using the PhenoImager HT (Akoya Biosciences) following H&E staining, and image analysis was performed using the QuPath software (version 0.5.1). The total tissue area was delineated using QuPath’s automated tissue detection tool, followed by manual refinement to exclude non-pulmonary parenchymal structures. Metastatic foci were identified manually through annotation. To ensure consistency, one representative slide per mouse was selected at comparable depth across samples. All experiments were conducted with the application of the 3Rs (replacement, reduction, and refinement) (JP_2016_02 Project, animal ethics committee, and animal welfare body of i3S).
Immunofluorescence
The cells were grown for 48 h on glass coverslips coated with fibronectin. Coverslips were washed with ice-cold PBS, fixed with 4% paraformaldehyde (PFA) in PBS, permeabilized with 0.25% v/v Triton X-100 in PBS, blocked with serum from the same species where the secondary antibody was produced, and diluted 1:5 in PBS + 0.5% Tween-20 and 0.05% BSA for 30 min. Fixed cells were then incubated with the primary antibody anti-EZR (1:200, 3145S, Cell Signaling Technology, Danvers, MA, USA) or anti-(Thr 567) phospho-EZR (1:200, PA5-117400, Thermo Fisher Scientific, Waltham, MA, USA) O/N at 4 °C, followed by probing with an Alexa Fluor-conjugated secondary antibody for 45 min at RT in the dark. In some experiments, after washing with PBS, the cells were incubated with Actin Red 555 Ready Probes reagent (R37112, Thermo Fisher Scientific, Waltham, MA, USA) for 30 min at RT in the dark to stain F-actin. Finally, the coverslips were stained with DAPI for 5 min and mounted on microscope slides using Vectashield Antifade Mounting Medium (Vector Laboratories, Inc., Newark, CA, USA). Images were acquired using a Leica SP5II laser scanning confocal microscope (Leica Microsystems, Wetzlar, Germany).
RNA sequencing (RNA-seq)
Three paired replicates of mock and ΔYTHDF3 SNU638 cells were used for RNA extraction and sequencing. Total RNA extraction was performed using the PureLink RNA Mini Kit (Thermo Fisher Scientific, Waltham, MA, USA), according to the manufacturer’s instructions. Quantification and quality control of total RNA were assessed using the NanoDrop ND-1000 and 2100 Bioanalyzer (Agilent Technologies, Santa Clara, CA, USA) systems, and only samples with an RNA integrity number above eight were considered for further study. Preparation of the RNA library, transcriptome sequencing, and bioinformatic analysis were outsourced to Novogene (Cambridge, UK). Genes with adjusted p values < 0.05 and log2 (fold-change) > 0.58 were considered differentially expressed. Gene Ontology (GO) and Kyoto Encyclopedia of Genes and Genomes (KEGG) pathway analyses were performed using the EnrichR bioinformatics database [20]. The RNA-seq data were deposited in the Gene Expression Omnibus (GEO) database (https://www.ncbi.nlm.nih.gov/geo/).
RNA immunoprecipitation (RIP) assay
Cultured cells were washed with PBS and subjected to ultraviolet crosslinking (254nm wavelength) at an energy level of 0.5J/cm2 on ice using a UV crosslinker. Cell lysis was performed with a cell scraper in NP-40 lysis buffer (20mM Tris–HCl pH 7.5, 150mM NaCl, 2mM EDTA, and 1% IGEPAL) supplemented with a protease inhibitor cocktail containing 1mM PMSF, 1mM Na3VO4, 20mM NaF, 1× Complete and 20U/mL RNase OUT ribonuclease inhibitor. After incubation for 30 min on ice, the extracts were centrifuged at 16000×g and 4 °C for 15min, and the supernatants were collected for protein quantification as previously indicated. Five micrograms of anti-YTHDF3 antibody or normal rabbit IgG were incubated with 750 mg of total protein extracts O/N at 4 °C with rotation. Protein‒RNA complexes were recovered on the following day by incubation with 50µL of Dynabeads Protein G for 2 h at 4 °C with rotation. After three washes in lysis buffer containing RNAseOUT, RNA was extracted from the beads with TRI Reagent and used for qRT‒PCR, as previously described. EZR mRNA levels were normalized against the housekeeping control GAPDH mRNA.
Single-base elongation- and ligation-based qPCR amplification method (SELECT)
mRNA was purified using the PureLink RNA Mini Kit and DNase treatment. Then 20 ng of mRNA was mixed with 40nM Up and Down primers for each of the predicted m6A sites (positions 1903 and 2161 of the EZR transcript - NM_003379.5) and, as a control, primers designed for a nearby site known to be unmethylated and located 4 bases upstream of each of these two sites following the protocol described by Ref. [21]. Finally, 5µM dNTPs and 17µL of CutSmart buffer 1x were added and incubated for 6 min, following a gradient of temperatures: 90 °C per 1 min, 80 °C per 1 min, 70 °C per 1 min, 60 °C per 1 min, 50 °C per 1 min and 40 °C for 1 min. Next, 3 µL of a mixture containing 0.01U of Bst DNA polymerase, 0.5U of SplintR ligase, and 10nmol of ATP was added in a total volume of 20 µL. The mixture was incubated at a gradient of temperatures: 40 °C for 20 min and 80 °C for 20 min and finally maintained at 4 °C. qRT‒PCR was conducted using 4 µL of the SELECT reaction mixture obtained for each putative m6A site with the one obtained for the control, and we finally compared the respective CTs.
Characterization of mitotic spindle orientation
The cells were plated on fibronectin-coated coverslips, and immunofluorescence was performed as described above. Spindle microtubules, centrosomes, and F-actin were stained with an anti-β-tubulin antibody (ab6046; Abcam, Cambridge, UK), anti-γ-tubulin antibody GTU-88 (ab11316; Abcam, Cambridge, UK), and Phalloidin CruzFluor™ 647 conjugate (sc-363797; Santa Cruz Biotechnology, Dallas, TX, USA), respectively. Images were acquired using a Leica SP8 laser scanning confocal microscope (Leica Microsystems, Bucks, UK) with an HC PL APO 63×/1.30 glycerol immersion objective and a digital zoom factor of 5. Metaphase fixed cells were imaged in x‒y optical sections passing through the spindle poles, with a z step of 0.3 µm with at least 20 sections, ensuring that the full cell was imaged. Orthogonal projections were created using 3D Project Fiji’s tool. The spindle orientation angles with respect to the fibronectin substrate were determined using Fiji’s angle tool, with the substrate as the reference line (0°). Statistical analysis of data from three independent experiments was performed using Prism with the Mann‒Whitney test. The results are presented in a bar graph showing the median and interquartile range, where 0° represents the substrate axis and 90° represents a perpendicular orientation to the coverslip.
Chick embryo chorioallantoic membrane (CAM) assay
Eggs were prepared (window opening) at embryonic development day (EDD)3, to allow the growth of the CAM detached from the shell. At EDD9, and under sterile conditions, each CAM was inoculated with 1 × 10⁶ SNU638 mock and 1 × 10⁶ SNU638 ΔYTHDF3 cells in two distinct inoculation sites limited by silicone rings, and resuspended 1:1 in 5 μL of Matrigel and 5 μL of serum-free culture medium. At EDD12, eggs were randomly distributed for topic treatment with PTX (10 μL at 10nM—21 eggs for each cell line) and DMSO (vehicle—16 eggs for each cell line). The experiments ended at EDD14. At the endpoint, CAMs were fixed (10% neutral-buffered formalin), excised from the embryo and photographed ex ovo. The pictures were used to determine the tumor size, as described previously [22].
Statistical analysis
To evaluate the associations between the expression status of YTHDF3 and the clinicopathological features of the tumors, different statistical tests were performed. To determine the associations with patient age, we used Student’s t test. For sex and vascular invasion, we applied Fisher’s exact test (two-sided). For the Lauren classification and tumor node metastasis (TNM) staging, we used the Chi-square test (χ2). To investigate the association between YTHDF3 expression status and the risk of death, the Kaplan‒Meier method was used to generate plots and survival curves for 5-year overall survival (OS: time from operation to death from any cause), which were compared using the log-rank test. Statistical analysis was performed using IBM SPSS Statistics version 24 (IBM Corporation, Armonk, NY, USA). Differences were considered statistically significant when the p value was less than 0.05.


Comments (0)