
Remember me


This study followed a cross-sectional design, using the Age-Friendly Cities and Community Questionnaire (AFCCQ) (Dikken et al., 2020) as a singular self-assessment tool administered at a specific moment in time. The goal was to assess the perceptions of older adults living in three cities across Italy (Verona, Venice and Palermo) regarding the age-friendliness of their cities and neighbourhoods. Responses are recorded on a 5-point Likert scale, with higher scores indicating a more age-friendly city.
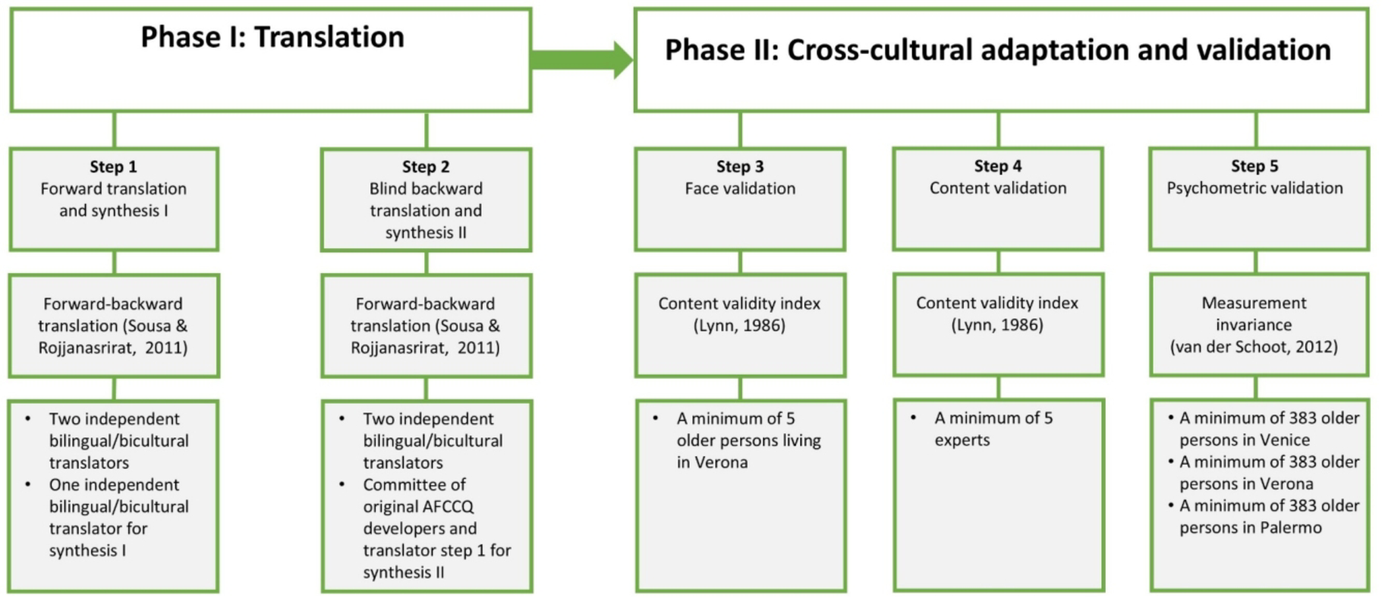
The AFCCQ has been adapted and cross-culturally validated previously for the Netherlands (Dikken et al., 2020), Turkey (Özer et al., 2022), Japan (Yamada et al., 2023), Israel (Ayalon et al., 2024), North Macedonia (Pavlovski et al., 2024), Romania (Ivan et al., 2024), Poland (Perek-Białas et al., 2024), Australia (Wasserman et al., 2025), and Russia (Ziganshina et al., 2025). The AFCCQ underwent a comprehensive translation and validation process to ensure the validity of results. This involved multiple steps to ensure rigour, including forward-backward translation, qualitative cultural adaptation assessment with face and content validity using the methods proposed by Lynn (1986) and Polit et al. (2007), followed by psychometric validation through Confirmatory Factor Analysis (CFA). Additionally, in order to facilitate meaningful comparisons, measurement invariance was assessed across the three cities. Figure 1illustrates the translation, adaptation, and validation process of the AFCCQ for Italy.
Fig. 1
Translation, adaptation, and validation process of the AFCCQ for Italy
Translation and Validation of the AFCCQ-ITThe original AFCCQ-EN in British English was forward-translated to Italian by two independent translators, who were fluent in both English and Italian. Translator #1, with expertise in Italian social gerontology and policy terminology, and Translator #2, familiar with colloquial phrases, jargon, and idiomatic expressions, worked on capturing the socio-cultural nuances. The procedure was based on the guidelines by Sousa and Rojjanasrirat (2011). The forward-translated versions were compared and refined by the research team. Back-translations into English were conducted by two other independent translators, who produced back-translated versions without any prior knowledge of the AFCCQ-EN. The research team compared the instructions, items, and response templates of the back-translations to ensure accuracy.
Face validation involved five older adults and content validation included five academic experts from Italy. Item Content Validity Index (I-CVI) (a quantification method for this qualitative appraisal) was used, with participants rating item relevance on a four-point Likert scale (1 = not relevant, 2 = somewhat relevant, 3 = quite relevant, 4 = highly relevant). For both groups, the I-CVI was calculated using the following equation:
where NR = number of people rating (3) or (4) and N = total number of people. I-CVI values greater than 0.78 were deemed acceptable. Both groups were asked if any themes or items relevant to measuring age-friendliness were missing. Data analysis was done using the software package SPSS version 29.0.
After data collection and screening, a CFA was conducted in which the Italian data were compared with the theoretical model outlined by Dikken et al. (2020). Using CFA, the construct validity of the AFCCQ-IT was tested by determining whether the data aligned with the predefined factor structure of the questionnaire. During the analysis, the variance of each latent factor was standardised to unity to facilitate interpretability and allow for factors to co-vary, ensuring that the relationships between different dimensions of age-friendliness (for instance, latent factors such as Housing, Social Participation, and Respect and Social Inclusion) could be captured accurately. To evaluate the goodness of fit between the Italian data and the proposed model, several fit indices were considered, including normed χ2, with values up to 5 indicating adequate fit. The Comparative Fit Index (CFI) and Tucker Lewis Index (TLI) should exceed 0.9, while the Root-Mean Squared Residual (SRMR) should be below 0.08 and the Root-Mean Square Error of Approximation (RMSEA) below 0.08 for a moderate fit.
Finally, we evaluated Measurement Invariance (MI) between the three cities to determine if valid comparisons between the cities were feasible. Only when a certain level of MI has been confirmed, a consistent interpretation of individual items and the underlying latent factor across all participant groups is permitted. In other words, one is allowed to make meaningful comparisons of age-friendliness scores between the cities. For instance, the latent factor Social Participation, which includes items like “I have opportunities to attend social events” and “I feel part of my community”; after the confirmation of MI, the same item scores would indicate a similar level of perceived social participation, regardless of whether the respondent is from Venice, Verona, or Palermo. This process ensures that observed differences in age-friendliness scores truly reflect variations in respondents’ perceptions rather than inconsistencies in how items or latent factors are understood across cities. By confirming MI, the analysis provides a robust foundation for valid cross-city comparisons, enabling policymakers to identify areas of strength and areas requiring targeted improvements in age-friendliness.
Configural invariance was first tested by repeating the CFA procedure, but this time separately for each city independently, ensuring the theoretical operationalisation by Dikken et al. (2020) is valid not only for the whole sample, but for each of the cities included in this study. Subsequently, a series of increasingly constrained models were tested. Metric invariance examined equal factor loadings, while intercepts were allowed to differ. Scalar invariance, indicating comparable construct meaning and item levels, was assessed by constraining both loadings and intercepts to be equal. Finally, the Residual Variance was tested by examining whether the variability in the observed variables that is not accounted for by the latent construct is equivalent across groups. For these analyses, the same model fit indices were used as described by the overall CFA.
Subsequently, the final model’s internal consistency was evaluated using composite reliability, preferred over Cronbach’s alpha in the context of CFA, with a value of 0.70 considered appropriate for reliability. These analyses were conducted using IBM SPSS Amos version 29.0 (IBM Corp., 2022).
Recruitment and ParticipantsThis study was conducted in three Italian cities: Verona, Venice (Italian: Venezia), and Palermo. The cities were chosen to design and evaluate two possible comparisons: the first at the intra-regional level with Verona and Venice, located in the same Region (Veneto), and the second at the North vs. South level (Table 1).
Table 1 Italy and the municipalities of Verona, Venice and Palermo. Population registered at 01.01.2023The cities of Venice and Verona were chosen considering their specific cultural and geographical contexts within the same region, Veneto. The city of Palermo, the capital of the Sicily Region, was selected to compare the eventual regional differences for the AFCCQ scores, considering the well-known gap between North and South regarding the quality of local welfare systems. Besides this, the funding for the data collection did not allow for the expansion of the number of cities involved. This study presents for the first time a convergent research design, data collection and data analysis of the AFCCQ for three different cities.
A representative sample of older people (65 years and over) living in Verona, Venice and Palermo were recruited to participate in this study, based on the demographic data of January 2023. Using a margin of error of 5% and a confidence level of 95%, a minimum of 384 respondents needed to be representative for the city of Palermo, 383 for the city of Venice and 382 for the city of Verona.
Recruitment and participation took place between November and December 2023. There were three inclusion criteria; (i) only those aged 65 years or over, (ii) who lived in their own home (i.e., not residing in institutional care), and (iii) were able to communicate in Italian were included. For the sample to be representative, the number of respondents had to reflect certain demographic characteristics of the older population in the three cities involved in the research. The ratio between males and females had to reflect that of the city, and participants had to come from all municipality districts. The study also recruited people who either lived alone or with a spouse, received care services such as house cleaning or help with personal care, lived with chronic conditions, and used mobility aids (wheeled walker or wheelchair). The fully anonymised database was made thanks to the fundamental support provided by the Coordinators of the Statistical Office of the Municipalities of Venice, Venice and Palermo, which delivered an extract from their archive to the researcher.
Data collection was realised through a simple random sampling approach using the municipal population database by a research agency (Demetra opinioni.net, Venice, Italy). Computer-assisted telephone interviewing (CATI) is the technique adopted by the research agency for the AFCCQ-IT data collection.
City Results and Age-friendly Typologies for ItalyA total of 1,213 older adults from Verona (n = 400), Venice (n = 407) and Palermo (n = 406), participated in the study, with no missing values on AFCCQ-IT items. Alongside the AFCCQ questionnaire, participants provided demographic information (Table 2).
Table 2 Demographics of participants Italy (total n = 1,213), Verona (n = 400), Venice (n = 407), and Palermo (n = 406)Initial analyses involved examining mean scores for the whole sample, the three cities and its districts, and examen potential differences between the cities and or districts. Subsequently, cluster analysis was done to create age-friendly typologies, grouping participants based on the nine domains of the AFCCQ. Likert scale data were normalised, and hierarchical cluster analysis (HCA) with Ward’s method determined the number of clusters. Validation involved splitting the sample by city and repeating cluster analysis. The k-means cluster analysis provided clarity, with demographic characteristics examined to identify salient features for each identified cluster. Categories with 75–99% representation were considered “highly likely,” those with 51–74% were deemed “likely,” and if no category exceeded 50%, it either indicated non-salience or appropriate category combination. Analyses were conducted using SPSS version 27.0 (IBM Corp., 2020).
Comments (0)