
Remember me


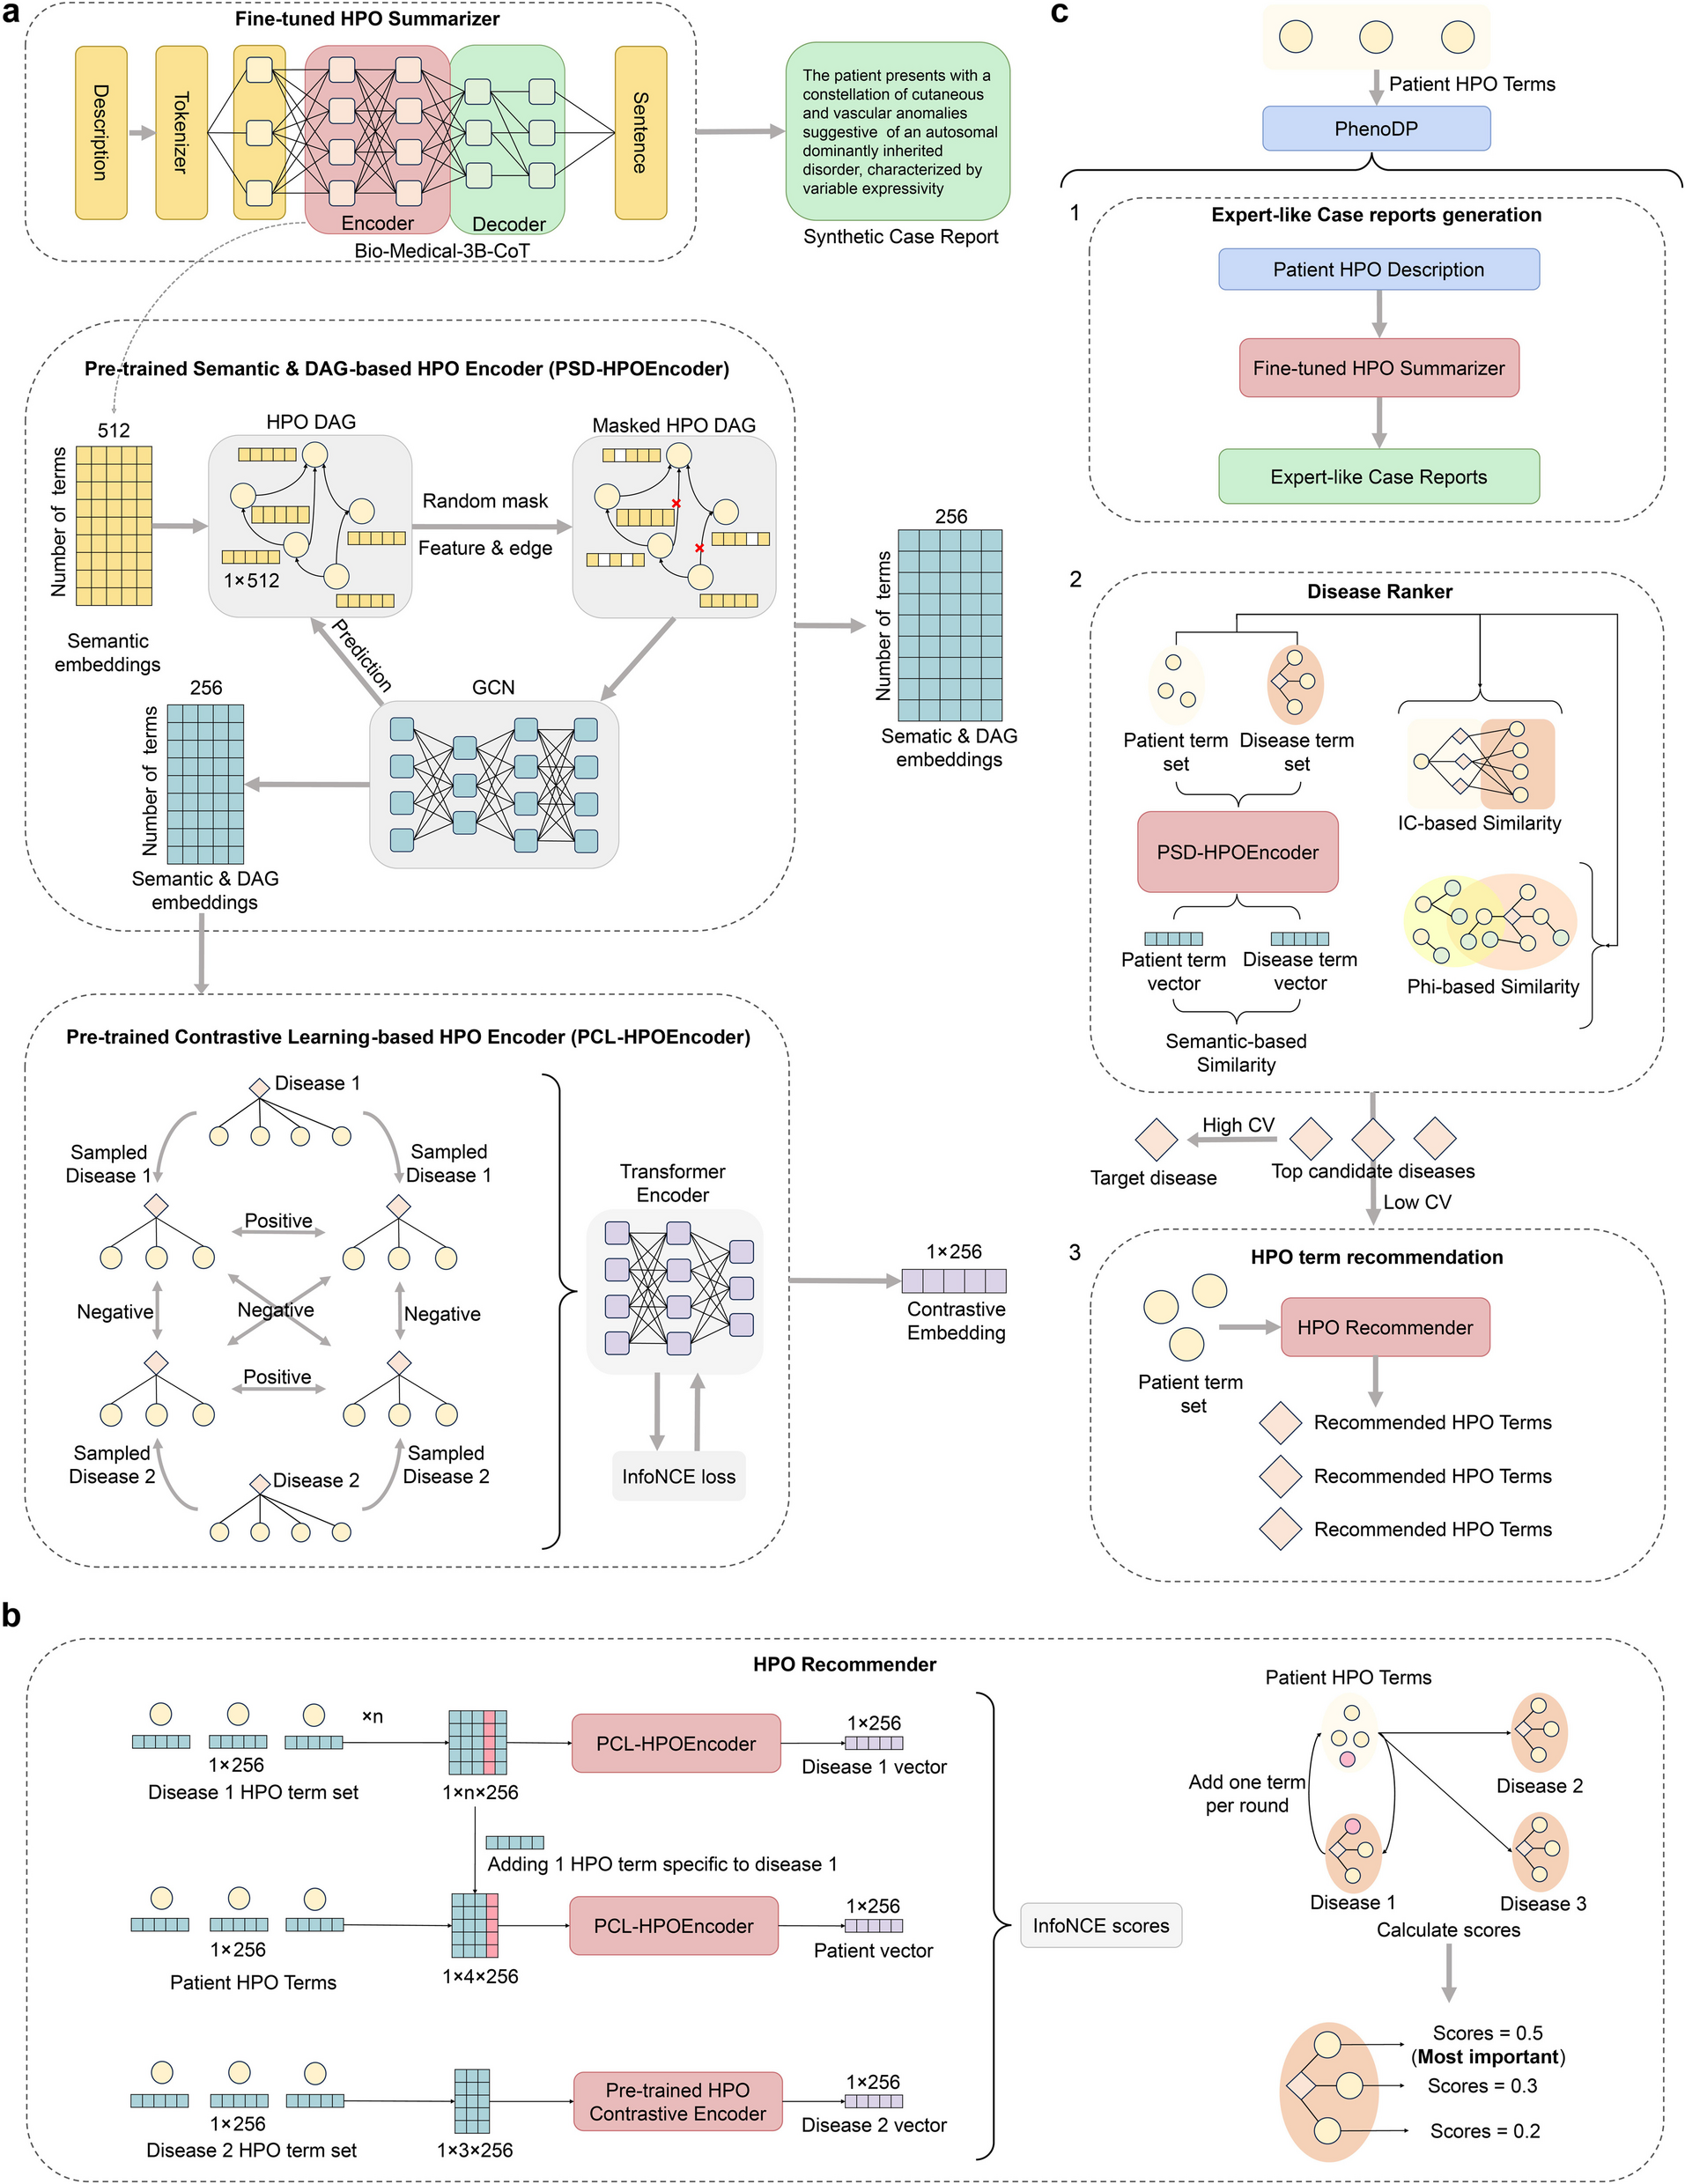


PhenoDP is an innovative tool designed to enhance disease diagnosis through comprehensive phenotype data analysis, comprising three core modules: the Summarizer, the Ranker, and the Recommender. The Summarizer harnesses DeepSeek-R1-671B’s advanced reasoning ability to fine-tune Bio-Medical-3B-CoT, producing high-quality, patient-centered clinical summaries from provided HPO terms. The Ranker compares a patient’s HPO term set against each OMIM disease using multiple similarity measures, producing a ranked list of possible diagnoses. Building on this, the Recommender suggests additional HPO terms that may refine the diagnosis, employing a contrastive learning framework to identify the most discriminative phenotype terms. Collectively, these modules empower PhenoDP to deliver precise disease rankings enhanced with contextual insights, thereby facilitating improved clinical decision-making. The workflow of PhenoDP is illustrated in Fig. 1, with further details available in the Methods section.
Fig. 1
The PhenoDP framework. PhenoDP consists of three core modules: the Summarizer, the Ranker, and the Recommender. a Deep learning architecture of PhenoDP. PhenoDP fine-tunes the pre-trained Bio-Medical-3B-CoT model using synthetic cases generated by DeepSeek-R1-671B to develop the Summarizer. The Summarizer’s encoder captures real-world semantic nuances by processing Human Phenotype Ontology (HPO) terms. Each HPO directed acyclic graph (DAG) node represents a term’s semantics, while edges encode term-to-term relationships, including anatomical and conceptual connections (e.g., between HP:0040279 [Frequency] and HP:0040283 [Occasional]). PhenoDP applies random masking and trains a graph convolutional network (GCN) via unsupervised learning, creating the PSD-HPOEncoder to generate hidden embeddings for all nodes. These embeddings treat phenotype terms as tokens and diseases as sentences, enabling the PCL-HPOEncoder to produce representations for patient or disease phenotype sets using the CLS token. b Workflow of the HPO Recommender. Given a patient’s phenotype set and candidate diseases, the Recommender suggests additional symptoms. For each candidate disease, an unobserved phenotype term is added to the patient’s set. This augmented set, along with the term sets of all candidate diseases, is processed by the PCL-HPOEncoder to generate embeddings. Positive pairs are formed from disease-patient embedding pairs, while others are treated as negatives. The InfoNCE score is calculated for each symptom, generating relevance scores. c Functional overview of PhenoDP. The Summarizer generates a patient-centered clinical summary based on the patient’s phenotype. The Ranker evaluates candidate diseases using three similarity metrics: (1) IC-based similarity, derived from information theory and phenotype-disease relationships; (2) phi-based similarity, calculated using the phi coefficient after considering shared ancestor terms between the patient and disease; and (3) semantic-based similarity, obtained by computing the cosine similarity between hidden embeddings generated by the PSD-HPOEncoder. The Ranker outputs a list of candidate diseases with corresponding scores, and the coefficient of variation (CV) is calculated—higher CV values indicate higher confidence in the ranking, while lower values suggest insufficient symptom data. Finally, the Recommender suggests additional symptoms based on the ranked diseases
PhenoDP’s Summarizer: utilizing DeepSeek-R1 to generate high-quality patient-centered clinical summariesTo enhance the ability of the PhenoDP Summarizer to generate clinically relevant summaries, we undertook a systematic refinement process, involving multiple iterations of model training and evaluation. Initially, we fine-tuned the FlanT5-Base model using disease definitions sourced from expert-curated databases: Orphanet and OMIM. Specifically, we used the “Definition” section from Orphanet and the “Description” section from OMIM, as both provided concise and structured disease information. We sampled 3000 disease entries from each dataset, concatenating the definitions of their associated HPO terms as input, with the disease definitions as targets. To prevent data leakage, we ensured that training and testing were conducted separately for each dataset. The fine-tuned models successfully outperformed the baseline FlanT5-Base in generating disease definitions (Fig. 2).
Fig. 2
Evaluation results of disease definition generation and medical abstract summarization performance. Top. Performance of FlanT5 and Bio-Medical-3B-CoT in disease definition generation before and after fine-tuning. “FlanT5” and “Bio-Medical” denote the original models, while “ + lora” indicates fine-tuning with specific datasets. “(OMIM)” and “(Orphanet)” represent training on 3000 randomly sampled OMIM and Orphanet disease entries, respectively, with testing conducted on the remaining entries (1731 for OMIM, 654 for Orphanet). Bottom. Performance of FlanT5 and Bio-Medical-3B-CoT in medical abstract summarization before and after fine-tuning. Models were trained using the described methods, with the prompt “Summarize the following text: ” applied consistently during training and testing. Identical parameters were used for both training and evaluation
Despite these promising results, we realized that relying solely on disease definitions—whether from OMIM or Orphanet—posed significant limitations for the Summarizer’s ultimate goal of producing real-world clinical summaries. Disease definitions are abstract and generalized, offering broad descriptions that lack the nuance and patient-centered detail required for clinical practice. Without a dataset of paired clinical symptoms and summaries, we turned to the SUMPUBMED dataset—a collection of 33,772 biomedical documents commonly used for abstract generation in previous research. We selected the first 1000 documents, using the “Body” sections (background, results, and conclusions) as input to generate abstracts, and compared them to the gold-standard “Front” sections (summary). Surprisingly, the fine-tuned models underperformed the baseline FlanT5-Base, suggesting that training on disease definitions did not translate effectively to more complex summarization tasks like biomedical text abstraction (Fig. 2).
To overcome these limitations, we explored large-scale biomedical language models (LLMs) that are specifically optimized for healthcare applications. We adopted Bio-Medical-3B-CoT, a Qwen2.5-3B-Instruct variant released on January 7, 2025, which had been trained on over 600,000 biomedical samples with chain-of-thought prompting. Without additional fine-tuning, this model outperformed FlanT5-Base in both disease definition generation and SUMPUBMED abstract synthesis. We then fine-tuned Bio-Medical-3B-CoT separately on the OMIM and Orphanet datasets. While the fine-tuned model performed well in generating disease definitions, it struggled to synthesize coherent clinical narratives from sets of HPO terms—highlighting the challenge of adapting disease-focused training to more dynamic, patient-oriented summarization tasks (Fig. 2).
To address the challenge of generating high-quality, patient-centered summaries, we turned to DeepSeek-R1-671B, an advanced LLM renowned for its reasoning capabilities. We leveraged 8385 disease entries from OMIM and Orphanet, concatenating their HPO term definitions and crafting tailored prompts to instruct DeepSeek-R1-671B to generate detailed, patient-centered clinical summaries. A manual review confirmed that these outputs were of high quality, capturing the nuanced insights that clinicians rely on for decision-making. However, the computational demands of DeepSeek-R1-671B made it impractical for widespread deployment in a clinical setting.
To create a more efficient solution, we applied knowledge distillation to fine-tune Bio-Medical-3B-CoT using the patient-centered summaries and reasoning chains generated by DeepSeek-R1-671B. Figure 3a illustrates an example, showing the input text, prompt, undistilled model output, clinical summary with reasoning chains from DeepSeek-R1-671B, and the distilled model output. The resulting model, Bio-Medical-3B-CoT-R1-Distilled, retained the advanced capabilities of the larger model while being lightweight enough to run on standard hardware. This distilled model demonstrated strong performance in both SUMPUBMED abstract generation and a test set of unseen clinical summaries produced by DeepSeek-R1-671B (Fig. 3b).
Fig. 3
Model distillation process and evaluation of text summarization performance before and after distillation. a Example of the distillation process for the disease capillary malformation-arteriovenous malformation 2 (OMIM:618196), annotated with six HPO terms. Definitions of these HPO terms were concatenated and input into a fixed template to generate model inputs. The leftmost boxes represent the output text (synthesized patient-centered summary) and chain-of-thought (CoT) from DeepSeek-R1-671B. The middle boxes show the output and CoT from the unmodified Bio-Medical-3B-CoT model, while the rightmost boxes display the output and CoT from the distilled model. b Evaluation of text summarization performance before and after distillation. “OMIM-Synthesized Case” and “Orphanet-Synthesized Case” were generated using synthesized patient-centered summaries and CoTs from 3000 randomly selected disease entries (from OMIM or Orphanet) as training templates, with synthesized summaries from the remaining entries used for testing. In both evaluations, “R1-Distill” represents the fine-tuned model, while Bio-Medical-3B-CoT remained unmodified. “SUMPUBMED” is an independent medical literature summarization dataset, with the first 1000 articles and their summaries used for evaluation
This enhancement ensures that PhenoDP’s Summarizer not only achieves its original objective of structured clinical summary but also adapts to the complexities of real-world medical decision-making, making it a useful tool for clinicians.
PhenoDP’s Ranker: strong disease ranking performance across simulated and real-world datasetsWe evaluated PhenoDP’s ability to prioritize target diseases based on a patient’s HPO terms using both simulated and real-world datasets. PhenoDP was compared to seven competing methods: PhenoPro, GDDP, Phen2Disease, Phrank, LIRICAL, Phenomizer, Exomiser. It is important to note that Phenomizer was only assessed in two of the three real-world datasets due to its nature as an online tool, making it impractical to run on the simulated datasets and one of the real-world datasets, which contain thousands of patients.
We constructed four types of simulated datasets representing patient phenotypic data: Precise Only, 2 Precise + 1 Imprecise, 2 Precise + 1 Noise, and Mixed, ordered by increasing difficulty (refer to the Methods section for simulation details). As illustrated in Fig. 4a–d, all methods exhibited a decline in coverage percentage with stricter criteria; however, PhenoDP consistently attained higher coverage percentages across all datasets. Notably, PhenoDP more frequently ranked the target disease within the top 20 than other methods, demonstrating its superior performance in these simulated scenarios. When compared to PhenoPro, which ranked second in coverage, PhenoDP achieved an average improvement of 11.7% across all datasets, with a significant 10.4% improvement in the more complex Mixed dataset. Additionally, PhenoDP outperformed all other methods in terms of mean reciprocal rank (MRR), achieving the highest overall MRR, while PhenoPro ranked second. PhenoDP’s average MRR improvement over PhenoPro was 12.6%, highlighting its effectiveness in prioritizing the correct diagnosis at the top of the ranked list (Fig. 4e).
Fig. 4
Performance of PhenoDP’s Ranker on simulated datasets. a–d depict the coverage percentage of various disease ranking methods across four simulated datasets: “Precise Only”, “2 Precise + 1 Imprecise”, “2 Precise + 1 Noise” and “Mixed”. The first three datasets each contain three terms, while the “Mixed” dataset includes two precise terms, one imprecise term, and one noise term. Each dataset consists of 3000 samples. Coverage percentage indicates the proportion of cases where the ranking tool places the target disease (i.e., the true disease) within a specific rank. e shows a bar chart comparing the mean reciprocal rank (MRR) for each method across the four simulated datasets. MRR measures the average reciprocal rank of the target disease, providing an overall assessment of ranking accuracy
We further assessed PhenoDP’s real-world applicability using three patient phenotype datasets derived from actual clinical cases, with detailed data acquisition information provided in the Methods section. The first dataset contained 381 cases provided by LIRICAL [24]. The second dataset included 130 manually curated cases from published articles on genetic and rare diseases, compiled by our team. The third dataset consisted of 5485 cases, recently updated by LIRICAL [40]. Both the first and third datasets included annotated HPO terms and the diagnosed disease for each case. For the second dataset, diagnosed diseases were sourced from the articles, while HPO terms were extracted from patient symptom descriptions using automated tools, such as PhenoBERT, ClinPhen, and PhenoTagger. Notably, all disease ranking methods performed optimally with HPO terms extracted by PhenoBERT (Additional file 2: Table S3), which we used for the second dataset.
PhenoDP’s Ranker consistently outperformed all other methods across the three datasets, achieving an improvement of 8.1%, 8.6%, and 2.6% over the second-best approach in the first, second, and third datasets, respectively (Fig. 5a–c). GDDP ranked second in the first dataset, while PhenoPro ranked second in the second and third datasets. In the second dataset, PhenoDP’s superior performance was maintained across HPO terms extracted by the other tools as well (Additional file 2: Table S3).
Fig. 5
Performance of PhenoDP’s Ranker on real-world datasets. a–c Line plot showing the coverage percentage of different disease ranking tools across three real-world datasets respectively (N = 381; N = 130; N = 5485). d Bar plot of the mean reciprocal rank (MRR) of disease ranking results generated by PhenoDP, with cases grouped according to their coefficient of variation (CV) values. These groups are based on PhenoDP’s ranking results, considering three candidate diseases for each case. A CV threshold of 2 is used, with cases categorized as high CV (above 2) and low CV (2 or below)
Following PhenoDP’s ranking, we calculated the coefficient of variation (CV) for the scores of the top three diseases. A higher CV indicates greater variability among the top disease scores, which we hypothesized could signal the presence of the true target disease among the top-ranked options. Our findings supported this hypothesis: in real-world dataset 1, the high CV group (CV > 2) exhibited an MRR of approximately 0.7, significantly higher than the low CV group (MRR: 0.256, p = 1.18 × 10⁻²⁶). Similarly, in real-world dataset 2, the high CV group had an MRR of 0.555, compared to 0.378 in the low CV group (p = 0.014). In real-world dataset 3, the high CV group exhibited an MRR of 0.570, compared to 0.367 in the low CV group (p < 1 × 10−100) (Fig. 5d).
The Ranker combines three similarity-based metrics—IC-based, phi-based, and semantic-based similarity—to rank diseases. Further analysis revealed that IC-based similarity played the most crucial role (Additional file 1: Fig. S1a), while phi-based similarity also contributed significantly. In contrast, the contribution of semantic-based similarity was minimal, possibly due to real semantic data being derived from a limited dataset.
In conclusion, PhenoDP’s Ranker consistently outperforms other methods across both simulated and real-world datasets, providing significant advantages in coverage percentage and MRR. These results underscore its robustness and effectiveness in accurately prioritizing diagnoses, particularly in complex clinical scenarios.
PhenoDP’s Recommender: suggesting relevant symptoms for clinical assessmentIn numerous clinical cases, the observed symptoms (HPO terms) may prove insufficient for accurately differentiating the target disease from other conditions with similar presentations. To address this challenge, we developed a Recommender system that suggests additional symptoms for clinicians to consider based on the patient’s observed symptoms. The effectiveness of this Recommender was evaluated through three benchmark scenarios.
In the first scenario, for cases where the Ranker initially placed the target disease in the first position, we evaluated the impact of incorporating the recommended HPO terms on ranking confidence. Specifically, we measured the difference in ranking scores between the top-ranked disease and the second-ranked disease before and after adding the suggested terms, assessing how the inclusion of these terms influenced the disease ranking confidence.
In the second scenario, for cases where the Ranker initially ranked the target disease in the second or third position, we assessed the effectiveness of the recommended HPO terms by calculating the percentage of cases in which the target disease moved to the first position after their inclusion, thereby measuring the improvement in ranking position.
In the third scenario, for cases where the Ranker initially placed the target disease within the top three, we analyzed how adding the recommended HPO terms affected overall ranking performance. This was quantified using the mean reciprocal rank (MRR) metric, which was applied across multiple disease-ranking models, including PhenoDP, PhenoPro, GDDP, Phen2Disease, and LIRICAL.
For comparison, we included the latest version of GPT-4o and PhenoTips in the benchmark. A specific prompt was designed for GPT-4o, wherein it was provided with the symptoms (HPO terms) for both the target and competing diseases, alongside the observed patient symptoms. GPT-4o was then instructed to recommend an additional symptom that would aid in diagnosing the patient with the target disease. The prompt templates utilized in this comparison are outlined in Additional file 2: Table S2. For PhenoTips, given a case with a known target disease, we manually entered its associated HPO terms into PhenoTips online webpage and extracted the top recommended HPO terms.
In the first scenario, the Recommender consistently outperformed both GPT-4o and PhenoTips in increasing the score difference between the top-ranked target disease and the second-ranked disease (Fig. 6a). Among 195 cases where the Ranker placed the target disease in the top position (N = 150 in real-world dataset 1, N = 45 in real-world dataset 2), the Recommender achieved an average score improvement of 0.086, significantly surpassing GPT-4o’s improvement of 0.071 (p = 5.63 × 10⁻⁴, paired t-test) and PhenoTips’ improvement of 0.0581 (p = 5.04 × 10⁻⁹) (Fig. 6b).
Fig. 6
Performance of PhenoDP’s Recommender on real-world datasets. a–b Scatter plots comparing the score differences between the top-ranked and second-ranked diseases after term recommendations and re-ranking by PhenoDP’s Recommender versus GPT-4o/PhenoTips, evaluated on 195 cases (150 cases from real-world dataset 1 and 45 cases from real-world dataset 2, where PhenoDP’s Ranker initially ranked the target disease as top 1). The y-axis represents score differences for GPT-4o/PhenoTips, while the x-axis shows those for PhenoDP. The black dashed line indicates equality, with red points denoting cases where PhenoDP performed as well or better than GPT-4o/PhenoTips, and blue points where GPT-4o/PhenoTips outperformed PhenoDP. c Histogram showing the percentage of cases where the target disease moved to the top 1 position after term recommendation by PhenoDP, GPT-4o, and PhenoTips, evaluated on 73 cases (51 cases from real-world dataset 1 and 22 cases from real-world dataset 2, where PhenoDP’s Ranker initially ranked the target disease as top 2 or top 3). d Comparison of mean reciprocal rank (MRR) between PhenoDP and GPT-4o/PhenoTips after term recommendation. Results are based on re-ranking by PhenoDP, PhenoPro, GDDP, Phrank, Phen2Disease, and LIRICAL after adding the first recommended term to the HPO set for a total of 268 cases (195 cases + 73 cases)
In the second scenario, the Recommender successfully elevated the target disease to the top-ranked position in 78.1% of cases, markedly outperforming GPT-4o (53.4%) and PhenoTips (23.3%) (Fig. 6c). In the third scenario, incorporating HPO terms suggested by the Recommender resulted in superior performance across all methods, as evidenced by higher MRR scores compared to those suggested by GPT-4o or PhenoTips (Fig. 6d). This finding underscores the superior quality of the Recommender’s suggestions in more effectively distinguishing the target disease.
Illustrating the Recommender: case study 1In this scenario, a patient was diagnosed with Immunodeficiency 103 (OMIM:212050, IMD103). The patient presented with symptoms including increased circulating IgE concentration, eosinophilia, increased circulating IgG concentration, lymphopenia, abnormal proportions of CD8-positive T cells, nail dystrophy, chronic oral candidiasis, and abnormal proportions of CD4-positive T cells. While PhenoDP’s Ranker correctly identified IMD103 as the top-ranked disease, the scores for the second and third-ranked diseases—Immunodeficiency 25 (IMD25) and Immunodeficiency 23 (IMD23)—were close, with scores of 0.800 for IMD103, 0.742 for IMD25, and 0.704 for IMD23.
To better distinguish IMD103 from IMD25 and IMD23, the Recommender suggested “Lymphadenopathy” (HP:0002716), while GPT-4o proposed “Hypereosinophilia” (HP:0032061), and PhenoTips recommended “Protracted diarrhea” (HP:0032061). Incorporating the Recommender’s suggestion raised IMD103’s score to 0.832, further separating it from IMD25 (0.708) and IMD23 (0.670). In contrast, adding GPT-4o’s suggested term increased IMD103’s score to 0.817, with IMD25 at 0.729. However, using PhenoTips’ recommendation caused IMD103 to drop to second place (0.764), while IMD25 rose to the top (0.774), leading to an incorrect ranking.
Supporting this finding, a related study documented lymph node enlargement in 9 out of 15 patients with fungal infections and CARD9 mutations [45], the causative gene of IMD103. Meanwhile, increased eosinophils, diarrhea, or protracted diarrhea have been reported in cases of IMD103, IMD25, and IMD23 [46,47,48], suggesting that the latter two suggested terms lacked specificity in distinguishing IMD103.
Case study 2In this scenario, a patient was diagnosed with Catecholaminergic Polymorphic Ventricular Tachycardia-3 (OMIM:614021, CPVT3), presenting with symptoms such as atrial arrhythmia, abnormal QT interval, ventricular arrhythmia, cardiac arrest, syncope, prolonged QT interval, and ventricular fibrillation. Initially, PhenoDP’s Ranker placed Short QT syndrome 2 (SQT2) in the top position with a score of 0.809, followed by Long QT syndrome 6 (LQT6) at 0.805, while CPVT3 ranked third with a score of 0.795. Incorporating the Recommender’s suggested term—“Polymorphic ventricular tachycardia” (HP:0031677)—elevated CPVT3 to the top position with a score of 0.835, while SQT2 dropped to third place (0.756) and LQT6 fell to fifth (0.751). The new second-ranked disease was Cardiac arrhythmia syndrome, with or without skeletal muscle weakness (OMIM: 615441, CARDAR), with a score of 0.792.
GPT-4o recommended “Juvenile onset” (HP:0003621), which, when included, increased CPVT3’s score to 0.857 at the top position, but ranked Long QT syndrome 9 (OMIM: 611818, LQT9) second with a close score of 0.830. Notably, both SQT2 and LQT6 have also been associated with juvenile onset [49, 50], reducing the specificity of this feature for CPVT3. Despite CPVT3 moving to the top position after adding the terms suggested by the Recommender and GPT-4o, the narrow score differences between CPVT3 and other top-ranked diseases suggested the need for additional distinguishing features.
In contrast, PhenoTips recommended “Abnormality of the ear” (HP:0000598), after which CPVT3 remained in third place (0.782), while SQT2 retained the top position (0.799). This result underscores the importance of selecting highly relevant phenotypic terms to enhance disease differentiation.
In conclusion, the Recommender module of PhenoDP has demonstrated strong performance in enhancing disease differentiation and improving diagnostic accuracy by effectively suggesting additional symptoms. It outperformed both GPT-4o, a state-of-the-art generative language model, and PhenoTips, a tool specifically designed for phenotype-based disease prioritization. While GPT-4o is not specifically optimized for HPO term recommendation, making its lower performance unsurprising, the Recommender’s superior results compared to PhenoTips highlight its effectiveness in refining differential diagnoses. With its innovative design and consistent performance across diverse datasets, PhenoDP’s Recommender proves to be a valuable tool for clinicians navigating complex diagnostic challenges.
Finally, we integrated the Summarizer, Ranker, and Recommender to generate structured clinical reports using a tailored Summarizer prompt (see Additional file 2: Table S4). The report includes patient-centered symptoms derived from HPO terms, probable diagnoses ranked by the Ranker, and additional symptoms for differential diagnosis suggested by the Recommender. Figure 7 presents an example for case 1. Notably, in this example, the language model also suggested FGFR2 and TNXB as candidate genes. While our prompt did not request gene prioritization, this output reflects the model’s tendency to incorporate inferred biological associations when not explicitly restricted. The suggestion of FGFR2 is biologically plausible, as the epithelial isoform FGFR2b is critical for normal morphogenesis of the skin and related structures, and its disruption has been associated with impaired skin elasticity and cutis laxa-like features (Katoh [51]). The suggestion of TNXB is even more consistent with current biological knowledge, as TNXB has been identified as a causative gene for Ehlers-Danlos syndrome, according to the report by Vanakker et al. [52].
Fig. 7
Example of a structured clinical report generated by the summarization model. The case from case study 1 was used, with the prompt provided in Additional file 2: Table S4
Comments (0)