Study design, patients, and ethics
This pilot study involved newly diagnosed septic shock patients admitted to the Third People’s Hospital of Chengdu’s intensive care unit (ICU) between May 2023 and August 2024. These patients underwent endotracheal intubation and had superior vena cava and arterial catheters placed as needed.
The diagnosis of septic shock followed the Sepsis-3 criteria [18], with the diagnostic process as follows: For patients with infection or suspected infection, if their sequential organ failure assessment (SOFA) score was ≥2 points or if the clinician suspected sepsis, further evaluation for evidence of organ dysfunction was conducted. If the patient’s SOFA score was ≥2 points or increased by ≥2 points, they were diagnosed with sepsis. Patients with sepsis who required vasopressors to maintain a mean arterial pressure (MAP) ≥ 65 mmHg despite adequate fluid resuscitation, and who had a lactate level >2 mmol/L, were diagnosed with septic shock.
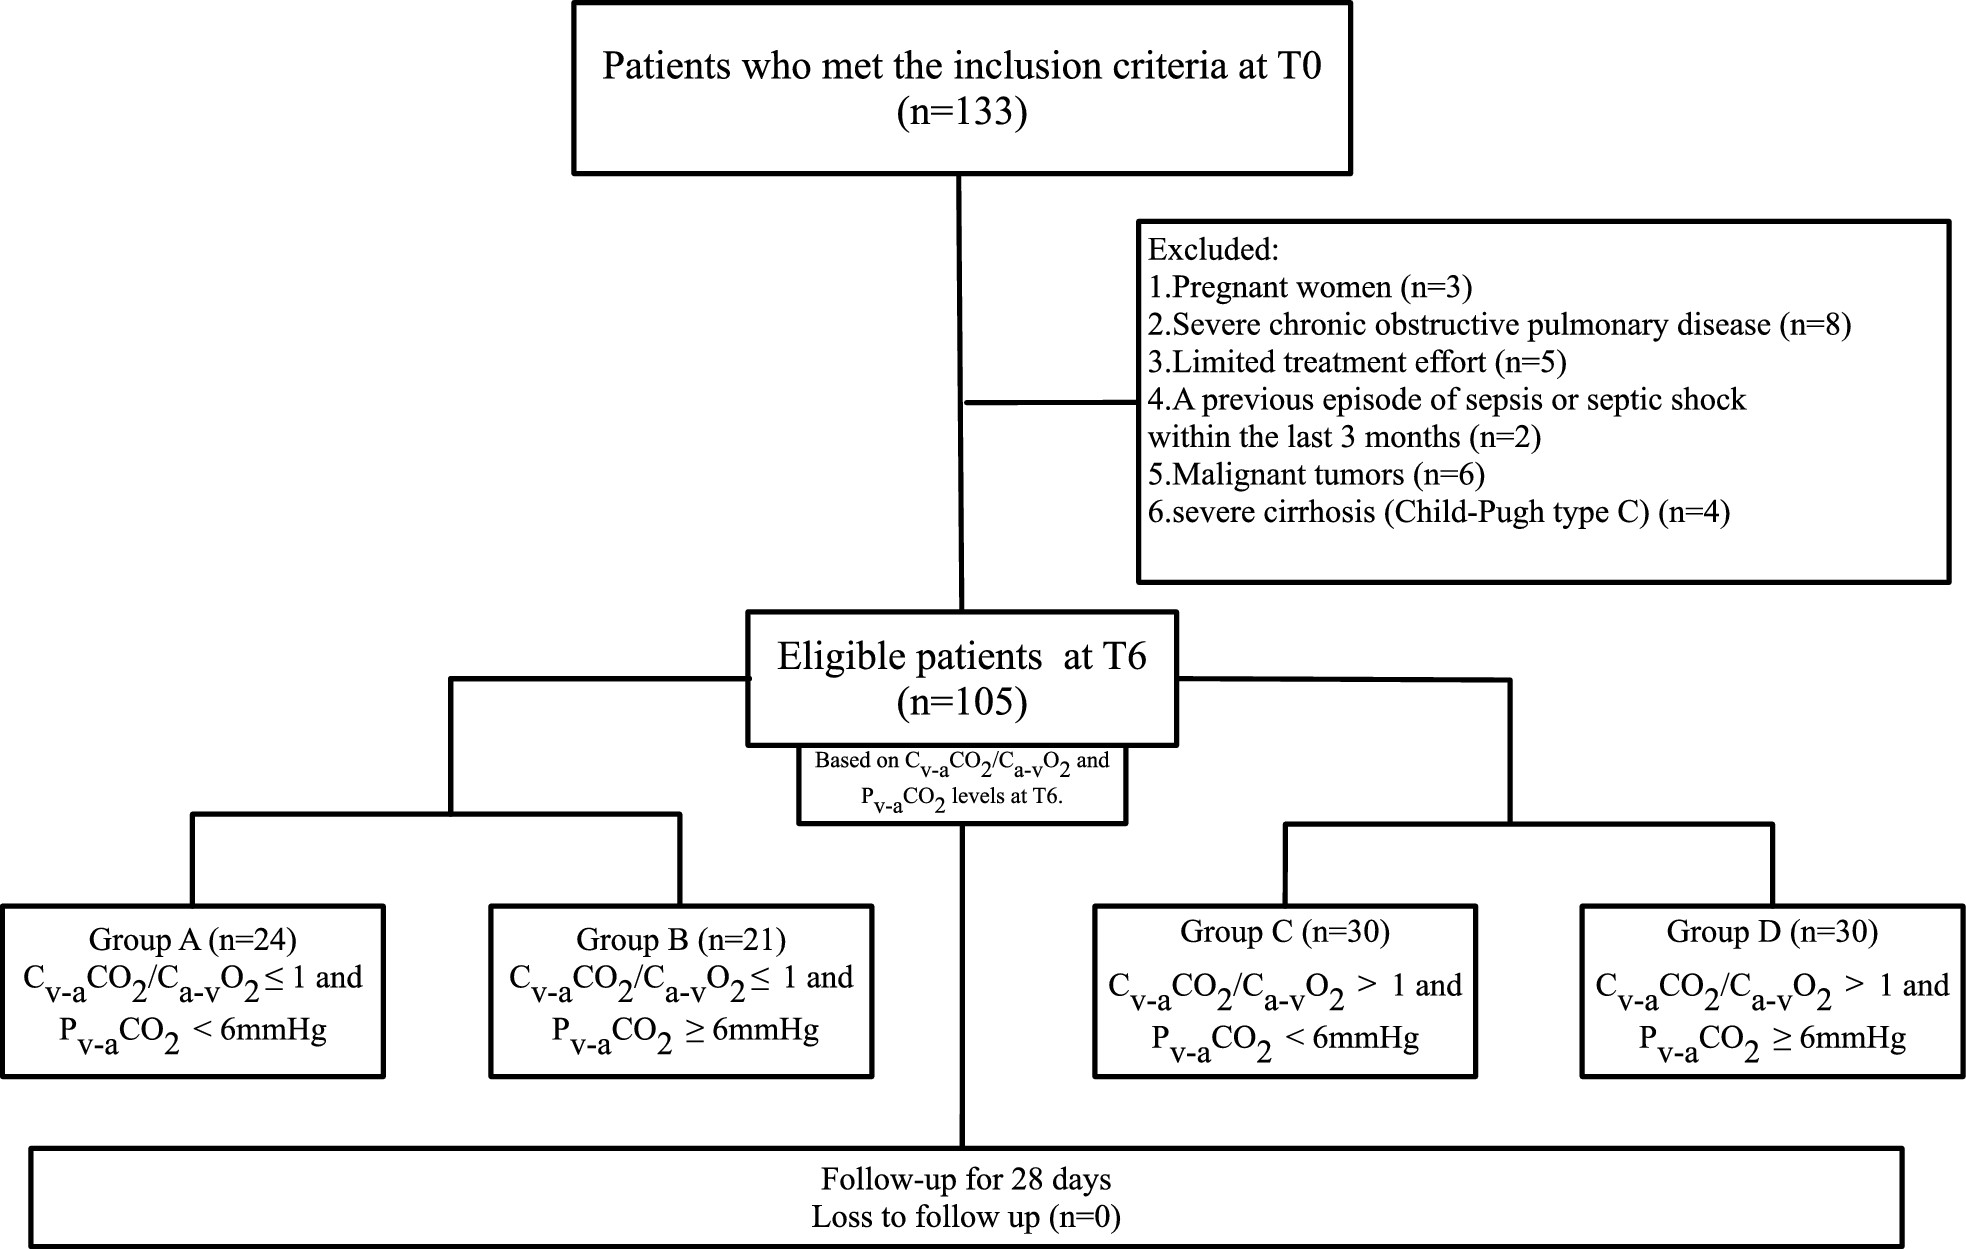
We included septic shock patients aged 18–85 years old who met central venous pressure (CVP) ≥ 8 mmHg after appropriate resuscitation, MAP ≥ 65 mmHg under norepinephrine infusion (≥0.02 µg/kg/min), and lactate >2 mmol/L at 6 h post-ICU admission (T6). This not only ensures compliance with the diagnostic criteria for septic shock but also excludes patients who may be in states of over-resuscitation or under-resuscitation, thereby guaranteeing the safety and accuracy of the study results. Pregnant women, those with severe chronic obstructive pulmonary disease, limited treatment effort, a previous episode of sepsis or septic shock within the last 3 months, malignant tumors, or severe cirrhosis (Child–Pugh type C) were excluded.
The hospital’s Medical Ethics Review Committee approved the study, which followed the medical ethics rules and the Declaration of Helsinki. (Approval number [2023] S–14). Informed consent was obtained from patients or their relatives. This study followed the “Strengthening the Reporting of Observational Studies in Epidemiology (STROBE)” statement guidelines [19] for observational cohort studies.
General management
Within 6 h after ICU admission, all patients received a comprehensive treatment protocol emphasizing early shock resuscitation and hemodynamic optimization. The resuscitation targets included a cardiac index (CI) > 3 L/min/m2, measured by bedside ultrasound or thermodilution, and a MAP ≥ 65 mmHg, maintained using norepinephrine as the preferred vasopressor. Additional targets included CVP ≥ 8 mmHg, a central venous O2 saturation (ScvO2) ≥ 70%, and urine output >0.5 ml/kg/h. Respiratory support was provided primarily in volume-controlled/auxiliary mode, with target tidal volume of 6–8 ml/kg [ideal body weight (IBW)] or lower, plateau pressure (Pplat) < 30 cmH2O, and driving pressure <15 cmH2O. Positive end-expiratory pressure (PEEP) titrated based on fraction of inspiration O2 (FiO2) [the acute respiratory distress syndrome (ARDS) Network lower PEEP table [20]].Target partial pressure of O2 in arterial blood (PaO2) and partial pressure of CO2 in arterial blood (PaCO2) be 70–100 and 35–45 mmHg, respectively. For sedation and analgesia, dexmedetomidine or midazolam was administered via continuous intravenous infusion for sedation, and fentanyl or butorphanol for analgesia, aiming for the Critical-Care Pain Observation Tool (CPOT) scores <3 points and the early sedation target of −3 points. Empirical antibiotic therapy was initiated following timely collection of microbiological cultures. Glycemic control was achieved with insulin infusion to maintain blood glucose at 7.8–10.0 mmol/L (140–180 mg/dL;1 mmol/L = 18 mg/dL). Lactate levels were dynamically monitored, and acid–base and electrolyte imbalances were corrected. Anemia was managed with transfusion targeting hemoglobin (Hb) > 7.0 g/dL or hematocrit (Hct) > 0.22], etc.
Study protocol and follow up
Time 0 (T0) was defined as the moment of the patients’ admission to the ICU. At T6, we collected blood samples for arterial and central venous (the superior vena cava) gas analyses (i-STAT 1 Portable Clinical Analyzer, Abbott, Chicago, USA.). Arterial lactate, MAP, CVP, heart rate (HR), volume of fluid resuscitation, FiO2 of the ventilator, PEEP, body temperature (BT), Hb concentration, and pressor agent dosage [vasoactive-inotropic score (VIS) [21]] were monitored. we also monitored the sublingual microcirculation at T6.
We recorded the SOFA scores, Acute Physiology and Chronic Health Evaluation II (APACHE II) scores, and lactate at T6, 24 h (T24), 48 h (T48), and 72 h (T72) post-ICU admission, along with endotracheal intubation duration, ICU length of stay, and in-hospital mortality. We tracked and recorded the survival status of each patient for 28 days from the time of enrollment, regardless of whether they were still receiving treatment at our hospital or another medical facility. We also calculated the ventilator-free days and ICU-free days. Ventilator-free days refer to the number of days a patient has not been intubated during the period from admission to the ICU until the end of the 28-day follow-up; ICU-free days refer to the number of days a patient has not received ICU treatment within the same timeframe.
Sublingual microcirculatory measurements and calculations
We used SDF imaging equipment (Microsense V100; Yiruan Intelligent Technology Co., Guangzhou, China) to monitor the sublingual microcirculation of patients at T6. After lightly removing saliva using gauze or swabs, the SDF probe was delicately positioned on one side of the tongue, 2.5–4 cm from the tip. The operator recorded five video clips from adjacent mucosal regions, with each segment lasting at least 20 s. All the video recordings were obtained by two specially trained and experienced non-attending physicians. Eligible video clips were anonymized by replacing patient identifiers with random numbers and were saved offline. We used the “Microcirculation Image Quality Score” described by Massey et al. [22] to systematically evaluate the quality of the collected images. Video sequences with poor quality (scores ≥ 10) were discarded at bedside. These videos were then analyzed in a blinded manner by another specialized researcher. The videos were analyzed using the software provided by the instrument.
Continuous blood flow in the microvessels is regarded as normal, whereas sluggish, intermittent, or no blood flow is considered abnormal. Microvessels are categorized as small or large, with a 20 μm diameter cutoff. Following the consensus [23], we calculated the proportion of perfused vessels for d < 20 μm (sPPV), proportion of perfused vessels for all (PPV), microcirculatory flow index (MFI), heterogeneity index (HI), total vessel density (TVD), vessel (d < 20 μm) density (sVD), perfused vessel density (PVD), and perfused vessel (d < 20 μm) density (sPVD). The proportion of perfused vessels (by length) is defined as the total length of perfused vessels (Lp) divided by the sum of the lengths of all vessels (Lv), expressed as PPV = Lp/Lv, with a unit of %. The perfused vessel density is defined as the Lp divided by the total analyzed field of view area (AFOV), that is PVD = Lp/AFOV, in mm/mm2.
Formulas and calculations
In accordance with the Fick equation:
$$ }_ = } \times (}_}} }_ - }_}} }_ ) $$
(1)
$$ }_ = } \times (}_}} }_ - }_}} }_ ) $$
(2)
VO2, oxygen consumption; CO, cardiac output; CaO2, arterial oxygen content; CvO2, venous oxygen content; VCO2, CO2 production; CvCO2, venous blood CO2 content; CaCO2, arterial blood CO2 content.
From Eqs. (1) and (2), it follows that:
$$ }_ /}_ = (}_}} }_ - }_}} }_ )/(}_}} }_ - }_}} }_ ) $$
(3)
In Eq. (3), VCO2/VO2 represents the respiratory quotient (RQ). Therefore, (CvCO2–CaCO2)/(CaO2–CvO2) can be used as an alternative indicator of RQ.
$$ }_}} }_ = (} \times }_}} }_ \times 1.34) + (}_}} }_ \times 0.0031) $$
$$ }_}} }_ = (} \times }_}} }_ \times 1.34) + (}_ }_ \times 0.0031) $$
Hb, hemoglobin; SaO2, arterial oxygen saturation; PaO2, arterial oxygen partial pressure; SvO2, venous oxygen saturation; PvO2, venous oxygen partial pressure.
The calculation of blood CO2 content follows the Douglas formula [24]:
$$ \begin & }\;}_ \;} = }\;}_ \;} \times \left( }} \right) \div \left( }_ } \right) \times \left( }} \right) \\ & }\;}_ \;} = 2.226 \times }\;}_ \;} \times }\;}_ \times \left( } - }\prime }} } \right) \\ & }\;}_ \;} = 0.0307 + 0.00057 \times \left( }} \right) + 0.00002 \times \left( }} \right)^ \\ & }\prime = 6.086 + 0.042 \times \left( }} \right) + \left( }} \right) \times \left[ }} \right)} \right] \\ \end $$
pH, potential of hydrogen; BT, blood temperature.
VIS [21] will be calculated as follows: VIS [21] = dopamine dose (µg/kg/min) + dobutamine dose (µg/kg/min) + 100 × epinephrine dose (µg/kg/min) + 100 × norepinephrine dose (µg/kg/min) + 15 × milrinone dose (µg/kg/min) + 10,000 × vasopressin dose (U/kg/min).
Definitions of the four groups
Given that Cv-aCO2/Ca-vO2 and Pv-aCO2 serve as reliable indicators of anaerobic metabolism and tissue perfusion, respectively. The Cv-aCO2/Ca-vO2 > 1 was reported to be both sensitive and specific for detecting anaerobic metabolism in critically ill patients [25]. Previous study [26] reported that under physiological conditions, Pv-aCO2 remains below 6 mmHg. So, we classified patients into four distinct groups based on their Cv-aCO2/Ca-vO2 and Pv-aCO2 levels at T6: Group A was no anaerobic metabolism and no inadequate tissue perfusion, Cv-aCO2/Ca-vO2 ≤ 1 and Pv-aCO2 < 6 mmHg; Group B was no anaerobic metabolism but inadequate tissue perfusion, Cv-aCO2/Ca-vO2 ≤ 1 and Pv-aCO2 ≥ 6 mmHg; Group C was anaerobic metabolism but no inadequate tissue perfusion, Cv-aCO2/Ca-vO2 > 1 and Pv-aCO2 < 6 mmHg; and Group D was anaerobic metabolism and inadequate tissue perfusion, Cv-aCO2/Ca-vO2 > 1 and Pv-aCO2 ≥ 6 mmHg.


Comments (0)