
Remember me
The autonomic nervous system (ANS) is essential for regulating involuntary physiological functions such as heart rate (HR), blood pressure, and respiration. Assessing ANS activity is crucial because its dysfunction is associated with various cardiovascular and respiratory disorders. HR variability (HRV) is a widely used, noninvasive measure that reflects ANS activity by analyzing the time intervals between heartbeats. HRV has been extensively studied to assess cardiovascular adaptability to physiological and psychological stressors in both healthy individuals (Voss et al 2015, Shaffer and Ginsberg 2017) and patients with various pathologies (Kristal-Boneh et al 1995, Singh et al 2000).
Previous studies have established that HRV derived from electrocardiogram (ECG) recordings is the gold standard for assessing ANS activity (Malik et al 1996). However, there is growing interest in noninvasive alternatives, such as volume-clamp-based measurements of noninvasive arterial blood pressure (nABP) or photoplethysmography (PPG), which captures an optical signal related to arterial volumetric blood pulsations. Several studies have investigated pulse rate variability (PRV) derived from PPG or nABP as a potential surrogate for HRV (Nakajima et al 1996, Lu et al 2009, Petek et al 2023, Chand et al 2024, Dewig et al 2024). With the increasing availability of wearable devices, PRV has gained attention as a convenient alternative to HRV. The development of FDA-approved wearable devices for PPG-based HR assessment (Mohamoud et al 2024) further supports the potential of PRV as an alternative to HRV in research applications. While studies indicate that PRV measurements obtained during sleep are comparable to those of HRV (Sarhaddi et al 2022), challenges remain during rapid tasks (Lam et al 2020).
The recording duration required for a reliable assessment of ANS activity remains a critical consideration in HRV analysis. While 24 h recordings provide comprehensive ANS characteristics during daily activities, HRV analysis lasting 5 min to 15 min is more appropriate for laboratory settings (Kleiger et al 2005). Determining the minimal signal length required for reliable HRV analysis is particularly relevant for assessments performed during exercise, post-exercise recovery, and positional changes (Plews et al 2012, Buchheit 2014). However, the minimum signal length necessary for an accurate assessment of ANS activity remains an open question. It is also unclear whether this requirement varies depending on the measurement modality, such as ECG, PPG, or nABP.
The influence of recording duration on HRV metrics may vary depending on the domain of analysis. In spectral HRV analysis, the choice of computational method for power spectrum estimation affects the required signal length, and no consensus has been established (Li et al 2019). While previous studies have investigated the reliability of ECG recordings lasting less than 5 min (Thong et al 2003, Salahuddin et al 2007, Nussinovitch et al 2011, Munoz et al 2015), these studies have primarily analyzed standard linear metrics. The minimum signal length necessary for HRV analysis when nonlinear metrics, such as fractal or complexity metrics are applied, remains understudied (Chou et al 2021). An additional important aspect of HRV analysis is the calculation window size used to derive HRV metrics from a continuous ECG signal. It has been shown that HRV metrics are sensitive to changes in the ECG segment duration, with periods ranging from 10 s to 10 min being considered (McNames and Aboy 2006). However, few studies have investigated the effect of the calculation window in sliding-window-based HRV analysis.
Since PRV signal characteristics are similar to those of HRV signal, HRV analysis methods are often applied to PRV analysis (Chou et al 2017). However, even less information is available regarding the reliability of PRV depending on signal length and the impact of calculation window size in continuous PRV determination. A recent study in which PPG signals were simulated using the sum of two Gaussian functions revealed that signals lasting around 90 s could provide reliable time-domain, frequency-domain, and Poincaré plot indices (Mejía-Mejía and Kyriacou 2023). However, as noted, experimental data are needed, as the effect of signal shortening may be more significant in pathology or during the execution of experimental protocols that could alter ANS behavior (Pecchia et al 2018, Mejía-Mejía and Kyriacou 2023).
We aimed to investigate how signal shortening (from 5 min to 3 min) and calculation window size (15 min vs 5 min vs 3 min) affect time-domain, frequency-domain, and nonlinear ANS metrics, and to analyze their impact on the interchangeability between HRV and PRV. Our study addresses the core challenge in wearable health technology and short-duration physiological monitoring by analyzing an important limitation in real-world HRV applications: the practicality of recording duration. The study design is presented in figure 1.
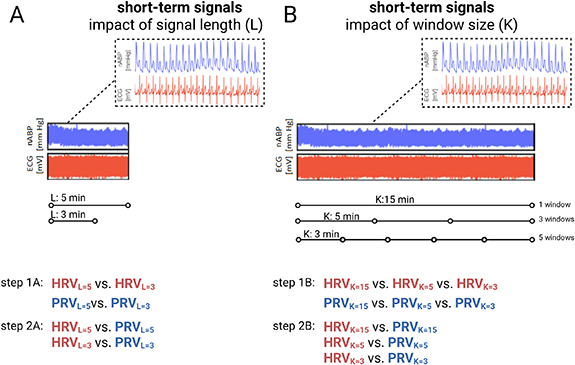
Figure 1. Study design. We performed two main analyses: (A) The first analysis utilized recordings of noninvasive arterial blood pressure (nABP) measured using photoplethysmography, and electrocardiogram (ECG), with each recording lasting 5 min. (B) The second analysis utilized recordings of nABP and ECG, each lasting 15 min. In the first analysis, we investigated the impact of signal length (L) (3 min vs 5 min) and assessed the interchangeability of HRV and PRV for both signal durations. In the second analysis, we investigated the effect of window size (K) (15 min (single window) vs 5 min (three windows) vs 3 min (five windows)) and the interchangeability of HRV and PRV across window durations. Created in BioRender. https://BioRender.com/n7pjaxx.
Download figure:
Standard image High-resolution image 2.1. ParticipantsTwo databases were used in this study, with data collected at the Neuroengineering Laboratory at Wroclaw University of Science and Technology. Data for database 1 were collected between October 2014 and June 2015, and data for database 2 were collected between October 2023 and January 2024. Ethical approval was obtained for both databases from the Commission of Bioethics at Wroclaw Medical University, Wroclaw, Poland (database 1: KB–170/2014 and database 2: KB–179/2023/N), before commencing the study. The study was compliant with the Declaration of Helsinki of the World Medical Association and the Sex and Gender Equity in Research Guidelines (Van Epps et al 2022). The inclusion criteria were: young adults (18–35 years), nonsmokers, those with a body mass index <25 kg m−2, free from any chronic illness, and not taking any medications chronically. Database 1 includes 56 healthy volunteers, with 2 subjects excluded due to poor signal quality. Database 2 includes 37 subjects, of whom 1 volunteer was excluded by a physician due to ECG rhythm abnormalities, and 4 were excluded due to poor signal quality. A flow chart of the data selection process is presented in supplementary figure 1. Database 1 was previously analyzed in a study about cerebral autoregulation (Placek et al 2017, Uryga et al 2017) and the databases 1 and 2 were analyzed in a study about the ANS (Uryga et al 2024).
2.2. Experimental setupIn both databases, measurements were performed during resting conditions, when a patient was seated in a straight-back position. Volunteers were asked to refrain from alcohol or caffeine consumption at least 12 h before the examination. Studies were conducted under the supervision of a physician at room temperature with external stimuli (noise, light level) minimized and comparable in both databases. Before the recordings began, the volunteers were given time to stabilize physiologically and psychologically, minimizing potential stress responses. nABP was measured noninvasively by a servo-controlled plethysmograph (dataset 1: Finometer MIDI, FMS Medical Systems, Amsterdam, The Netherlands, in all subjects; dataset 2: CNAP, CNSystems Medizintechnik GmbH, Graz, Austria (n = 16) and Finapres Nova, FMS Medical Systems (n = 16)). The cuff was placed on the middle finger of the left hand and held at the level of the heart. A three-lead surface electrocardiogram (ECG) was used to record the electrical activity of the heart. The end-tidal CO2 (EtCO2) and respiratory rate were monitored during the measurements to ensure that alterations in these respiratory parameters were negligible during signal recordings. Both respiratory rate and EtCO2 can modulate the sympathovagal neural drive to the heart through chemoreceptors in the brainstem, independently influencing the autonomic control of the heart, and affecting HRV (Pöyhönen et al 2004). These data were collected using a nasal cannula and a portable capnography monitor (RespSense™, NONIN, Plymouth, USA). Volunteers were instructed to breathe through their noses. The data were digitized with an analog–digital converter and recorded at a sampling frequency of 200 Hz with the ICM+ system (Cambridge Enterprise Ltd, Cambridge, UK).
2.3. Signal processingPreprocessing of ECG and nABP signals to remove noise and improve peak detection accuracy was performed before any analysis was conducted. The signal quality index was applied to nABP signals based on evaluating the skewness of the distribution (Elgendi 2016) within 5 s windows shifted by 1 s increments. The built-in signal cleaning functions from the NeuroKit2 library (Makowski et al 2021) were applied. Systolic peak detection in the nABP signal was performed using the algorithm described by Elgendi et al (Elgendi et al 2013) with recommended filtering using a zero-phase, third-order Butterworth filter with a bandpass of 0.5–8 Hz. This filter removes both baseline wander and high-frequency components that do not contribute to systolic peak detection. The resulting filtered signal was then further processed. For the ECG signal, R-peak detection was performed according to the method described by Brammer et al (Brammer 2020), combined with filtering proposed by Elgendi (Elgendi et al 2010), which uses a second-order Butterworth filter with an 8–20 Hz frequency band. In the window size analysis to avoid inconsistencies at the boundaries of shorter segments, local extrema were detected only once, before the division of the signals into windows, and a window was accepted if it achieved at least 90% of the required duration, thereby including recordings that were marginally shorter than anticipated.
2.4. ANS metricsHR was determined using the Fourier Transform as the frequency associated with the first harmonic of nABP (range 40–140 beats min−1; 0.67–2.33 (Hz)). The ANS metrics based on ECG signals were named HRV, and metrics derived from nABP signals were named PRV. Details on the calculation formula for HRV and PRV metrics are presented in the NeuroKit2 library documentation (Makowski et al 2021, Pham et al 2021). In the time domain, the following metrics were determined: the standard deviation of the R–R intervals (SDNN) and the square root of the mean of the squared successive differences between adjacent R–R intervals (RMSSD), mean of the R–R intervals (meanNN), and the proportion of R–R intervals greater than 20 ms or 50 ms, out of the total number of R–R intervals (pNN20 and pNN50, respectively). The power spectral density (PSD) of HRV/PRV was determined by fast Fourier transformation using the Welch periodogram method and determined at low frequency (LF; 0.04–0.15 Hz) and high frequency (HF; 0.15–0.4 Hz) ranges (Malik et al 1996). To allow for a more reliable comparison of frequency components and minimize the impact of the PSD estimation method, the spectral indices were normalized by dividing the individual component by the total power (LFn and HFn, respectively) (Bachler 2017). Additionally, the ratio between low and high-frequency components (LF/HF) was calculated. The nonlinear dynamics of the beat-to-beat R–R intervals were characterized using four entropy metrics: approximate entropy (ApEn) (Sabeti et al 2009, Shi et al 2017), sample entropy (SampEn) (Shi et al 2017), fuzzy entropy (FuzzyEn) (Chen et al 2009, Shi et al 2017) and multiscale entropy (MSEn) (Costa et al 2002, Humeau-Heurtier 2015). These metrics have been found to reflect changes in cardiac sympathetic and vagal tone (Castiglioni et al 2023, Nardelli et al 2023). A detailed description of entropy metrics is presented in the supplementary materials. Moreover, metrics derived from the Poincaré plot (a scattergram, which is constructed by plotting each R–R interval against the previous interval) were provided: SD1 refers to the standard deviation of the Poincaré plot perpendicular to the line-of-identity, and SD2 represents the standard deviation of the Poincaré plot along the line-of-identity (Guzik et al 2007).
The normality of data distribution was assessed using the Shapiro-Wilk test. The hypothesis of normality was rejected for most of the analyzed variables; therefore, the nonparametric tests were used. Differences in ANS metrics, estimated from signal lengths of 3 min and 5 min, were tested using the Wilcoxon signed-rank test. Differences in ANS metrics within calculation windows of 15 min, 5 min, and 3 min were tested using Friedman ANOVA. Reproducibility and consistency between ANS metrics derived from 3 min and 5 min recordings, as well as those derived from respective calculation windows (15 min, 5 min, and 3 min), were assessed using the two-way mixed-effects absolute agreement intraclass correlation coefficient (ICC). The ICCs were classified as poor (<0.5), moderate (0.5–0.75), good (0.75–0.9), or excellent (>0.9) and presented with both the lower and upper confidence limits (Koo and Li 2016). The agreement between HRV and PRV was assessed using Bland–Altman analysis (Bland and Altman 1986, 1999), with separate analyses conducted for each signal length and calculation window. The correlations between HRV and PRV metrics, as well as between ANS metrics and respiratory rate, were determined using Spearman’s rank correlation coefficient. The strength of Spearman’s correlation was interpreted as follows (Akoglu 2018): <0.2 negligible; 0.2–0.3 weak; 0.4-0.6 moderate; 0.7–0.9 strong; >0.9 perfect. Statistical significance was considered at p < 0.05. Data are presented as medians with interquartile ranges. Statistical analyses were performed using Statistica software (v13, Tibco, Palo Alto, CA, USA), R software v4.0, and Python 3.7.
4.1. The effect of signal shortening on HRV and PRV metrics70 subjects (median age: 23 (21–25) years; 31 men, 39 women) were included in the analysis of the impact of ECG signal length on HRV metrics, while 86 subjects (median age: 22 (21–25) years; 36 men, 50 women) were analyzed to assess the impact of nABP signal length on PRV. The EtCO2 level and respiratory rate were within the normal range throughout the entire recording time (38.3 ± 4.7 mmHg and 17 ± 5 breaths min−1 in HRV analysis and 38.2 ± 4.6 mmHg and 17 ± 5 breaths min−1, respectively, in PRV analysis). The results of the correlation analysis between HRV/PRV metrics and respiratory rate are presented in the Supplementary materials.
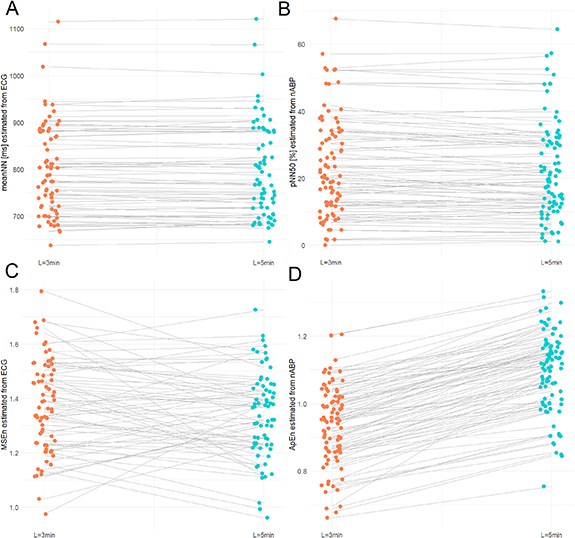
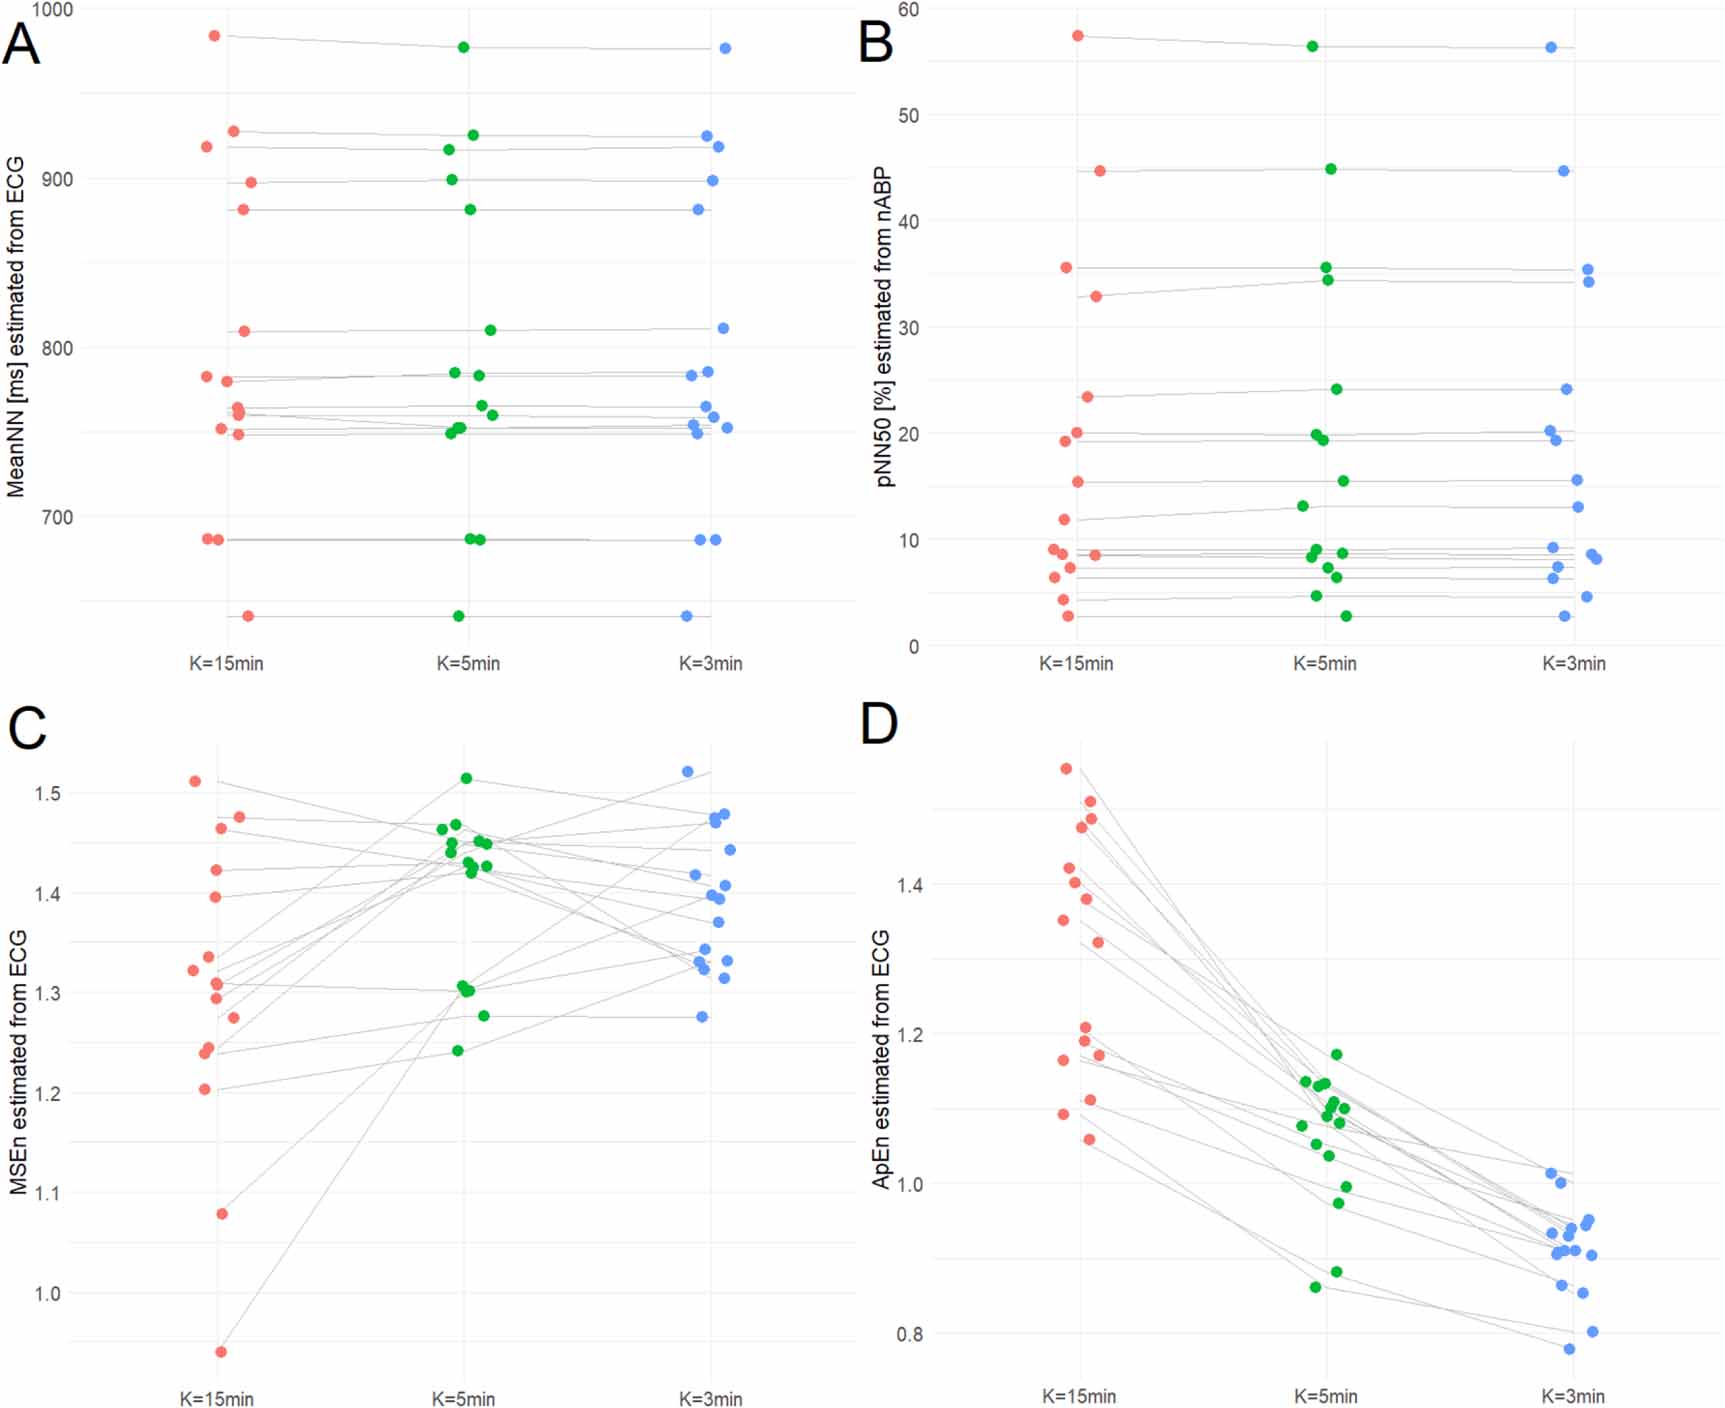
A comparison of the ANS metrics derived from 3 min and 5 min of recordings is summarized in table 1. In the time domain, no significant differences were observed for HRV metrics between 3 min and 5 min. For PRV, higher SDNN (p = 0.040) and lower RMSSD (p < 0.001) were observed for 5 min than for 3 min. However, ICCs indicated excellent agreement between metrics derived from 3 min and 5 min of recordings, for both HRV and PRV. The highest ICC values were obtained for meanNN (ICC = 0.99 (0.99–1) for both modalities, figure 2(A)), and pNN50 (ICC = 0.99 (0.98–0.99) for both HRV and PRV, figure 2(B)). Signal length had a significant effect on frequency-domain metrics. LFn and HFn were lower when estimated using 5 min than 3 min of recordings, both for HRV (p < 0.001 and p = 0.048, respectively) and PRV (p = 0.002 and p < 0.001, respectively). Moderate agreement between 3 min and 5 min was found for LF/HF in HRV analysis (ICC = 0.71 (0.53–0.82)) and PRV analysis (ICC = 0.69 (0.52–0.79)). In the nonlinear domain, ApEn estimated from 5 min was significantly higher than estimated from 3 min, both for HRV and PRV (p < 0.001 for both). The entropy-based metrics demonstrated moderate agreement with the lowest ICCs noted for MSEn and ApEn. MSEn had an ICC of 0.67 (0.47–0.80) in HRV (figure 2(C)), and ApEn had an ICC of 0.45 (0.15–0.64) in PRV (figure 2(D)) analysis. In contrast, SD1 and SD2 demonstrated excellent agreement with ICCs > 0.96 for both HRV and PRV. The impact of sex on ANS metrics when analyzing shorter signals is presented in the supplementary materials.
Figure 2. A comparison of selected heart rate variability (HRV) metrics (A) and (C) and pulse rate variability (PRV) metrics (B) and (D) derived from 3 min (red dots) and 5 min (blue dots) recordings using ECG (A) and (C) and noninvasive arterial blood pressure (nABP) signals (B) and (D). Panels (C) and (D) present metrics with poor agreement and a significant influence of signal length, whereas panels (A) and (B) illustrate good agreement with a negligible effect of signal length. Abbreviations: MSEn, multiscale entropy; meanNN, mean interval between normal R-peaks; ApEn, approximate entropy; pNN50, proportion of R–R intervals greater than 50 ms out of the total number of R-R intervals.
Download figure:
Standard image High-resolution imageTable 1. Linear (time and frequency-domain) and nonlinear metrics of heart rate variability (HRV) and pulse rate variability (PRV) were estimated from short-term recordings (3 min and 5 min) using ECG and noninvasive arterial blood pressure (nABP), respectively. Data are presented as median ± interquartile range. The differences in HRV (or PRV) between 3 min and 5 min recordings were assessed using the Wilcoxon test, with significant results indicated by asterisks. The intraclass correlation coefficient (ICC) with 95% confidence interval is also presented.
ANS metricsHRV (n = 70)PRV (n = 86)L = 3 minL = 5 minICC (95%CI)L = 3 minL = 5 minICC (95%CI)meanNN (ms)787 ± 192783 ± 1640.99 (0.99–1)775 ± 159771 ± 1740.99 (0.99–1.0)SDNN (ms)57 ± 2259 ± 210.98 (0.98–0.99)60 ± 2564 ± 30*0.97 (0.95–0.98)RMSSD (ms)49 ± 3548 ± 340.98 (0.98–0.99)55 ± 3753 ± 35***0.96 (0.94–0.98)pNN20 (%)56 ± 2758 ± 240.99 (0.99–1.0)60 ± 1660 ± 180.98 (0.97–0.99)pNN50 (%)22 ± 2520 ± 250.99 (0.98–0.99)20 ± 2120 ± 20*0.99 (0.98–0.99)LFn (a.u.)0.46 ± 0.290.41 ± 0.22***0.94 (0.90–0.96)0.42 ± 0.210.40 ± 0.20**0.94 (0.90–0.96)HFn (a.u.)0.35 ± 0.250.33 ± 0.26*0.97 (0.95–0.98)0.41 ± 0.220.37 ± 0.21***0.95 (0.92–0.96)LF/HF (a.u.)1.47 ± 1.971.37 ± 1.800.71 (0.53–0.82)1.03 ± 1.131.11 ± 1.070.69 (0.52–0.79)SD1 (ms)35 ± 2534 ± 240.98 (0.98–0.99)39 ± 2638 ± 25***0.96 (0.94–0.98)SD2 (ms)69 ± 2873 ± 290.98 (0.97–0.99)74 ± 3378 ± 330.97 (0.95–0.98)ApEn (a.u.)0.90 ± 0.121.09 ± 0.11***0.71 (0.57–0.81)0.95 ± 0.161.11 ± 0.17***0.45 (0.15–0.64)FuzzyEn (a.u.)1.15 ± 0.321.15 ± 0.450.97 (0.95–0.98)1.11 ± 0.301.11 ± 0.270.97 (0.96–0.98)MSEn (a.u.)1.36 ± 0.271.37 ± 0.210.67 (0.47–0.80)1.36 ± 0.271.34 ± 0.250.76 (0.64–0.84)SampEn (a.u.)1.51 ± 0.461.50 ± 0.440.95 (0.92–0.97)1.43 ± 0.501.40 ± 0.410.91 (0.86–0.94)Abbreviations: ANS, autonomic nervous system; meanNN, mean intervals between normal R-peaks, SDNN, standard deviation of the R–R intervals; RMSSD, square root of the mean of the squared successive differences between adjacent R–R intervals; pNN20 and pNN50, proportion of R–R intervals greater than 20 ms or 50 ms out of the total number of R–R intervals, respectively; LFn, HFn, normalized PSD of the R–R interval time series in the low-frequency range (LF, 0.04–0.15 Hz) and the high-frequency range (HF, 0.15–0.40 Hz), obtained by dividing the respective power spectra by a total power (TP, 0.04–0.40 Hz); LF/HF; low-to-high frequency ratio; SD1, Poincaré plot standard deviation perpendicular to the line of identity; SD2, Poincaré plot standard deviation along the line of identity, MSEn, multiscale entropy; ApEn, approximate entropy; SampEn, sample entropy, and FuzzyEn, fuzzy entropy. Please note that R–R intervals refer to HRV metrics, and N–N intervals refer to PRV metrics. *p < 0.05; **p < 0.01; ***p < 0.001 for testing of the differences in HRV (or PRV) between 3 and 5 min using the Wilcoxon test; ICC, intraclass correlation coefficient.
4.2. The effect of signal shortening on HRV-PRV interchangeabilityThe results of correlation analysis between HRV and PRV metrics, performed separately for 3 min and 5 min of recordings, are presented in table 2. A very strong correlation was observed for meanNN, pNN20, LFn, HFn, LF/HF, and SD2 (rs ⩾ 0.80; p < 0.001) across both 3 min and 5 min of recordings. Additionally, SDNN and FuzzyEn had very strong correlations (rs ⩾ 0.75; p < 0.001) for both 3 min and 5 min of recordings. For the other metrics, HRV–PRV correlations ranged from strong to moderate.
Table 2. Bland–Altman statistics for the difference between the autonomic nervous system (ANS) metrics estimated using the ECG signal (heart rate variability, HRV) and noninvasive arterial blood pressure (pulse rate variability, PRV) with respect to signal length (L). The results are presented as the means with 95% confidence intervals and expressed in respective units; rs nonparametric Spearman’s rho correlation coefficients for relationships between HRV and PRV metrics. The analysis is presented separately for signal lengths (L) of 3 min and 5 min.
L = 3 minHRV vs PRVBiasLLULrS (p-value)meanNN (ms)−0.14 (−1.01–0.73)−7.32(−8.83–−5.81)7.03 (5.52–8.54)0.99 (<0.001)SDNN (ms)−5.86 (−9.64–−2.08)−36.94 (−43.49–−30.39)25.22 (18.67–31.77)0.75 (<0.001)RMSSD (ms)−7.66 (−14.54–−0.77)−64.23 (−76.15–−52.31)48.92 (37.00–60.84)0.51 (<0.001)pNN20 (%)−2.08 (−3.98–−0.18)−17.70 (−21.00–−14.41)13.55 (10.25–16.84)0.85 (<0.001)pNN50 (%)0.66 (−1.89–3.22)−20.33 (−24.76–−15.91)21.66 (17.23–26.08)0.75 (<0.001)LFn (a.u.)0.02 (0.00–0.04)−0.15 (−0.19–−0.11)0.20 (0.16–0.23)0.88 (<0.001)HFn (a.u.)−0.03 (−0.06–−0.02)−0.21(−0.25–−0.17)0.13 (0.10–0.17)0.84 (<0.001)LF/HF (a.u.)0.30 (0.09–0.51)−1.43 (−1.79–−1.06)2.03 (1.67–2.40)0.82 (<0.001)SD1 (ms)−5.43 (−10.30–−0.55)−45.52 (−53.96–−37.07)34.66 (26.22–43.11)0.51 (<0.001)SD2 (ms)−6.42 (−9.90–−2.94)−35.00 (−41.02–−29.98)22.16 (16.14–28.18)0.85 (<0.001)ApEn (a.u.)−0.01 (−0.03–0.01)−0.19 (−0.23–−0.15)0.17 (0.13–0.21)0.50 (<0.001)FuzzyEn (a.u.)0.04 (0.01–0.07)−0.23 (−0.29–−0.17)0.30 (0.25–0.36)0.79 (<0.001)MSEn (a.u.)0.02 (−0.04–0.07)−0.40 (−0.49–−0.32)0.44 (0.35–0.52)0.53 (<0.001)SampEn (a.u.)0.11 (0.04–0.18)−0.46 (−0.58–−0.34)0.69 (0.57–0.81)0.56 (<0.001) L = 5 minHRV vs PRVBiasLLULrS (p-value)mean NN (ms)−0.45 (−1.01–0.12)−5.12(−6.11–−4.14)4.23 (3.24–5.21)0.99 (<0.001)SDNN (ms)−4.30 (−7.39–−1.21)−29.72 (−35.07–−24.36)21.12 (15.76–26.48)0.77 (<0.001)RMSSD (ms)−5.32 (−11.37–0.72)−55.05 (−65.52–−44.57)44.40 (33.93–54.88)0.55 (0.001)pNN20 (%)−1.96 (−3.95–0.04)−18.36 (−21.81–−14.90)14.44 (10.99–17.90)0.83 (<0.001)pNN50 (%)1.38 (−1.36–4.12)−21.14 (−25.88–−16.39)23.90 (19.16–28.65)0.72 (<0.001)LFn (a.u.)0.01 (−0.04–0.02)−0.11 (−0.13–−0.08)0.13 (0.10–0.15)0.92 (<0.001)HFn (a.u.)−0.03 (−0.04–−0.01)−0.16 (−0.19–−0.13)0.10 (0.08–0.13)0.90 (<0.001)LF/HF (a.u.)0.24 (0.06–0.41)−1.19 (−1.50–−0.89)1.67 (1.37–1.97)0.88 (<0.001)SD1 (ms)−3.77 (−8.05–0.51)−38.97 (−46.39–−31.56)31.44 (24.02–38.86)0.55 (<0.001)SD2 (ms)−4.92 (−7.65–−2.19)−27.34 (−32.07–−22.62)17.50 (12.78–22.23)0.87 (<0.001)ApEn (a.u.)0.02 (−0.01–0.04)−0.14 (−0.17–−0.10)0.17 (0.14–0.20)0.62 (<0.001)FuzzyEn (a.u.)0.03 (0.00–0.06)−0.22 (−0.27–−0.17)0.27 (0.22–0.32)0.81 (<0.001)MSEn (a.u.)0.03 (−0.01–0.06)−0.23 (−0.28–−0.17)0.28 (0.23–0.34)0.77 (<0.001)SampEn (a.u.)0.10 (0.04–0.16)−0.39 (−0.49–−0.29)0.60 (0.49–0.70)0.56 (<0.001)Abbreviations: meanNN, mean intervals between normal R-peaks, SDNN, standard deviation of the R–R intervals; RMSSD, square root of the mean of the squared successive differences between adjacent R–R intervals; pNN20 and pNN50, proportions of R–R intervals greater than 20 ms or 50 ms out of the total number of R-R intervals, respectively; LFn, HFn, normalized PSD of the R–R interval time series in the low-frequency range (LF, 0.04–0.15 Hz) and the high-frequency range (HF, 0.15–0.40 Hz), obtained by dividing the respective power spectra by a total power (TP, 0.04–0.40 Hz); LF/HF; low-to-high frequency ratio; SD1, Poincaré plot standard deviation perpendicular the line of identity; SD2, Poincaré plot standard deviation along the line of identity, MSEn, multiscale entropy; ApEn, approximate entropy; SampEn, sample entropy, and FuzzyEn, fuzzy entropy. Please note that R–R intervals refer to HRV metrics, and N–N intervals refer to PRV metrics, UL, upper limit of agreement; LL, lower limit of agreement.
The Bland–Altman analysis results for the agreement between HRV and PRV metrics, estimated separately from 3 min and 5 min of recordings, are presented in table 2. MeanNN values were comparable between HRV and PRV, regardless of recording length (bias < 0.5 ms). Good agreement was found for frequency-domain metrics (LFn: bias of 0.02 (0.00–0.04) for L = 3 min; HFn: bias of −0.03 (−0.04–−0.01) for L = 5 min; supplementary figures 2(A) and (B)). The selected entropy-based metrics also showed good agreement between HRV and PRV, with narrow limits of agreement (ApEn: bias of −0.01 (−0.03–0.01) for L = 3 min; FuzzyEn: bias of 0.03 (0.00–0.06) for L = 5 min; supplementary figures 3(A) and (B). In contrast, values of SDNN and RMSSD were consistently lower for HRV than for PRV, with relatively wide limits of agreement (SDNN: bias of −5.86 (−9.64–−2.08) ms for L = 3 min; RMSSD: bias of −5.32 (−11.37–−0.72) ms for L = 5 min; supplementary figures 4(A) and (B). Similarly, SD1 and SD2 values were significantly lower for HRV, with relatively wide limits of agreement (SD1: bias of −5.43 (−10.30–−0.55) ms for L = 3 min; SD2: bias of −4.92 (−7.65–−2.19) ms for L = 5 min, see supplementary figures 5(A) and (B). The level of agreement between HRV and PRV was comparable for both L = 3 min and L = 5 min, indicating that recording length did not significantly influence the agreement.
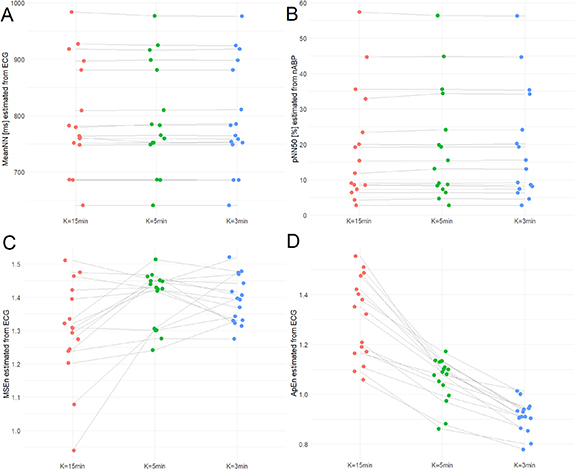
4.3. The effect of calculation window shortening on HRV and PRV metricsSixteen subjects (median age: 21 (19–24) years; 9 men, 7 women) were included in the analysis of the impact of calculation window size (15 min, 5 min, and 3 min) on HRV and PRV metrics. The EtCO2 level and respiratory rate were within the normal range throughout the entire recording time (39.1 ± 4.9 mmHg and 17 ± 3 breaths min−1, respectively). results are presented in table 3. A shorter window size was associated with lower values of selected time-domain metrics (SDNN: p = 0.003 for HRV, p < 0.001 for PRV; RMSSD: p = 0.003 for HRV, p = 0.005 for PRV). Despite these differences, ICC analysis indicated excellent agreement across all analyzed window sizes. The highest ICC values were observed for meanNN (ICC = 1.0 for both HRV (figure 3(A)) and PRV) and pNN50 (ICC = 1.0 for HRV and PRV (figure 3(B))). Window size also had a significant effect on frequency-domain metrics. Shorter windows were associated with higher LFn and HFn values (p < 0.001 for both HRV and PRV). The lowest agreement across window sizes for frequency-domain metrics was found for LFn (HRV: ICC = 0.94 (0.87–0.98); PRV: ICC = 0.93 (0.85–0.97)). For nonlinear metrics, a shorter window size resulted in lower SD2 values in both HRV (p = 0.003) and PRV (p < 0.001). It also significantly affected selected entropy-based metrics: ApEn decreased (p < 0.001 for both HRV and PRV), whereas FuzzyEn increased (p < 0.001). The lowest ICC values were observed for MSEn (HRV: ICC = 0.33 (0.01–0.74); figure 3(C)) and ApEn (HRV: ICC 0.49 (0.19–0.76); figure 3(D)). The impact of sex and window size on ANS metrics is presented in the supplementary materials.
Figure 3. A comparison of selected heart rate variability (HRV) metrics (A), (C), (D) and pulse rate variability (PRV) metrics (B), derived from calculation windows (K) of 15 min (red dots), 5 min (green dots) and 3 min (blue dots) using ECG (A), (C), (D) and noninvasive arterial blood pressure (nABP) signals (B). Panels (A) and (B) demonstrate metrics with good agreement and negligible influence of window size, whereas panels (C) and (D) show poor agreement with a significant effect of window size. Abbreviations: MSEn, multiscale entropy; meanNN, mean interval between normal R-peaks; ApEn, approximate entropy; pNN50, proportion of R–R intervals greater than 50 ms out of the total number of R-R intervals.
Download figure:
Standard image High-resolution imageTable 3. Linear (time and frequency) and nonlinear metrics of heart rate variability (HRV) and pulse rate variability (PRV) were estimated from short-term recordings (15 min) of ECG and noninvasive arterial blood pressure (nABP), respectively. Data are presented as median ± interquartile range. The differences in HRV (or PRV) metrics, when estimated using different window sizes (K = 15 min, K = 5 min, and K = 3 min) were verified using the Friedman ANOVA test and marked as asterisks (if significant) and presented with intraclass correlation coefficient (ICC).
HRV (n = 16)PRV (n = 16)ANS metricsK = 15 (min)K = 5 (min)K = 3 (min)ICC (95% CI)K = 15 (min)K = 5 (min)K = 3 (min)ICC (95% CI)mean NN (ms)772 ± 139774 ± 140774 ± 1391.0774 ± 138774 ± 139774 ± 1391.0SDNN (ms)63 ± 3464 ± 3359 ± 32**0.99 (0.98–1.0)57 ± 4857 ± 4956 ± 46***1.0 (0.99–1.0)RMSSD (ms)44 ± 4544 ± 4441 ± 43**0.98 (0.96–0.99)50 ± 3949 ± 3648 ± 35**0.98 (0.98–1.0)pNN20 (%)51 ± 3051 ± 3051 ± 301.0
Comments (0)