
Remember me


Myocardial fibrosis, the final histological endpoint of numerous myocardial diseases, occurs when cardiac fibroblasts are activated and differentiate into myofibroblasts in response to cardiac injury, mechanical stress, or inflammation. These activated myofibroblasts then produce excessive amounts of extracellular matrix proteins, particularly type I collagen (about 80% of total collagen), leading to pathological scarring and stiffening of the heart muscle. Expansion of the volume of extracellular matrix relative to the total myocardial volume can be measured non-invasively, also known as extracellular volume (ECV) fraction.
The most well-established modality used to assess ECV is cardiac magnetic resonance (CMR) imaging. CMR allows for the accurate and non-invasive assessment of myocardial fibrosis by calculating the ECV using gadolinium, an extracellular contrast agent. Following a bolus injection, gadolinium enhances signal intensity on T1-weighted images and remains in the extracellular space for up to 15 min. Post-contrast T1 maps are generated, comparing myocardial T1 values to those of the blood pool. CMR-derived ECV correlates well with histological diffuse interstitial fibrosis [1] and cardiovascular outcomes [2, 3]. However, CMR is hampered by limited availability, longer examination times, restrictive weight limits and claustrophobia [4].
Cardiac computed tomography (CT) is a more accessible imaging modality. CT-derived ECV is an emerging biomarker for myocardial fibrosis, utilising changes in myocardial and blood attenuation values between myocardial non-contrast and late iodine enhancement images to determine the concentration of extracellular iodinated contrast in the myocardium. The process typically involves three steps: a low-dose non-contrast acquisition to determine baseline attenuation values (often using calcium scoring images), administration of iodine-based contrast medium followed by standard arterial contrast-enhanced acquisition, and a delayed scan (3 to 15 min after contrast administration) to allow for myocardial-blood contrast equilibration. CT-ECV is then calculated on a pixel-by-pixel basis using the formula:
$$\:ECV\:=\:(1\:-\:haematocrit)\:\times\:\:\left(\frac\right)$$
where ΔHUmyocardium is the change in myocardial attenuation (in Hounsfield units) from pre- to post-contrast, ΔHUblood is the change in blood pool attenuation from pre- to post-contrast, and haematocrit is the cellular volume fraction of blood. This method allows for accurate quantification of myocardial extracellular volume, providing a non-invasive measure of diffuse myocardial fibrosis. CT-ECV correlates strongly with CMR-ECV [5], and is also a useful biomarker for numerous cardiac diseases. This review article summarises recent developments in CT-ECV assessment and protocols, and emerging utility in cardiomyopathies, valvular heart disease, cancer therapy related cardiac dysfunction and cardiac amyloidosis.
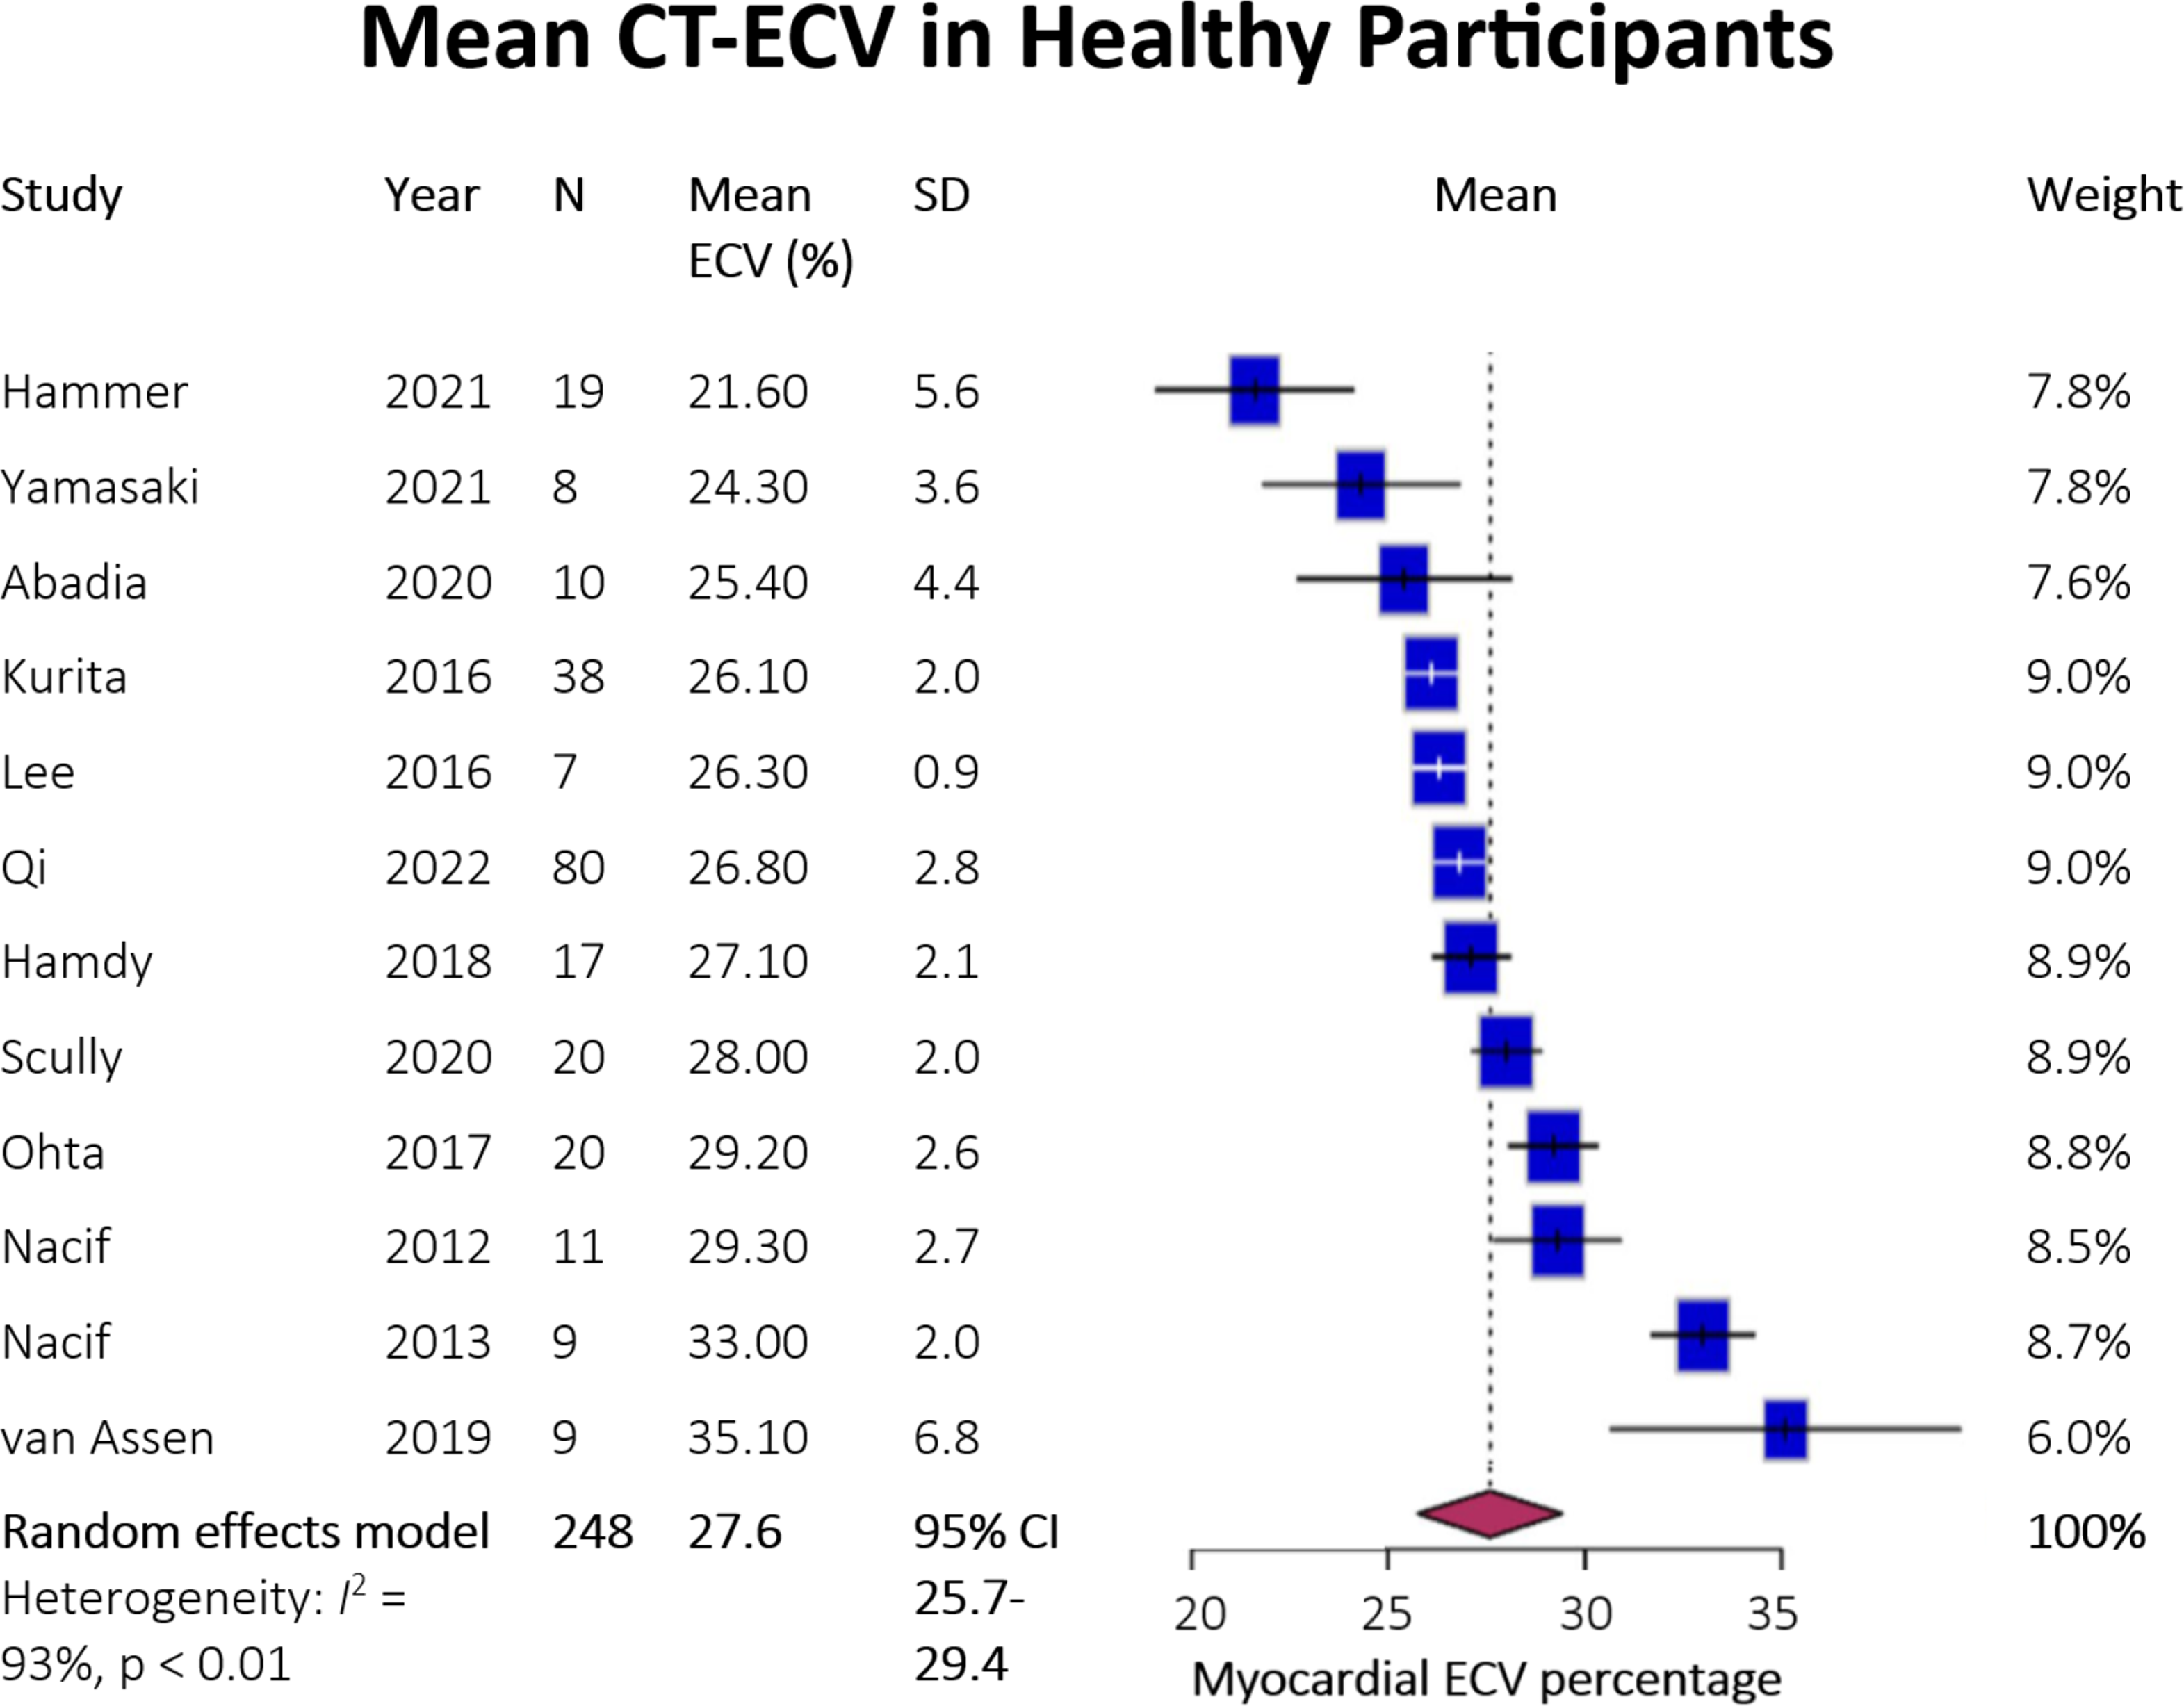
Acquisition ProtocolsThere is considerable heterogeneity in CT-ECV measurements, part of which can be attributed to acquisition protocols. Muthalaly et al. performed a meta-analysis of mean CT-ECV in healthy participants, with significant variation identified (mean pooled estimate 27.6%, range 21.6– 35.1%) with substantial heterogeneity (I²=93%) between studies [6], as seen in Fig. 1. This variability highlights the critical need for protocol standardisation to establish reliable diagnostic and prognostic thresholds.
Fig. 1
Forest Plot of Estimates of ECV Fraction in Healthy Individuals from a Range of Studies. Adapted from “Myocardial extracellular volume measurement using cardiac computed tomography” by R. Muthalaly, 2024, The International Journal of Cardiovascular Imaging. CC BY 4.0
The timing of post-contrast imaging significantly impacts the accuracy of CT-ECV quantification. Notable studies that have examined this are listed below in Table 1. The most common delay is 7 min post-contrast, used in the majority of studies [7]. However, varying approaches with delays ranging from 3 to 12 min have been reported. Hamdy et al. found no significant differences in ECV values between 3, 5, and 7-minute delays in both normal and infarcted myocardium [8]. Treibel et al. demonstrated that 5-minute post-contrast imaging provided stronger correlation with CMR-ECV (r²=0.85) compared to longer delays, with better signal-to-noise ratios (4.7 ± 0.9 vs. 3.9 ± 0.9 at 15 min) [9]. Jablonowski et al. demonstrated elegantly in a swine model that blood-myocardial equilibrium is reached after 5 min post-contrast, with measurements remaining stable for up to 15 min afterward [10]. The optimal timing appears to be 5–7 min, balancing the need for adequate contrast equilibrium between plasma and interstitial spaces while maintaining practical workflow efficiency. This timing allows for accurate ECV quantification while minimising overall scan duration. Notably, while CMR protocols typically recommend a minimum 10-minute delay, CT imaging can achieve reliable measurements with shorter delays, offering potential advantages in clinical implementation through reduced total examination times.
Table 1 Studies comparing late enhancement imaging at different post-contrast intervals, with validation against other modalities used for myocardial tissue characterisation. *Only 10 min ECV reportedFig. 2
Single and dual energy CT workflow for extracellular volume assessment. Adapted from “Prognostic value of measurement of myocardial extracellular volume using dual-energy CT in heart failure with preserved ejection fraction” by Y. Jiang, 2024, Scientific Reports; and “Myocardial Extracellular Volume Quantification Using Cardiac Computed Tomography: A Comparison of the Dual-energy Iodine Method and the Standard Subtraction Method” by T. Emoto, 2021. CC BY 4.0. https://creativecommons.org/licenses/by/4.0/
The selection of scanning mode significantly impacts CT-ECV image quality and measurement accuracy. Koike et al. demonstrated that high-pitch helical scanning is associated with suboptimal image quality for global ECV assessment (OR = 2.26, 95% CI 1.07–4.94, p = 0.036), particularly in patients with intracardiac leads (OR = 4.91, 95% CI 1.78–14.1, p = 0.002) or elevated BMI ≥ 35 kg/m² (OR = 2.80, 95% CI 1.12–6.98, p = 0.026) [11]. They also demonstrated that sequential acquisition with prospective ECG-triggering provides more reliable ECV measurements than high-pitch scans, with better reproducibility for both septal and global ECV quantification. The sequential mode’s step-and-shoot method minimises motion artifacts by acquiring images during periods of minimal cardiac movement, typically in mid-diastole. While high-pitch scanning offers faster acquisition times and lower radiation doses (1.68 mSv vs. 2.31 mSv for sequential), this comes at the cost of reduced image quality that can compromise ECV measurements. Modern photon-counting detector CT systems have shown promise in achieving adequate image quality for ECV quantification at lower radiation doses (median 1.2 mSv) while maintaining measurement accuracy [12].
Dual energy CT (DECT) offers the advantage of generating iodine concentration maps without a dedicated pre-contrast scan when compared with single energy CT (SECT). Single-energy CT (SECT) requires two separate scans - a non-contrast scan and a post-contrast scan - to calculate ECV through subtraction. In contrast, dual-energy CT (DECT) can generate iodine-specific images and virtual non-contrast images from a single delayed acquisition, eliminating the need for a separate non-contrast scan (see Fig. 2 for comparison of acquisition protocols). DECT achieves this through simultaneous imaging at two different energy levels, typically 80/140 kV or 100/140 kV, allowing for material decomposition and direct iodine quantification. This approach reduces potential misregistration errors that can be incurred by two scans at separate time points as required by SECT. Multiple studies have shown that DECT-derived ECV measurements demonstrate stronger correlation with CMR-ECV (r = 0.94) compared to SECT (r = 0.87) [13, 14]. Studies have also shown that DECT provides more stable measurements across different heart rates, while SECT accuracy may be affected by higher heart rates [15].
DECT using spectral CT technology enables the generation of virtual monoenergetic images (VMI) at different energy levels, with 40–50 keV providing optimal contrast-to-noise ratios for ECV assessment [16]. Model-based iterative reconstruction (MBIR) incorporating sophisticated beam-hardening correction has shown smaller mean absolute differences between CT and MRI-derived ECV values (3.74% vs. 4.95%) when using DECT [17].
While DECT traditionally required higher radiation doses, modern protocols have achieved comparable exposure levels to SECT. Current DECT protocols for the delayed enhancement CT scan report effective doses ranging from 2.5-5.2 mSv, compared to 2.0-5.8 mSv for SECT protocols [14, 16, 18,19,20,21]. The introduction of photon-counting detector CT has further reduced radiation exposure for DECT to 1.2-2.0 mSv while maintaining measurement accuracy [12, 22].
DECT shows particular promise in specific clinical scenarios such as cardiac amyloidosis, where the improved contrast-to-noise ratio and reduced susceptibility to artifacts are especially beneficial. The technique demonstrates excellent reliability with intraclass correlation coefficients of 0.93 (95% CI 0.82–0.97) compared to 0.88 (95% CI 0.73–0.95) for SECT when validated against CMR [23]. However, the availability of DECT systems remains limited compared to conventional CT scanners, which may impact widespread clinical adoption.
Photon Counting CTPhoton-counting detector CT (PCD-CT) represents a significant advancement in cardiac imaging technology, particularly for extracellular volume (ECV) quantification. As illustrated in Fig. 3, this novel technology directly converts x-ray photons to electrical signals using semiconductor detectors, offering several advantages over conventional energy-integrating detectors including increased contrast-to-noise ratio, improved spatial resolution, and reduced electronic noise [24].
Fig. 3
Photon-counting detector CT utilises a semiconductor detector to directly convert photons to electrical signals by creating electron-hole pairs, the number of which are directly proportional to the photon energy. The energy can be quantified and photons separated into distinct energy levels, allowing for multi-energy acquisition and generation of virtual mono-energetic images
The first clinical whole-body, dual-source PCD-CT system enables accurate ECV quantification through late enhancement (LE) scanning at remarkably low radiation doses. Studies have demonstrated median dose length products of only 2.2 mSv for LE scans, making it an attractive option for routine clinical use [12]. The system’s inherent spectral capabilities allow for direct computation of dual-energy iodine images from the LE scan, eliminating the need for separate non-contrast acquisitions.
PCD-CT offers two distinct modalities for ECV quantification, similar to conventional energy-integrating detector CT: the conventional and the spectral (or dual energy) method. The conventional approach calculates ECV by measuring the change in CT attenuation between pre-contrast and LE images, while the spectral method constructs iodine maps using data from multiple different energy regimes- this can be greater than two, as seen in dual energy CT detectors [25]. Studies have shown excellent correlation between these methods (r = 0.87), with small mean differences (0.9%) and narrow limits of agreement (-3.3–5.0%) [12].
Virtual monoenergetic imaging (VMI) capabilities of PCD-CT allow for optimization of image contrast and noise characteristics. Research has shown that VMI reconstructions at 65 keV provide optimal results for ECV quantification [26]. The technology’s improved spatial resolution and reduced blooming artifacts are particularly valuable in patients with extensive coronary calcification or stents.
The system’s dual-source configuration provides high temporal resolution, essential for cardiac imaging. When combined with ECG-gating and quantum iterative reconstruction, it delivers high-quality images with minimal motion artifacts. Table 2 summarises the studies that have validated this technology against cardiac MRI, showing strong correlation in ECV measurements while offering advantages in terms of accessibility and scan time.
Table 2 Studies examining photon-counting detector CT use for ECV assessmentSynthetic ECVSynthetic extracellular volume (ECV) calculation has emerged as a valuable alternative to laboratory-based haematocrit measurements for CT-based myocardial characterisation. This approach addresses practical limitations of obtaining timely blood samples and simplifies clinical workflow. The concept of synthetic ECV builds upon research validating similar techniques in cardiac MRI. In CT imaging, synthetic haematocrit can be derived from the attenuation of blood pool on non-contrast images, based on the principle that blood attenuation correlates with haematocrit levels. Studies using photon-counting detector CT (PCD-CT) have demonstrated excellent correlation between synthetic and laboratory-based ECV calculations [27].
Recent validation studies using PCD-CT have shown that synthetic ECV measurements achieve comparable accuracy to traditional methods. Mergen et al. demonstrated strong correlation between blood and synthetic ECV measurements, with a mean difference of -0.2% and narrow limits of agreement (lower limit, -2.4%, upper limit 2.0%) [27].
The advantages of synthetic ECV extend beyond workflow efficiency. The inherent spectral capabilities of dual energy CT enable direct computation of iodine maps from late enhancement scans, eliminating the need for separate non-contrast acquisitions. When combined with synthetic haematocrit calculation, this creates a streamlined approach requiring minimal additional patient preparation or laboratory testing. However, certain limitations must be considered. The accuracy of synthetic ECV may be affected by conditions that alter blood composition or in cases of extreme haematocrit values. Additionally, standardisation of acquisition protocols and reconstruction parameters remains crucial for reliable synthetic ECV quantification across different clinical settings.
Automated ECV QuantificationArtificial Intelligence (AI) and deep learning algorithms have revolutionised cardiac CT imaging, particularly for extracellular volume (ECV) quantification. Recent advancements have focused on optimising both acquisition protocols and post-processing workflows to enhance efficiency and accuracy.
In acquisition protocols, AI-assisted technologies have demonstrated the ability to reduce radiation exposure while maintaining image quality. Yu et al. developed a deep learning model that demonstrated superior performance in generating denoised late iodine enhancement images with the highest signal-to-noise and contrast-to-noise ratios, enabling more accurate ECV quantification from single-stack CT data [28]. Post-processing automation has seen significant progress through the implementation of convolutional neural networks (CNNs). These algorithms can automatically segment myocardium and blood pool regions, dramatically reducing processing time and minimising interobserver variability [29]. MBIR, incorporating sophisticated beam-hardening correction models has shown smaller mean absolute differences between CT and MRI-derived ECV values (3.74% vs. 4.95%) compared to hybrid iterative reconstruction (HIR) that is conventionally used to correct beam hardening artifacts on CT [17]. The implementation of MBIR has particularly improved accuracy in inferior myocardial segments, where beam-hardening artifacts traditionally pose significant challenges. It currently requires substantial computational resources and longer duration per acquisition compared with HIR however, limited its widespread implementation in clinical practice.
Fig. 4
Utilities and applicability of CT-derived extracellular volume fraction
Clinical UtilityNon-ischaemic Dilated Cardiomyopathy (NIDCM)CT-derived extracellular volume fraction (CT-ECV) has demonstrated utility across various cardiac conditions. Baggiano et al. found that in NIDCM, although CT-ECV values were slightly underestimated compared to CMR-ECV (31.8 ± 6.5% vs. 33.9 ± 8.0%, p < 0.001), they demonstrated strong correlation (r = 0.819, 95% CI 0.791–0.844) [30]. The technique enables differentiation between diseased and normal myocardium through both global and segmental analysis, with NIDCM patients showing significantly higher ECV values (31.35 ± 2.53% vs. 26.62 ± 2.69%) compared to controls, with a sensitivity of 91% and specificity of 86% at a ECV cutoff of 28.8% [31]. CT-ECV also demonstrates prognostic value in NIDCM, with a threshold > 32.3% associated with an 8-fold risk for predicting a composite endpoint of cardiovascular death, fatal arrhythmic events and heart failure hospitalization [32].
Heart Failure with Preserved Ejection Fraction (HFpEF)Recent work by Jiang et al. explored the prognostic utility of CT-ECV in HFpEF, demonstrating that patients with ECVs in the top tertile have higher rates of heart failure hospitalization and all-cause death (HR 1.17, 95% CI 1.06–1.30, p = 0.001) [33]. The heterogeneity of HFpEF patients has led to difficulties identifying specific high-risk markers of mortality. Further studies are needed to validate CT-ECV for use in this area.
Cancer Therapy-Related Cardiac DysfunctionCT-derived extracellular volume fraction (CT-ECV) has emerged as a valuable tool for detecting and monitoring cardiotoxicity in cancer patients. Monti et al. demonstrated that CT-ECV increases significantly after anthracycline therapy, with pre-treatment values of 27.0% ± 2.9% rising to 31.1% ± 4.9% post-treatment (p < 0.001), indicating myocardial injury even in the absence of clinical symptoms [4]. Chiocchi et al. revealed different patterns of CT-ECV changes between doxorubicin and epirubicin-trastuzumab treated patients, with doxorubicin showing persistently elevated ECV values (22% increase at 1 year, remaining elevated at 5 years), while epirubicin-trastuzumab demonstrated an initial peak followed by partial recovery [34]. The technique has particular utility in breast cancer patients, where Monti et al. found good correlation with CMR-derived values, as well as good reproducibility (ICC 0.78–0.80). Chiocchi et al. further demonstrated CT-ECV’s ability to detect subclinical cardiac damage before it becomes apparent by conventional echocardiographic parameters, with values increasing from 26.7% ± 4% at baseline to 32.7% ± 4% at one year in epirubicin-trastuzumab treated patients [34]The value of CT-ECV in detecting subclinical cardiac toxicity also extends to immune checkpoint inhibitors (ICIs), with myocarditis being increasingly recognised as a rare but fatal complication of treatment. Wang et al. showed that there is an increase in septal CT-ECV (47.1% ± 7.48% vs. 52.6% ± 7.6%, p < 0.001) over a 12-month period following initiation of ICI therapy for lung and oesophageal cancer [35], with higher 12 month values in CTRCD positive patients (55.14 ± 8.11%). It is worth noting that there was a very short post-contrast interval of 80 s prior to delayed scan acquisition, for which standard values of ECV have not been established in the literature.
CT derivation offers practical advantages over CMR, as CT-ECV can be calculated from routine staging scans, with acquisition of non-contrast and delayed phases for subtraction CT, while only requiring additional haematocrit measurement and ROI placement. The technique’s ability to provide whole-heart coverage in a single acquisition represents an advantage over traditional CMR-ECV assessment, which typically samples only three short-axis slices, making CT-ECV particularly valuable for conditions with heterogeneous myocardial involvement.
Cardiac AmyloidosisCT-ECV fraction demonstrates significant utility in cardiac amyloidosis detection and prognostication. Recent work by Kidoh et al. demonstrated that CT-ECV achieves 97% accuracy in diagnosing cardiac amyloidosis using a cutoff value of 37% [36], while Treibel et al. found mean CT-ECV values of 54% in cardiac amyloidosis compared to 28% in severe aortic stenosis patients [9]. Scully et al. also explored use of CT-ECV in discerning whether myocardial remodelling is due to aortic stenosis, amyloidosis, or both pathologies. CT-ECV values differed significantly between lone aortic stenosis (31 ± 5%), AS-ATTR (45 ± 12%), and lone ATTR (53 ± 13%), with optimal cutoff values of 36.6% for differentiating between lone AS and AS-ATTR [21]. This achieved an area under the curve of 0.87, outperforming conventional ECG and echocardiographic parameters. In a large cohort study of 552 patients, Kidoh et al. reported CT-ECV sensitivity of 90% and specificity of 92% for detecting cardiac amyloidosis using a 37% threshold, with an area under the curve of 0.97 [18]. The technique proves particularly valuable in differentiating between AL and ATTR amyloidosis subtypes, with mean septal ECV values of 42.7% and 55.8% respectively, as demonstrated by Gama et al. [37]. This same study showed that CT-ECV correlates significantly with important cardiac parameters including indexed left ventricular mass (r = 0.426), left ventricular ejection fraction (r = 0.460), NT-proBNP (r = 0.563), and high-sensitivity troponin T (r = 0.546).
Beyond diagnosis, CT-ECV demonstrates prognostic value, particularly in ATTR amyloidosis where it independently predicts all-cause mortality after adjustment for age and septal wall thickness (HR: 1.046) [37]. The technique offers practical advantages over CMR, especially in patients with contraindications to magnetic resonance imaging or those on dialysis. Recent work by Yamasaki et al. has shown that systematic screening using CT-ECV can identify concealed cardiac amyloidosis in specific populations, such as atrial fibrillation patients undergoing catheter ablation [38]. This screening approach identified that among 342 patients referred for AF ablation, 19.6% had red-flag signs warranting CT-ECV assessment, leading to the diagnosis of wild-type ATTR-CM in previously unidentified cases. The technique’s utility extends to patients undergoing transcatheter aortic valve replacement evaluation, where the prevalence of concomitant cardiac amyloidosis can be as high as 16% [39]. CT-ECV offers the advantage of simultaneous assessment of coronary anatomy and myocardial tissue characterization in a single examination, providing comprehensive cardiac evaluation while maintaining high diagnostic accuracy. Importantly, simplified approaches such as myocardium-to-lumen signal ratio in delayed phase CT demonstrate comparable diagnostic performance (AUC 0.96) to formal CT-ECV quantification, offering a practical alternative when unenhanced CT or haematocrit values are unavailable.
Aortic StenosisCT-ECV demonstrates significant clinical utility in aortic stenosis for myocardial assessment and risk stratification. Kato et al. established through meta-analysis that CT-ECV values are significantly elevated in aortic stenosis compared to controls (31.9% vs. 28.5%, p = 0.002), with even higher values seen in cardiac amyloidosis (48.9%) [40]. Kirigaya et al. demonstrated that abnormal CT-ECV strongly predicts adverse events in patients undergoing aortic valve replacement, OR 4.53 for composite adverse events including all-cause death and heart failure hospitalisation [41]. In patients specifically undergoing TAVR, the prognostic value was even stronger with OR 4.85. The clinical importance of these findings is further emphasised by recent work showing that comprehensive myocardial assessment combining CT-ECV with CT-derived global longitudinal strain provides powerful prognostic information, with elevated values of both markers associated with a hazard ratio of 7.14 for adverse outcomes post-TAVR [42]. The diagnostic accuracy of CT-ECV for cardiac amyloidosis is particularly noteworthy, with meta-analyses showing sensitivity of 92.8% and specificity of 84.8%, achieving an area under the summary receiver-operating characteristic curve of 0.94 [40]. This robust diagnostic performance, combined with its integration into routine pre-TAVR CT assessment, positions CT-ECV as a valuable tool for comprehensive evaluation of aortic stenosis patients, particularly in identifying those at higher risk of adverse outcomes and detecting concurrent cardiac amyloidosis.
Future ApplicationsCT late enhancement imaging has already demonstrated great diagnostic and prognostic potential in a variety of myocardial diseasesas seen in Fig. 4, and similar to CMR, new patterns of disease will continue to be recognised and expand the utilities of CT-ECV in clinical practice.
Inconclusive diagnosis of acute troponin-positive chest pain after routine clinical evaluation is a common scenario in emergency departments, with numerous life-threatening pathologies conceivably the cause such as aortic dissection, acute myocardial infarction and pulmonary embolism. Triple rule out CT (TRO CT) scans do not identify non-vascular causes of chest pain, and cardiac MRI has historically been the investigation of choice to investigate myocardial infarction after obstructive coronary disease has been excluded. Palmisano et al. demonstrated myocardial characterisation with late-contrast enhancement and evaluation of ECV after TRO CT improved diagnostic yield from 50 to 90% (P < 0.001), with over half of the patients left without a diagnosis post TRO-CT subsequently found to have myocarditis [43], as defined as subepicardial/mid wall scar and an increase in ECV. It is unclear whether ECV will have a role in chest pain diagnosis in the future - further studies are required to determine its utility in acute chest pain evaluation.
Other utilities that have been explored for CT-ECV include assessment of myocardial viability, with one case report using DECT to demonstrate non-transmural infarction, as suggested by discrepant anterior endocardial and epicardial ECVs, in the left anterior descending coronary artery vascular territory [44]. A case report of right ventricular insertion point late iodine enhancement and ECV elevation as cardiac sequelae of portopulmonary hypertension was a novel idea exploring ECV quantification for right heart pathologies [45]. Si-Mohamed et al. demonstrated ECV assessment is an alternative and feasible strategy for diagnosis of acute myocarditis when it is clinically suspected [46]. As the practicality and utility of CT in myocardial tissue characterisation is increasingly recognised, and is adopted into routine cardiac CT workflows, it is likely that CT-ECV will be utilised as an adjunct to traditional anatomical CT data to provide new insights into myocardial disease.
Suggested ProtocolSuggested protocol
Single energy CT
Dual energy CT
Scan mode
Prospective ECG triggered axial scan
Tube voltage
Comments (0)