2.1 Participants
The data were collected via an anonymous online survey generated with the Google Form platform using a snowball sampling method between February and July 2022. The volunteers were recruited from the researchers' pool of acquaintances, word of mouth, and online social networks. All individuals with the following characteristics were eligible for enrollment: adults aged at least 18 years and individuals who could answer the online questionnaire independently. This second criterion translated into the ability to read and understand written Italian and the ability to use the computer to answer the questionnaire. Individuals diagnosed with cardiovascular disease were excluded from study participation for consistency with the original validation study [10].
People could access the questionnaire through an anonymous link without having to authenticate. The study was conducted following the American Psychological Association [11] ethical standards for treating human experimental volunteers and with the understanding and the written consent of each participant in compliance with the indications of the Declaration of Helsinki. Indeed, the participants were informed about the purposes of the study and gave informed consent electronically, and they could abandon completing the questionnaire without consequences. Privacy and anonymity were guaranteed to all participants. The data collected were stored electronically and managed only for scientific research, according to Italian Legislative Decree No. 101 of 10 August 2018, which regulates the protection of individuals concerning the processing of personal data.
2.2 Translation of the PRHDS Dread Risk
After obtaining the authors' written consent for the instrument's use and translation, PRHDS was culturally adapted to the Italian context. The adaptation of Brislin's model was used as a guide [12]. According to this methodology, a team approach was used during the retranslation process, which guaranteed high accuracy in the various stages of the cultural adaptation process. Two bilingual authors translated the text from English into Italian independently. A third investigator retranslated each version of the Italian text into the original (English) language.
Subsequently, all authors met in a consensus meeting to discuss the forward translation and find the best solution for the Italian context. A native speaker translated the final version of the instrument back into English. Finally, the instrument was submitted to the original author, who approved the new text formulation.
Following the recommendations of Polit and Beck [13], the face and content validity of the PRHDS were tested. Six panelists from outside the research group were involved: two nurses, two physicians, and two lay people. The panel of experts consisted of four women and two men. All experts had a university degree, and three had a Ph.D. Three open-ended questions were submitted to the panel to assess the instrument's face validity. We first asked these experts to rate each item's relevance to the conceptual definition. Then, we asked them to critique the clarity of each item in terms of content and style. Finally, we asked them to evaluate items' comprehensiveness on dichotomous and 4-point scales ranging from 1 (not relevant) to 4 (very relevant).
One of the most widely used measures to define content validity is the content validity index (CVI) [14]. The CVI includes the calculation of the Item Content Validity Index (I-CVI) and the Scale Validity Index (S-CVI).
The I-CVI is the index of inter-rater agreement [14] regarding the content validity of an individual scale item by simply expressing the proportion of agreement [15]. Content experts are asked to rate each item of the assessment instrument in terms of its relevance to the construct [15]. This is usually calculated by summing the number of experts who gave each item a rating of 3 or 4 on a 4-point Likert scale (1 = not relevant, 2 = somewhat relevant, 3 = fairly relevant, 4 = very relevant) [14] divided by the total number of experts involved in the rating [14, 15]. According to Lynn [16], the minimum acceptable value of I-CVI is closely related to the number of experts involved in the evaluation [14]. In fact, Lynn states that with a number of experts of six, the minimum acceptable I-CVI is 0.83 [14, 15], i.e. only one dissenting opinion (<4 on the Likert scale) [15]. Researchers have used the information on the I-CVI to guide them in the revision, deletion or replacement of items [15].
The S-CVI indicates the content validity of the overall scale [15]. To validate the PRHDS, the researchers used the Scale Validity Index Average (S-CVI/AVE), which is the average of the I-CVI for all items in the scale being assessed [15]. According to the literature, the standard criterion for acceptability when calculating the S-CVI/AVE is 0.80 [14]. This parameter has been calculated as the sum of the values of the individual I-CVIs divided by the number of items under analysis [14, 15].
2.3 Assessment of Other Indicators
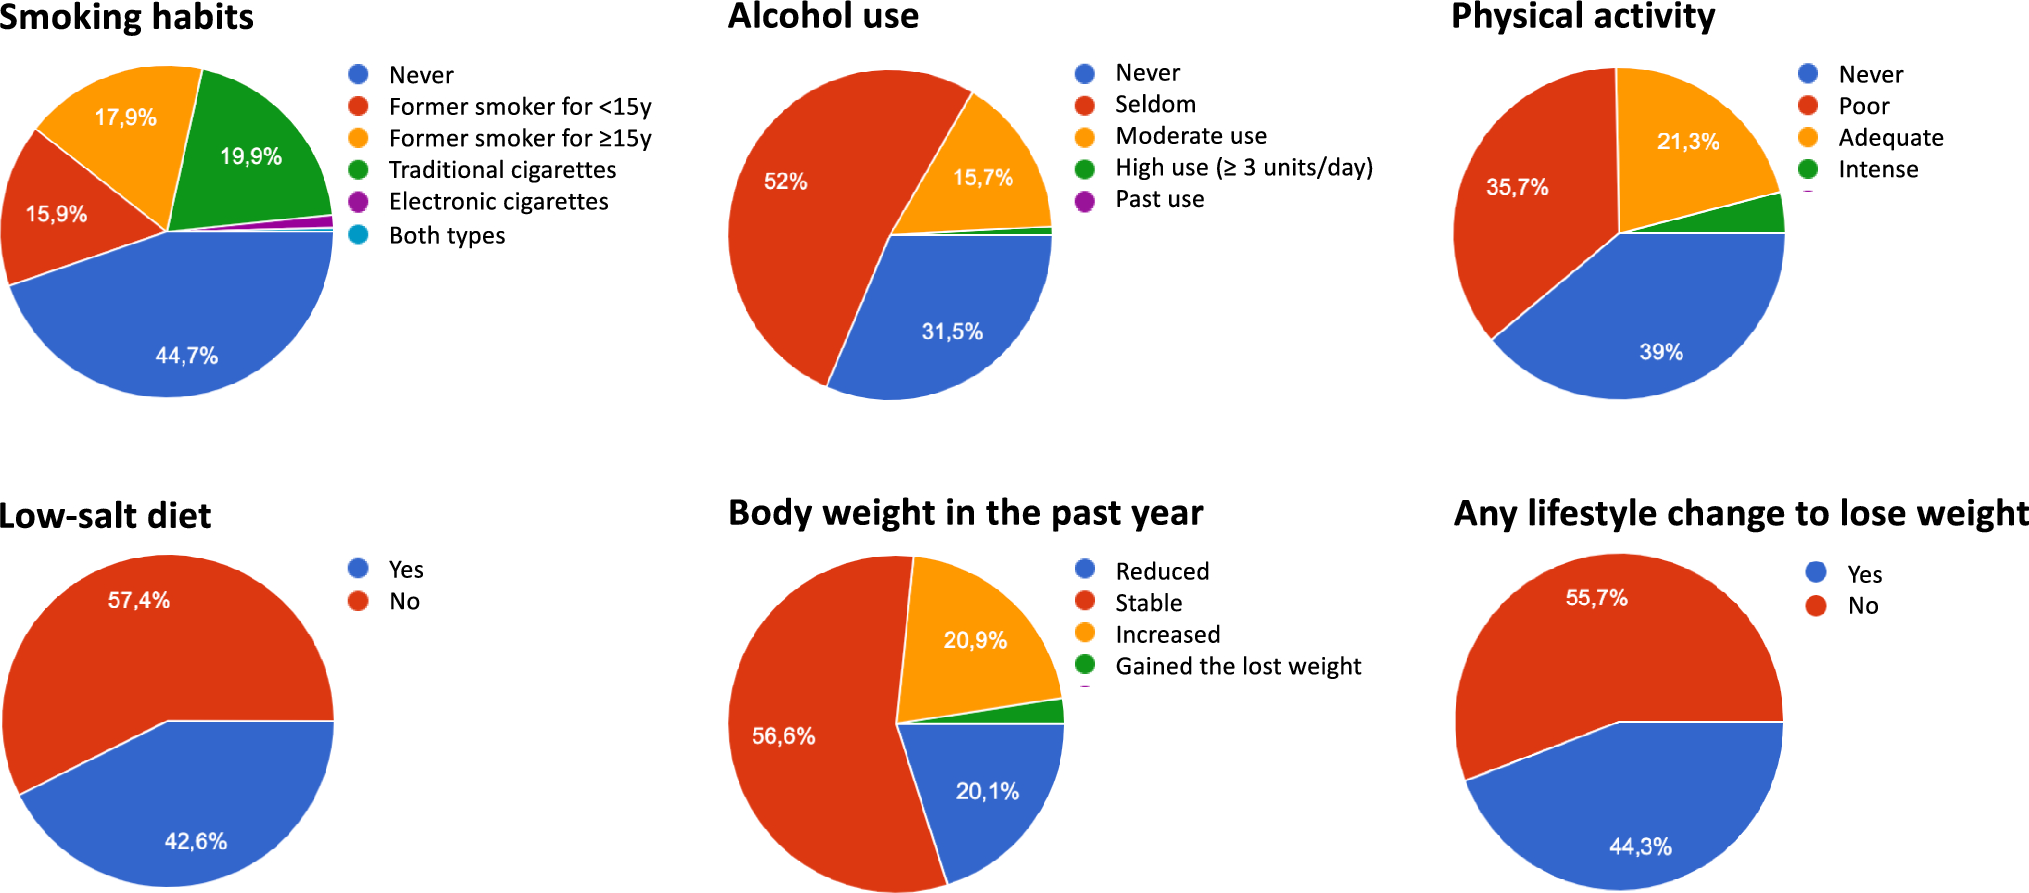
In addition to the Italian version of the PRHDS, the online questionnaire collected demographic (i.e., age, gender, education, working status, marital status) and anthropometric (body mass index, BMI) information. Moreover, it collected clinical information (family history of cardiovascular diseases) and information about the presence of cardiovascular risk factors (hypertension, hypercholesterolemia, and diabetes). Age and BMI were treated as continuous variables. All the other variables were treated as dichotomous variables (Table 1).
Table 1 Sample sociodemographic and health status characteristics. Total Sample; n = 772Perceived Health was assessed through a single question. Participants had to complete the sentence “Would you say your health is” by marking an adjective on a 5-point Likert scale, where 1 was “bad”, and 5 was “excellent”.
2.4 Statistical Analysis
The items of the Brief PRHDS were preliminarily submitted to analyses to check the normal distribution by calculating mean, standard deviation, and indices of skewness and kurtosis; West and colleagues [17] recommend concern if skewness > |2| and kurtosis > |7|.
We used a brief version of the original scale. Therefore, using two different samples, we tested its dimensionality through Exploratory Factor Analysis (EFA) followed by Confirmatory Factor Analysis (CFA). This approach is the most common to scale development and validation [18]. Our sample size (772 individuals) was sufficient to use EFA in a random split-half of the sample and CFA in the second split-half. The minimum sample size for carrying out the factorial analysis was established following the indications of Nunnally [19], who suggested that the minimum ratio between the number of subjects and the number of variables is 10:1. In the case of the present study, the minimum number of subjects for conducting the analyses was 140. Therefore, the total sample was randomly divided into two samples of 386 individuals.
Regarding EFA, we ran the Kaiser Meyer Olkin (KMO) and Bartlett's test of sphericity to be sure that the correlation matrix could be subjected to analyses. KMO should be > 0.6, and Bartlett's test of sphericity should be significant. The criterion of eigenvalue greater than one, analysis of the scree plot, explained variance and theoretical sense determined the best-fitting factor solution. In the first stage, all items were included. Subsequent factor analyzes were conducted iteratively, eliminating one item at a time until a stable factor solution was found. Items with a factor loading < 0.32 were progressively excluded. After the first step, items loading at > 0.32 on more than one factor were excluded. Loadings in the 0.32 range or above are generally considered the cut-off on substantial loadings [20].
Regarding CFA, we used the Maximum Likelihood (ML) estimation method. A unidimensional factor model was tested to examine the factorial structure of the Brief PRHDS. The model loaded all items onto a single latent factor, assuming that all items tap into the same underlying latent construct (i.e., Cardiovascular Risk Perception). The model was initially run without specified error correlations. The potential modification of this model was based on the modification indices and content-based considerations. The goodness of fit of the model was evaluated using the χ2, the Tucker–Lewis incremental fit Index (TLI) [21], the Comparative Fit Index (CFI) [22], the standardized root-mean-square residual (SRMR; Pavlov et al., 2020), and the Root Mean Square Error of Approximation (RMSEA) [23]. Values close to 0.06 for the SRMR and RMSEA indicate a good fit; between 0.06 and 0.08 a moderate fit and values larger than 0.10 indicate a poor fit [24]. For the CFI and TLI, values of 0.95 or above indicate a good fit, whereas values of 0.90 and < 0.95 are taken as marginally acceptable fit [24].
The reliability of the Brief PRHDS was assessed based on internal consistency, calculating Cronbach’s alpha (1971), McDonald’s omega (1999), and the item’s inter-correlation coefficients. Cronbach’s alpha and McDonald’s omega above 0.60 are acceptable, and the item's inter-correlation coefficients higher than 0.30 are adequate [25].
Finally, we investigated the association of the Brief PRHDS scores with sociodemographic variables (i.e., age, gender, education, marital status), health status indicators (i.e., BMI, family history of cardiovascular diseases, hypertension, hypercholesterolemia, and diabetes) and the perceived health measure.
The association between the Brief PRHDS scores and continuous variables (i.e., age, BMI, and perceived health) was evaluated by correlations. Following guidelines by Cohen (1988), we interpreted correlations as measures of effect size. Correlations were considered weak (|0.10| < r < |0.29|), moderate (|0.30| < r < |0.49|), or strong (|0.50| < r < |1|). The association between the Brief PRHDS scores and categorical variables (i.e., gender, education, marital status, familiarity with cardiovascular diseases, hypertension, hypercholesterolemia, and diabetes) was evaluated by a series of independent sample t-tests. Assumption checks were performed before each t-test by evaluating skewness and kurtosis to check the normal distribution of the variables and Levene’s test to check the variances' homogeneity. Based on the assumption checks results, t-tests were performed using Welch's Test (unequal variances) or Student’s Test (equal variances).
All statistical tests were two-tailed, and a p ≤ 0.05 was considered statistically significant. Data analyses were performed using the IBM SPSS Statistics for Windows, version 26.0, and Jamovi, version 2.2.5.


Comments (0)