
Remember me


National Health and Nutrition Examination Survey (NHANES) was designed as a cross-sectional study for determining public health and nutrient-related levels among American citizens. Conducted every two years, the survey includes sociodemographic characteristics, dietary and health-related questions, physical examination and laboratory indicators from representative samples of 15 cities (counties) throughout the US. The National Center for Health Statistics Ethics Review Committee authorized the extraction of data as well as use for this project.
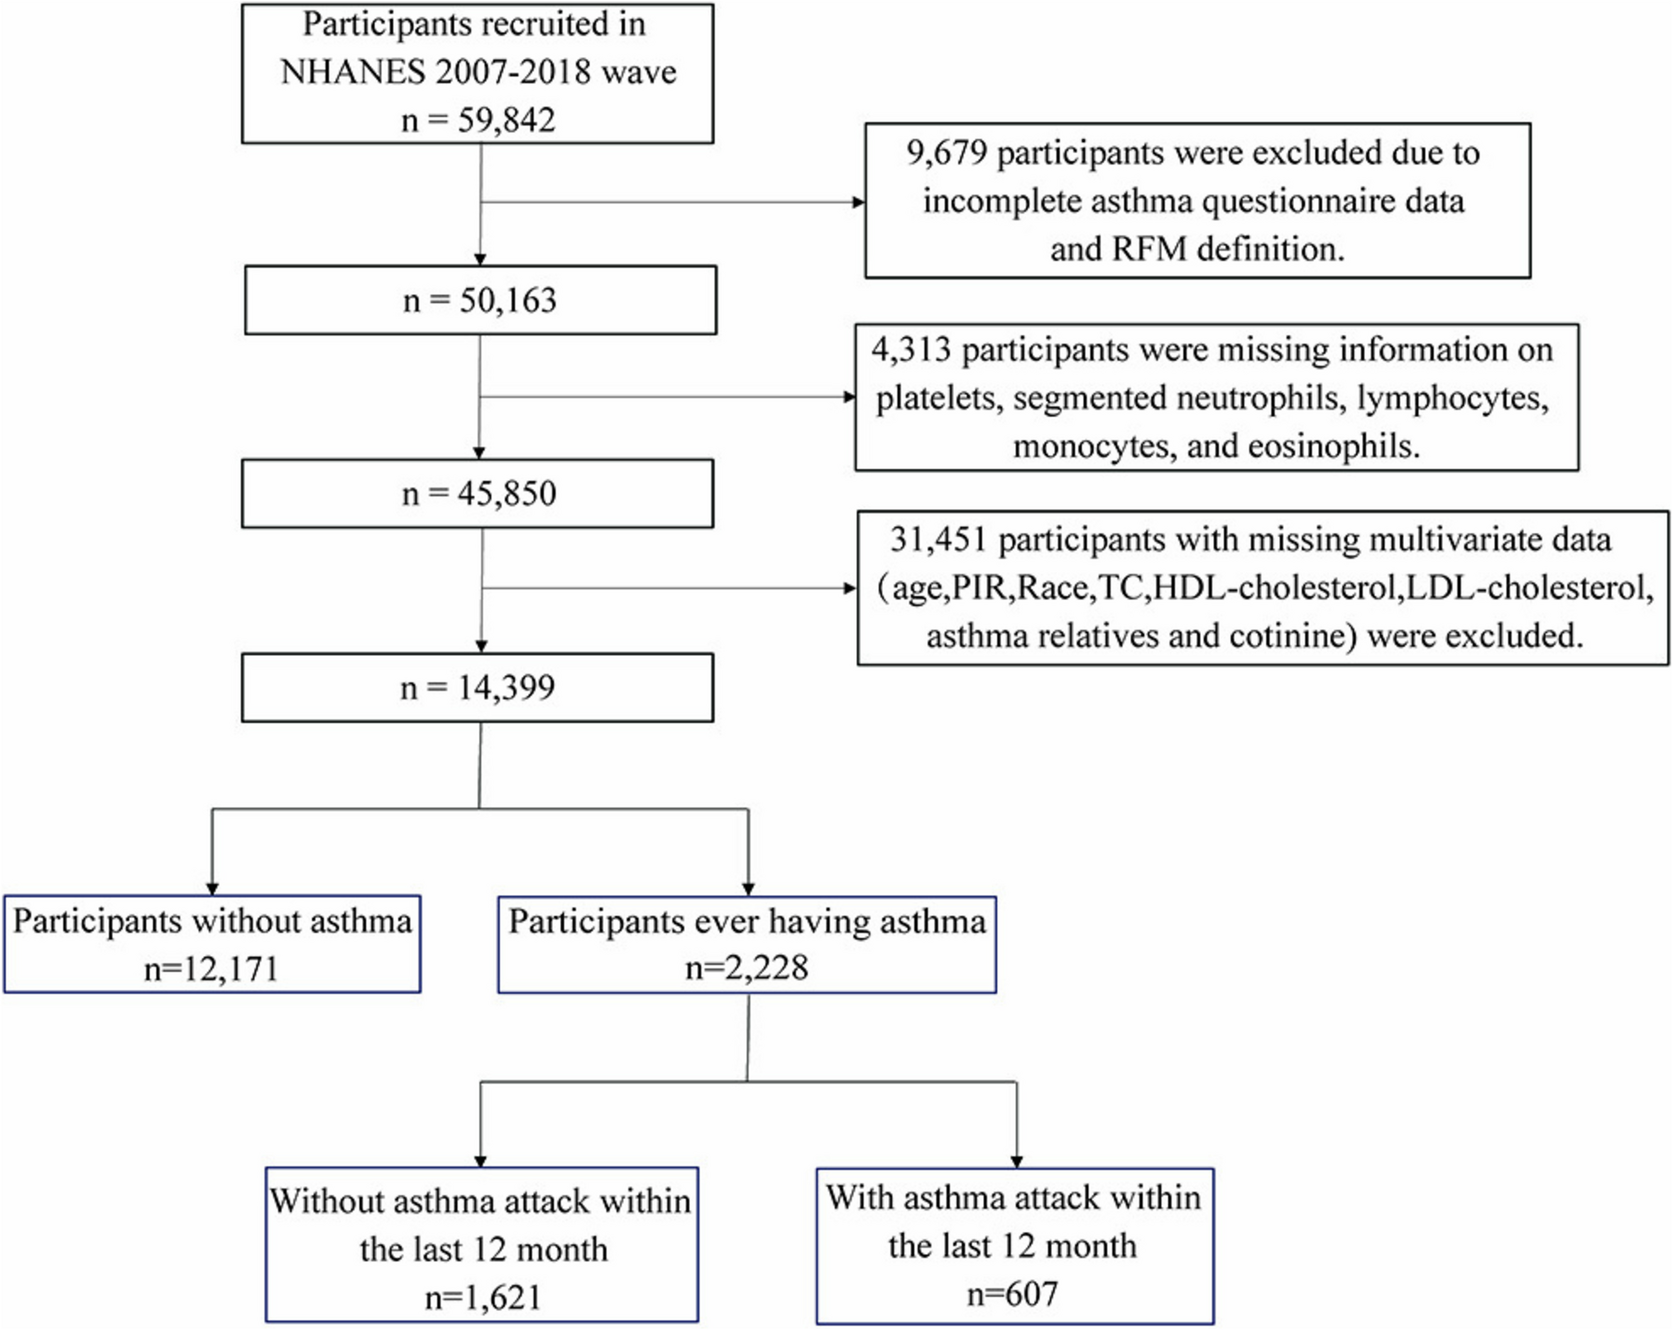
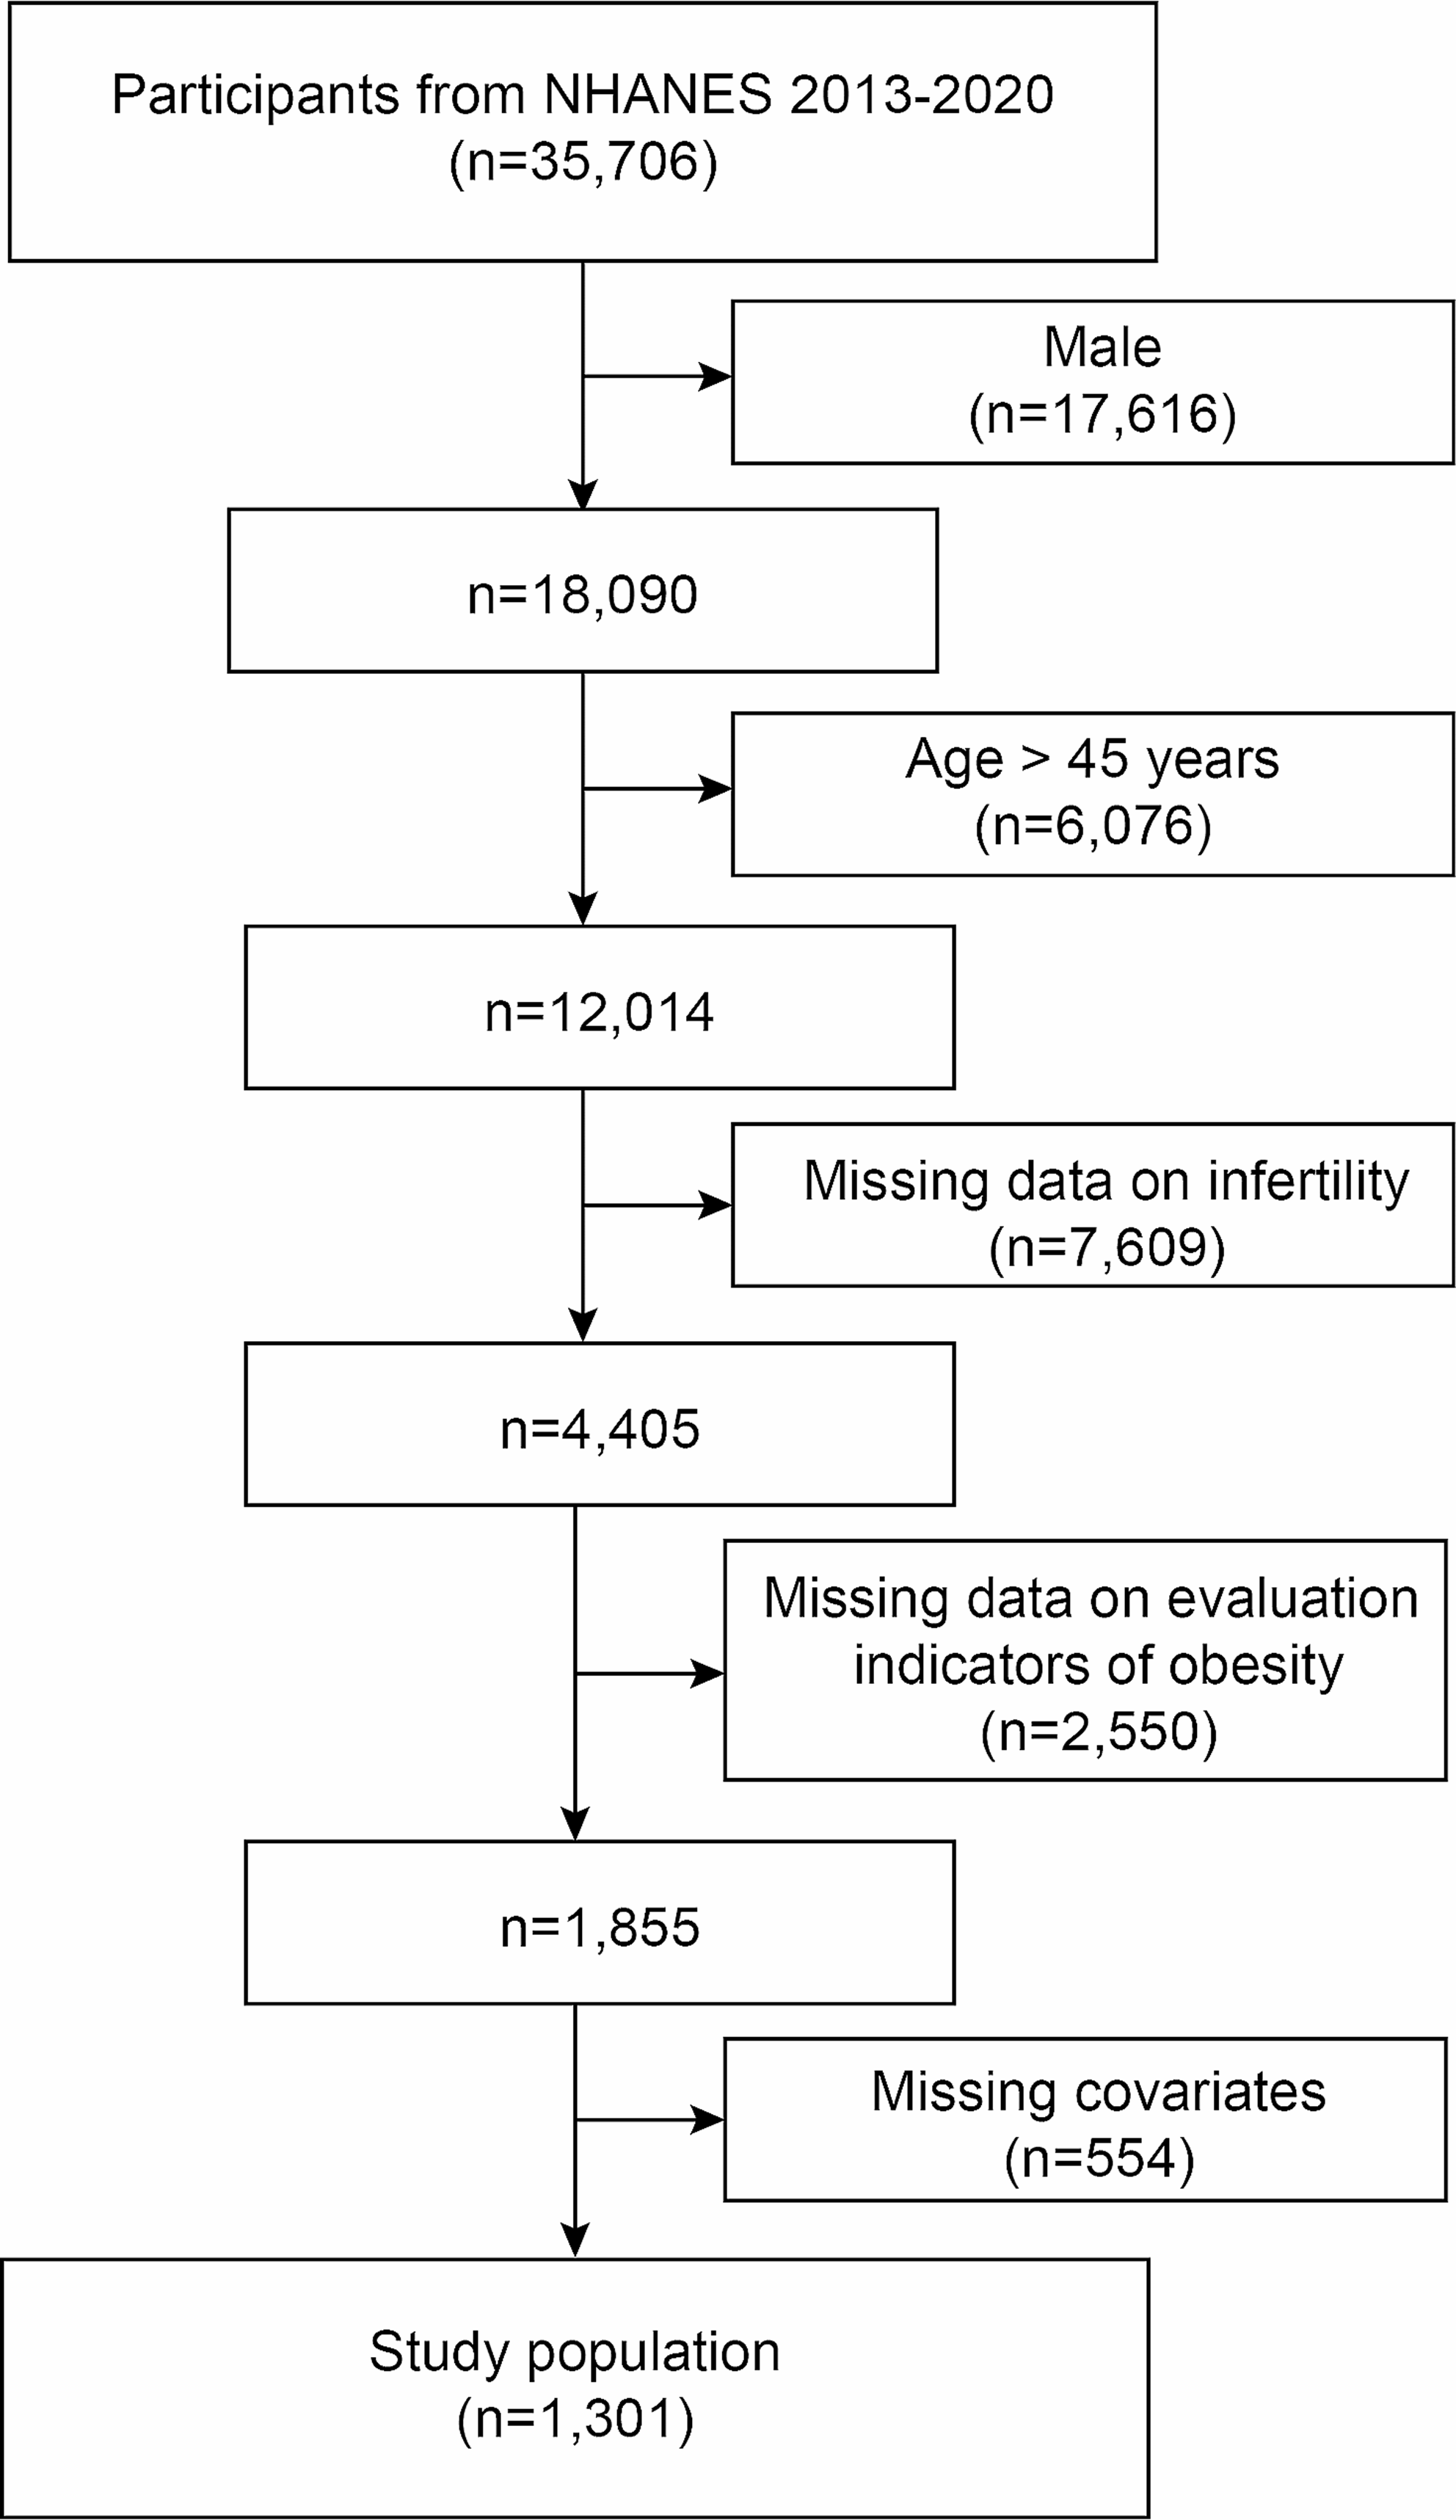
This was a longitudinal analysis that extracted data from the NHANES database for 2001 to 2010 (5 two-year cycles) and integrated them. A total of 51,952 participants who completed medical evaluations at the NHANES ambulatory screening centre were enrolled. The following parameters were applied to determine hyperlipidaemia: LDL-C (≥ 130 mg/dL), total cholesterol (≥ 150 mg/dL), triglycerides (≥ 200 mg/dL), HDL-C (male < 40 mg/dL or female < 50 mg/dL), as well as utilizing blood lipid-lowering medication [20]. After excluding those aged < 20 years (n = 16,078) and those without hyperlipidaemia at baseline (n = 5364), 18,443 hyperlipidemic subjects aged ≥ 20 years remained. Participants with missing DII information (n = 776), missing follow-up data (n = 18), and missing covariate information involved in this study (n = 3189) were further excluded. As shown in Figs. 1, 14 and 460 subjects were ultimately included in this study for analysis.
Fig. 1
Inclusion and exclusion process of the NHANES 2001–2010
Independent variable acquisitionTwo 1-day diet recall surveys were employed to collect the dietary data of all participants. In this investigation, the DII score was generated using twenty-eight nutrients for evaluating the degree of potential inflammation in dietary components: total fat, omega-3 fatty acids, niacin, caffeine, energy, fibre, folic acid, partial fat-soluble vitamins (A, D, and E), beta-carotene, partial fat-soluble vitamins (thiamin, pyridoxine, cyanocobalamin, and ascorbic acid), selenium, polyunsaturated fatty acids, Mg, Fe, zinc, omega-6 fatty acids, protein, carbohydrates, alcohol, cholesterol, monounsaturated fatty acids, and saturated fat [15]. The calculation process of the DII was as follows: First, the corresponding nutrients were Z-transformed by comparing the mean and standard deviation of 45 dietary nutrients in the global dietary standard library. After twice the converted value for data centralization, “1” was deducted from the Z-transformed score to get its percentage result. Second, the obtained values were multiplied by the relevant impact scores for achieving the DII score for every kind of nutrient. Third, all food nutrients were totaled for the purpose of determining every individual’s DII score.
CovariatesThe covariates were selected as confounders based on their biological plausibility or prior research investigations. Continuous variables included age (in years) and estimated glomerular filtration rate (eGFR, measuring unit is millilitres per minute per square metre). Categorical variables consisted of sex (composed of male and female), poverty income ratio (PIR, three categories: less than 1.3 for low-income households, between 1.3 and 3.5 for middle-income households, and above 3.5 for high-income households), race (divided into non-Hispanic white, other races, Mexican American, and non-Hispanic black), educational background (three kinds: less than high-school certificate, high-school certificate, and above high-school certificate), smoker (yes or no), drinker (yes or no), body mass index (BMI, three categories: normal weight, overweight, and obesity), hypertension (yes or no), diabetes (yes or no), CKD (yes or no), cardiovascular disease (CVD, yes or no), antihypertensive agent (yes or no), and hypoglycaemic agent (yes or no). Smokers were defined by the interview questions, “Have you smoked 100 or more cigarettes during your entire life?” and “Did you continue to smoke at the time of the interview?”. If both answers were yes, the person was categorized into smokers’ group. Alcohol consumption was determined by the question “Do you drink alcohol at least 12 times a year?” (A 12-ounce beer, four-ounce wine, or one-ounce spirit is regarded as one time) [21]. BMI was computed according to height (meters, m) and weight (kilograms, kg) from the physical examination information (BMI = weight/height2, kg/m2) and grouped according to criteria appropriate for the US population into normal weight (the value of BMI less than 25), overweight group (the value of BMI from 25 to 29.9), and obese group (the value of BMI equal to or greater than 30). The eGFR was estimated on the basis of creatinine, with reference to the creatinine equation of the Chronic Kidney Disease Epidemiology Collaboration [22]. The definition of hypertension included a self-reported diagnosis of hypertension, a minimum value of 140 mmHg for systolic pressure, and/or a minimum value of 90 mmHg for diastolic pressure, along with administration of medications to control blood pressure. Diabetes was described by possessing at least one of the following characteristics: (1) a response of “yes” to the question regarding having been informed that they were suffering from diabetes, (2) a measured value of fasting plasma glucose equal to or greater than 126 mg/dL, or (3) a measured value of haemoglobin A1c equal to or greater than 6.5% [23]. CVDs consist of heart attacks, coronary cardiac diseases, congestive heart failure, and stroke. Click the link below for more details: https://www.cdc.gov/nchs/nhanes/about_nhanes.htm.
OutcomesLinked mortality files for public use were available from the NHANES website, which provided follow-up details since the date of participation in the survey until December 31, 2019. The outcome event in this study was all-cause mortality, that is, death from any cause. Regarding survival duration, if the subjects died before the follow-up deadline, the subjects died before the follow-up deadline, the survival time was the time of death minus the subjects’ baseline inclusion time; if the subjects did not die before the follow-up deadline, survival was the follow-up deadline minus the subjects’ baseline inclusion time.
Statistical analysisThe data analyses were undertaken according to the NHANES analysis guidelines, following the stratified, complex sample design and calculating sample weights. To obtain overall representative features, continuous parameters are described by weighted mean values (standard errors). Furthermore,
weighted T or weighted ANOVA tests were employed for assessing differences across groups. Categorical factors are represented in weighted frequencies (percentages) and were subjected to the weighted chi-square test. The Kaplan-Meier survival curve was plotted, as well as significance tests were performed by the log-rank test for the purpose of whether there were any differences among the groups of patients. The DII was used to assess its effect on mortality risk by employing multivariate Cox proportional hazards models, and considering the DII as both a continuous and a tertile parameter. All-cause mortality was treated as the dependent factor, meanwhile, the DII served as an independent parameter, and the first tertile group served as the control. Model 1 did not include any corrections; In Model 2, age, sex, and race were corrected; On the basis of Model 2, the third model further corrected for additional confounding factors, such as BMI group, PIR group, smoker, drinker, educational level, eGFR, hypertension, diabetes, CVD, CKD, taking antihypertensive drugs and taking hypoglycaemic drugs. There was a calculation of a weighted hazard ratio (HR) along with its weighted 95% confidence interval (CI). Immediately after that, Model 3 was tested for the presence of multicollinearity by the variance inflation factor (VIF) detection. In addition, a dose-response curve was also constructed using a restricted cubic spline (RCS) function as a way of examining the relationship between DII and the risk of death from all causes among hyperlipidaemic patients, with the same covariates adjusted as in Model 3. To investigate the robustness of the results, age, sex, race, BMI group, PIR group, smoker, drinker, educational level, CVD, diabetes, and hypertension were stratified, as well as explored whether there were interactions between these factors and the effect of the DII on mortality. To minimize potential reverse causality bias, Cox proportional hazards models were conducted again after exclusion of study subjects whose deaths occurred within 3 years of follow-up. For data processing, we selected R Studio (version 4.2.1) and Stata (version 18.0). The result of the test was considered significant as long as the value of P is less than 0.05.
Comments (0)