
Remember me
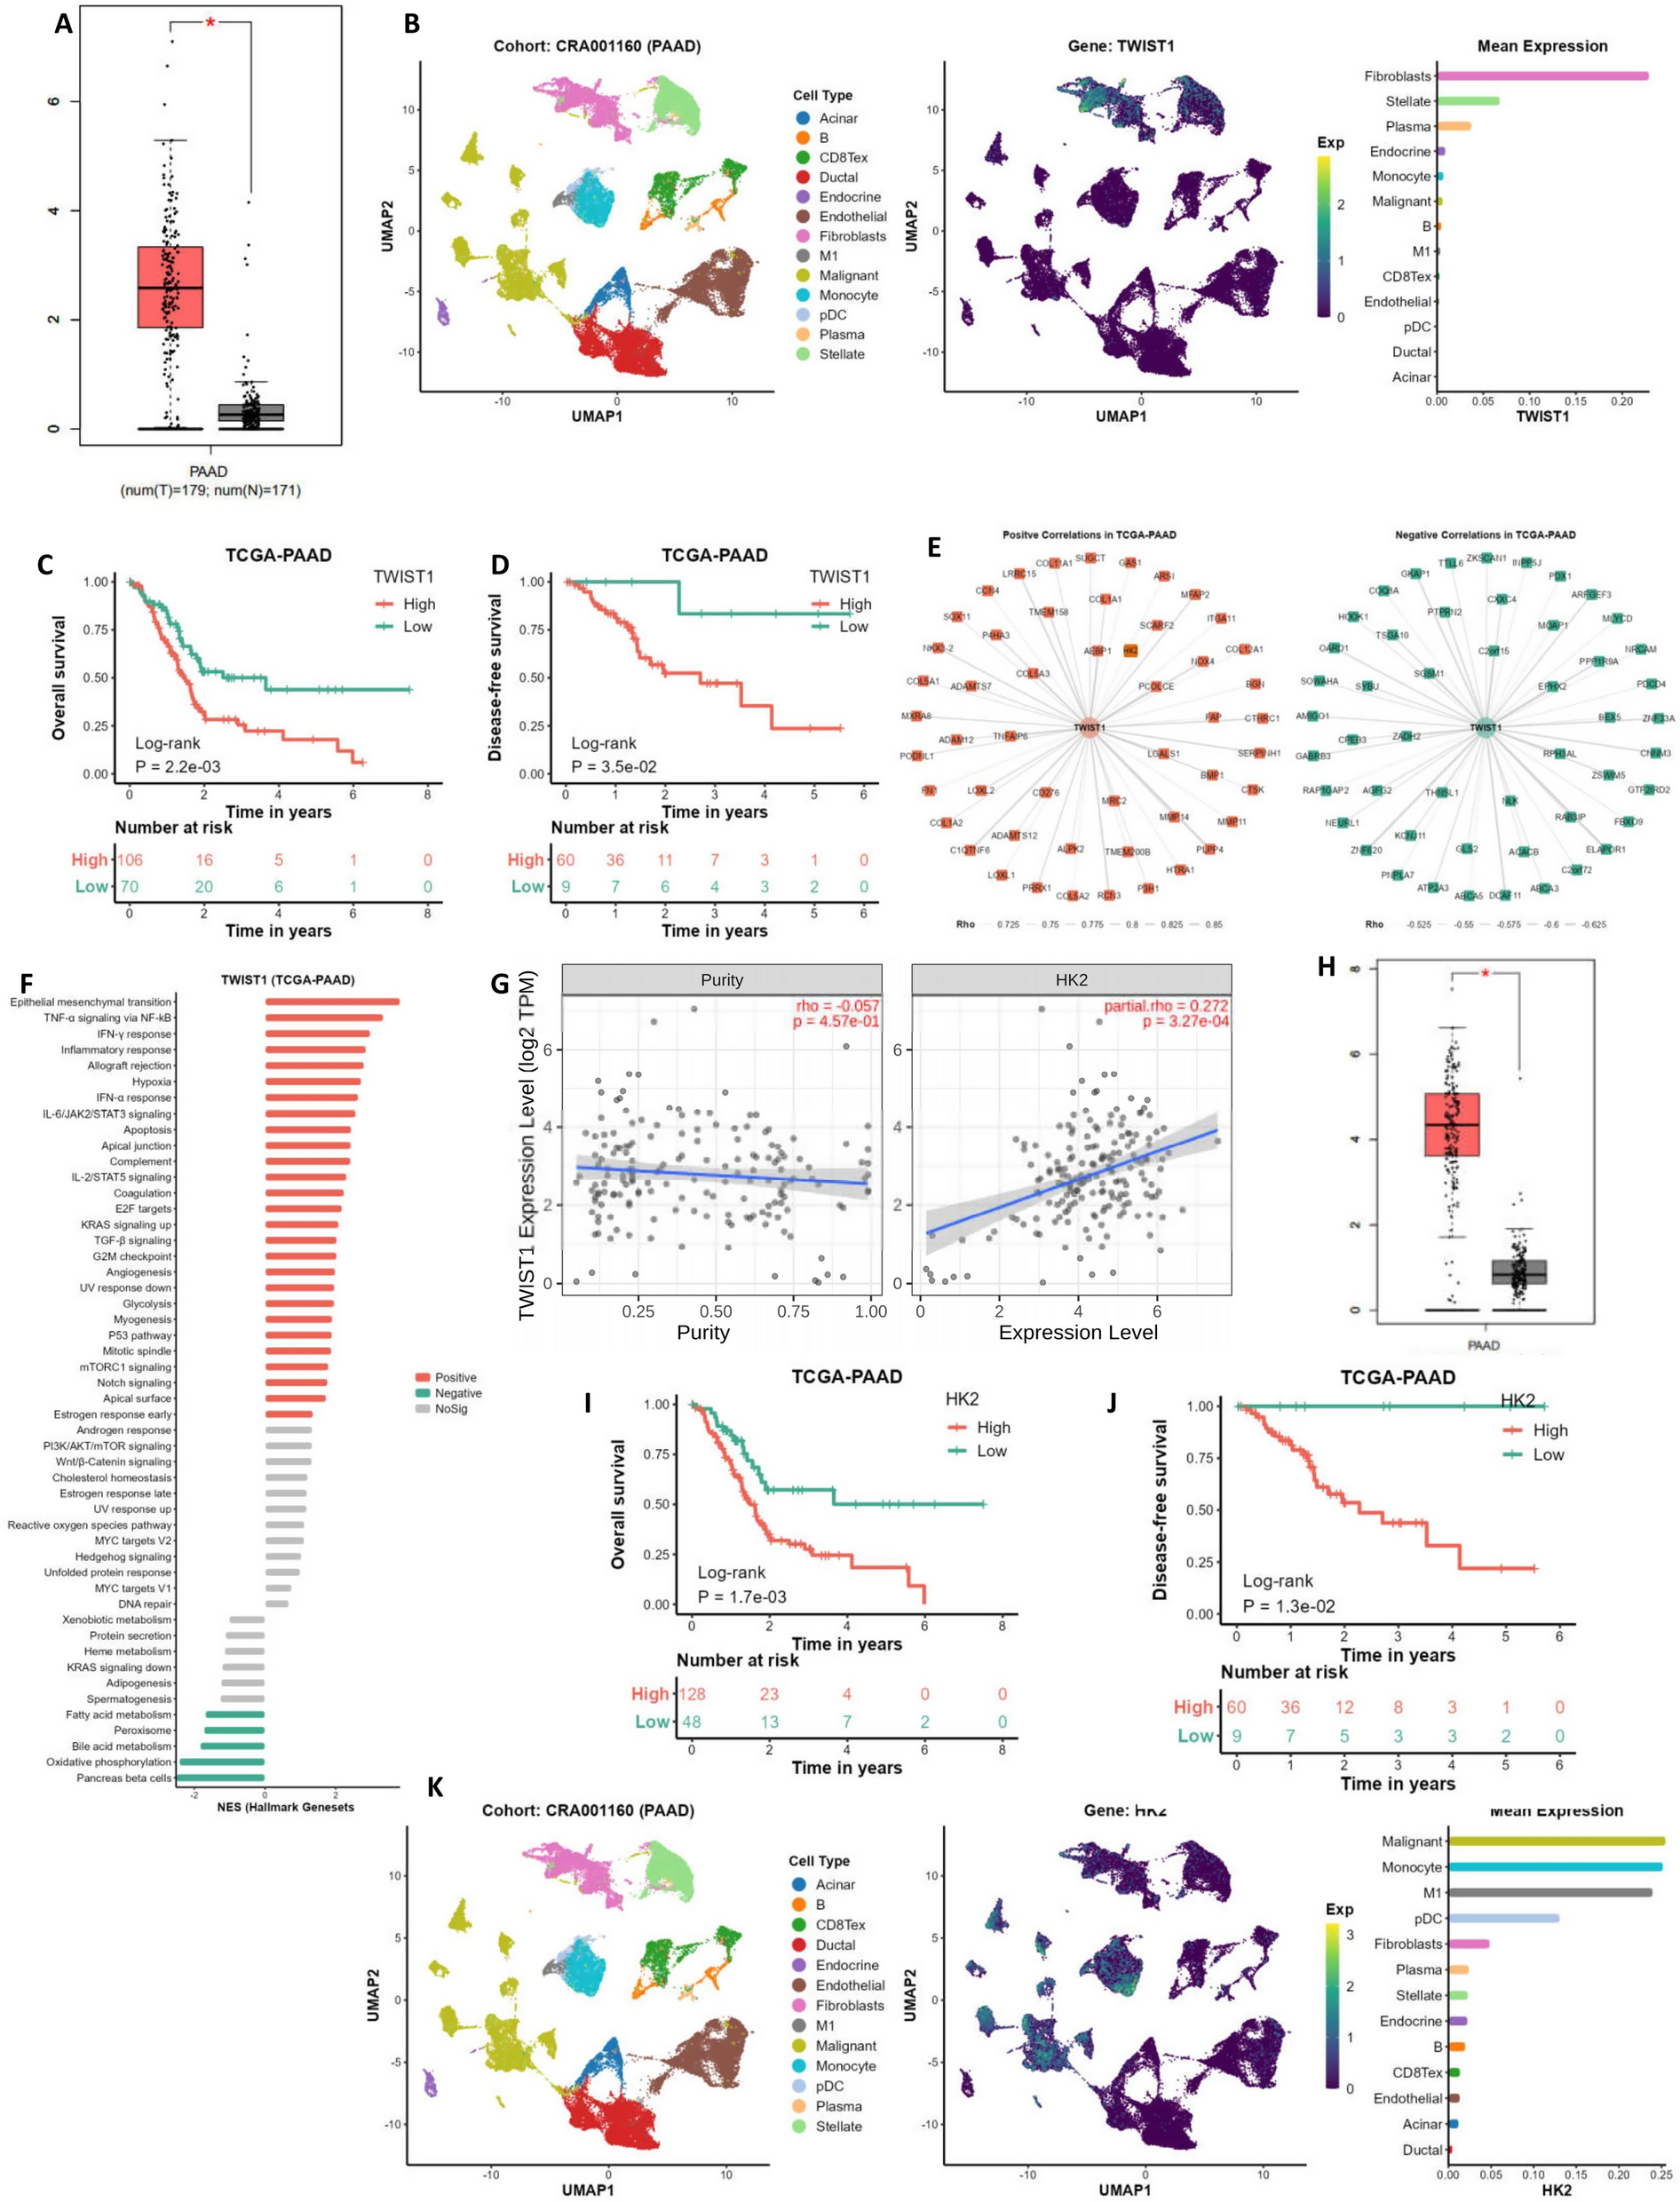


In this retrospective analysis of 89 patients with PLC and HM MPC (Fig. 1), the incidence has surged from 1.67 per year (2011–2013) to 16.3 per year (2020–2022) (Fig. 2A).
Fig. 1
Flow chart of the study design
Fig. 2
Epidemiological, clinical, and molecular characteristics of lung cancers in patients with multiple primary cancers involving lung cancer and hematologic malignancies. (A) Annual incidence rates of multiple primary cancers involving lung cancer and concurrent hematologic malignancies over the study period. (B) Time intervals between diagnosis of lung cancer and hematologic malignancy. (C) Distribution of lung cancer histological subtypes. (D) Frequencies of EGFR mutation subtypes identified among EGFR-mutant lung cancers
The median age at diagnosis was 66 years (range: 38–90 years), with 23.6% under 60 and 76.4% aged 60 or older. The male-to-female ratio was 1.47:1, with 31.5% having a smoking history (exclusively male smokers) and 10.1% reporting a family history of cancer. Comorbidities were present in 38.2% of patients, primarily hypertension. The majority had two primary cancers (89.9%), while a smaller subset had three or more (10.1%) (Table 1).
Table 1 General clinical characteristics of MPC patientsInterval between lung cancer and hematologic malignancyIn the cohort of 89 MPC cases, 10 were synchronous, and the remaining 79 were metachronous. For metachronous cases, the median duration between LC and HM diagnosis was 42.8 months (range: 6.8-221.3 months), with 64.6% occurring within a 5-year timeframe (Fig. 2B).
Pathology of cases with triple or more primariesIn the subset of 9 patients presenting with three or more primary cancers, the observed cancer types exhibited notable heterogeneity, as outlined in Table 2. The majority of hematologic malignancies were identified as multiple myeloma (n = 4) and lymphoma (n = 3). In the cases of lung cancer, adenocarcinomas predominated, except for a singular instance of squamous cell carcinoma.
Table 2 Distribution of Third or More Primary Cancers in Patients with Primary Lung Cancer Complicated by Hematological MalignanciesCharacteristics of lung cancerThe median age at lung cancer diagnosis was 65 years, with non-small cell lung cancer constituting 87.6% of cases. Within these cases, lung adenocarcinoma was the most prevalent subtype at 70.8% (Fig. 2C). At diagnosis, 43.8% of patients were stage I, 5.6% were stage II, 13.5% were stage III, and 18% were stage IV. The majority demonstrated a good performance status (PS), with scores of 0–1 in 76.4% and scores of ≥ 2 in 4.5%. Among the 89 MPC patients, 66.3% had a prior HM diagnosis, while 33.7% had LC as their initial malignancy (Table 3).
Table 3 Clinical Characteristics of Lung Cancer Patients with MPCMolecular profile of lung cancerIn a cohort of 38 LC patients, molecular testing revealed driver gene mutations in 84.2% of cases. The most prevalent driver mutations and their frequencies were as follows: EGFR at 74.2%, TP53 at 50%, ALK at 13.8%, RET at 13%, HER2 at 13%, MET at 8.3%, and BRAF at 8% (Supplementary Table 1 and Fig. 3). Among the EGFR mutations, the most frequent was the EGFR-L858R mutation at 55.26% (11/21), followed by the EGFR-19del mutation at 32% (6/21) (Fig. 2D).
Fig. 3
Ten lung cancer driver gene mutation states in 38 patients
Characteristics of hematologic malignanciesThe median age of diagnosis for hematologic malignancies was 64 years. The most prevalent subtype was mature B-cell lymphoma, accounting for 50.6% of cases, followed by acute myeloid leukemia (14.6%), NK/T cell lymphoma (11.2%), plasma cell neoplasms (10.1%), myelodysplastic syndromes (4.5%), and Hodgkin lymphoma (3.4%). Genetic abnormalities were assessed in 35 patients, with a detection rate of 91.4%. These abnormalities included chromosomal aberrations (63.6%), gene rearrangements (69.6%), and gene mutations (86.9%) (Table 4).
Table 4 Clinical Characteristics of Patients with Hematologic MalignanciesTreatments administered for lung cancer and hematologic malignanciesIn the cohort of 89 MPC patients, 66.3% (59/89) had undergone previous surgical intervention for lung cancer. For other patients, targeted therapy was administered in 19.1% (17/89), immunotherapy in 3.4% (3/89), chemotherapy in 5.6% (5/89), and radiotherapy in 2.2% (2/89). The treatment details for lung cancer were unknown in 3.4% (3/89) of cases.
Regarding the treatment of hematological tumors, targeted therapy accounted for 7.9% (7/89), immune-related therapy for 6.7% (6/89), and chemotherapy for 67.4% (60/89). The detailed treatment methods are provided in Supplementary Table 2.
Survival outcomesIn the cohort of 85 MPC patients analyzed for survival, the median overall survival (mOS) was 46.2 months (95% CI 21.9–70.6). The 3- and 5-year OS rates were 55.2% and 37.9%, respectively (Fig. 4A). Among the 38 patients undergoing LC molecular testing, the mOS was 52.6 months in 27 cases with positive mutations, displaying 3- and 5-year OS rates of 69.4% and 46.2%, respectively (Fig. 4B). For the 12 advanced LC patients with LC gene mutations, the mOS was 52.6 months (95% CI: 42.3–62.8), with 3- and 5-year OS rates of 91.7% and 30.6%, respectively (Fig. 4C). The median progression-free survival (mPFS) following first-line treatment of 11 advanced patients with lung cancer-associated driver gene mutations is 26.6 months (Fig. 4D).
Comparatively, MPC patients with genetic abnormalities related to HM had more favorable outcomes, evident in a 5-year overall survival rate of 72.2% compared to 19.5% in wildtype cases (P < 0.001) (Fig. 5A). Those with a history of LC surgery showed a significantly longer mOS of 69.4 months (95% CI: 5.7–133, P < 0.001) than patients without such a history (Fig. 5B). Additionally, patients with stage I-II LC had a significantly longer mOS of up to 69.4 months (95% CI: 12.1-126.6, P < 0.05) (Fig. 5C). LC patients with a PS score of 0–1 exhibited a significantly longer mOS of 52.6 months (95% CI: 32.5–72.7, P < 0.001) (Fig. 5D). Furthermore, patients diagnosed with adenocarcinoma experienced a prolonged mOS of 69.1 months (95% CI: 18.8–86.4, P < 0.05) (Fig. 5E). Among the 75 patients with metachronous MPC, those with an interval of occurrence between LC and HM within 5 years demonstrated a significantly longer mOS of 51 months (95% CI: 30.0, 72.0, P < 0.05) (Fig. 5F).
Fig. 4
Overall survival (OS) and Progression-free survival (PFS). (A) OS in 85 MPC patients. (B) OS in 27 patients with MPC carrying lung cancer-related gene mutations. (C) OS in 12 advanced patients with lung cancer-associated driver gene mutations. (D) PFS in 11 advanced patients with lung cancer-associated driver gene mutations treated with first-line therapy. A total of 12 patients with advanced lung cancer gene mutations were enrolled, one of whom with an unknown treatment regimen was excluded from PFS analysis
Fig. 5
The survival outcomes of each subgroup. (A) OS in hematologic malignancy-related genetic abnormalities. (B) OS in lung cancer surgical history. (C) OS in staging subgroups of lung cancer among multiple primary cancers. (D) OS in PS score of lung cancer. (E) OS in pathological subgroups of lung cancer. (F) OS in subgroups with different time intervals between two tumors
In the univariate analysis, several factors were significantly associated with OS, including a history of surgery for LC (HR: 0.393, 95% CI: 0.193–0.797, P < 0.05), early stage of LC (HR: 0.417, 95% CI: 0.182–0.956, P < 0.001), favorable PS score (HR: 0.110, 95% CI: 0.030–0.399, P < 0.05), a cancer interval within 5 years (HR: 0.276, 95% CI: 0.097–0.786, P < 0.05), and the presence of genetic abnormalities associated with HM (HR: 0.097, 95% CI: 0.024–0.387, P < 0.001) (Fig. 6 and Supplementary Table 3).
Fig. 6
Univariate analysis for overall survival
The subsequent multivariate Cox regression analysis revealed independent prognostic factors, including a history of surgery for LC (HR: 0.276, 95% CI: 0.083–0.918, P < 0.05), a favorable PS score (HR: 0.079, 95% CI: 0.011–0.538, P < 0.05), adenocarcinoma pathology of LC (HR: 0.211, CI: 0.049–0.916, P < 0.05), and the presence of genetic abnormalities associated with HM (HR: 0.052, 95% CI: 0.010–0.279, P < 0.001) (Fig. 7 and Supplementary Table 3).
Fig. 7
Multivariate analysis for overall survival
Durable response to RET inhibition in a patient with RET fusion-positive lung adenocarcinoma and chronic lymphocytic leukemiaIn June 2020, a 59-year-old female patient presented with chronic lymphocytic leukemia, followed by a diagnosis of lung adenocarcinoma in April 2021. Molecular profiling of the lung tumor revealed an oncogenic RET fusion. Treatment with the RET inhibitor pralsetinib commenced on June 16, 2021, with no intervention for hematological tumors. The Progress Free Survival (PFS) was 26.6 months. Administration of the RET inhibitor pralsetinib resulted in significant responses in both malignancies, achieving a partial response in the lung lesions and effective responses in hematologic tumors based on chest CT, lymph nodes, and WBC findings (Figs. 8 and 9).
Fig. 8
Chest CT scans and Treatment Timeline in the Case. (A) Baseline scan before treatment; (B) Scan after 1.6 months of treatment; (C) Scan after 4 months of treatment; (D) Scan after 7 months of treatment; (E) Scan after 14.5 months of treatment; (F) Scan after 23.5 months of treatment; (G) Timeline illustrating the course of treatment
Fig. 9
Assessment of lung cancer and lymph node characteristics during treatment of the case. (A) Changes in lung cancer tumor diameter. (B) White blood cell (WBC) count dynamics. (C) Lymph node count variation. (D) Maximal lymph node diameter changes. (E) SPD of measured lymph nodes, SPD represents the sum of the products of the perpendicular diameters of measured lymph nodes
Comments (0)