
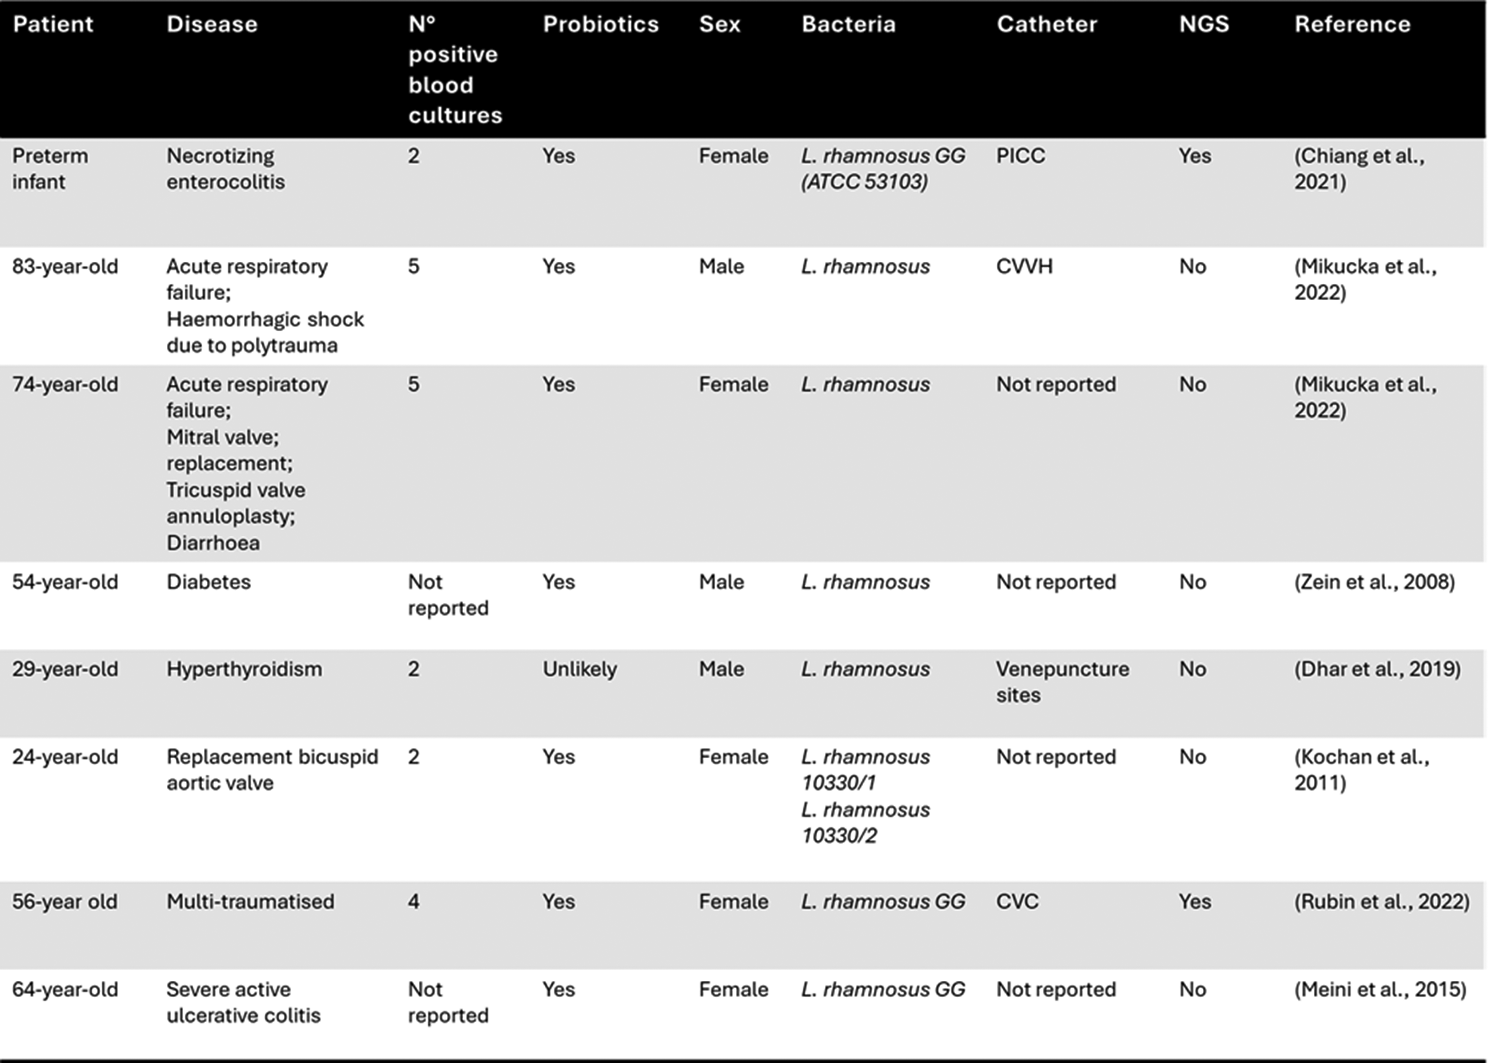
Remember me


A total of 25 subjects were included in the study, including 13 PJS patients (Group P) and 12 non-PJS controls (Group H). The characteristics of the subjects are shown in Table 1. The mean age of the 13 PJS patients (P group) was 26.08 ± 8.45 years, including 6 females (46.15%). The control group (Group H) included 12 patients, with an average age of 31.83 ± 8.21 years old, of whom 4 were female (33.33%). Detailed information on the subjects in this study is shown in Table 1. No statistically significant differences in age, sex or body mass index (BMI) were observed between the groups (P > 0.05).
Table 1 The clinical data of patients with Peutz–Jeghers syndrome (PJS) and controlsAnalysis of mucosa-associated bacterial compositionAs shown in Fig. 1, the Rarefaction curve gradually flattened with increasing sequencing volume, indicating that the sample was sufficient, and the result could represent the small intestinal mucosa microbiome. The alpha diversity was estimated through different indices. The Shannon Diversity Index (sometimes called the Shannon–Wiener Index) is a way to measure the diversity of species in a community. The higher the value, the higher the diversity of species in a particular community. Simpson’s Diversity Index is another way to measure the diversity of species in a community. The value for Simpson’s Diversity Index ranges between 0 and 1. The higher the value, the lower the diversity, and the Coverage index is usually used to observe the Good’s coverage at the OTU level. As shown in Fig. 1, the microbial community diversity of Group P was lower than that of Group H. However, Shannon (Student’s test, P = 0.05137), Simpson (Student’s test, P = 0.06055) and other index analyses did not reach statistical significance. The rank-abundance curve is another way of analyzing diversity, explaining it in two ways: the abundance of the population and the evenness of the community. The steeper decline curve of Group P compared with Group H indicates a higher proportion of dominant bacteria in the samples of Group P and lower species diversity (Additional file 1: Fig. S1).
Fig. 1
Alpha diversity of the mucosa-associated bacteria in different groups at the OTU level. Rarefaction curve indicated that the sample was sufficient. The Simpson index is higher in Group P than Group H. However, Shannon (Student’s test, P = 0.05137), Simpson (Student’s test, P = 0.06055), Coverage (Student’s test, P = 0.4943) and other index analyses did not reach statistical significance. (P: PJS patient group; H: healthy control group)
Analysis of Venn diagramA total of 897,725 high-quality sequences were detected from the 25 samples. The intestinal microbiota in all samples were classified into 13 phyla, 24 classes, 48 orders, 80 families, 123 genera, 142 species, and 164 OTUs. To analyze the overlap of intestinal mucosal-associated microbiota composition between PJS patients and controls, a Venn diagram is shown in Fig. 2. The number of OTUs in Group P was 90, the number of OTUs in Group H was 111, and the common number of OTUs in the two groups was 38. There were 52 unique OTUs in Group P and 73 unique OTUs in Group H.
Fig. 2
Venn diagram. In the Venn diagram, rare microbial OTUs were removed without subsampling. There was much overlap in the OTUs of each group. Group P: Peutz‒Jeghers syndrome (PJS) patients; Group H: non-PJS controls
Differences in bacterial abundance between groupsProteobacteria, Firmicutes, Bacteroidetes and Actinobacteriota constituted the four main phyla of mucosal bacteria (Fig. 3A). The proportion of Proteobacteria in Group P (93.86%) was significantly higher than that in Group H (69.20%), while the proportions of Firmicutes, Bacteroidetes and Actinobacteria were significantly reduced in Group P compared to Group H. As shown in Fig. 3B, at the genus level, Escherichia-Shigella (40.24%) and Klebsiella (16.80) accounted for the highest proportion in Group P, and the abundance of Klebsiella (16.80%), Achromobacter (10.47%) and Streptococcus (11.07%) in Group P was significantly higher than that of Klebsiella (5.0%), Achromobacter (2.88%) and Streptococcus (1.22%) in Group H, while the abundance of other genera was decreased.
Fig. 3
Community bar plot analysis of bacteria at the phylum and genus levels. The vertical coordinate in the figure represents the proportion of species in the samples of each group, and the species are represented by different colors in the figure (H: healthy control group; P: PJS patient group)
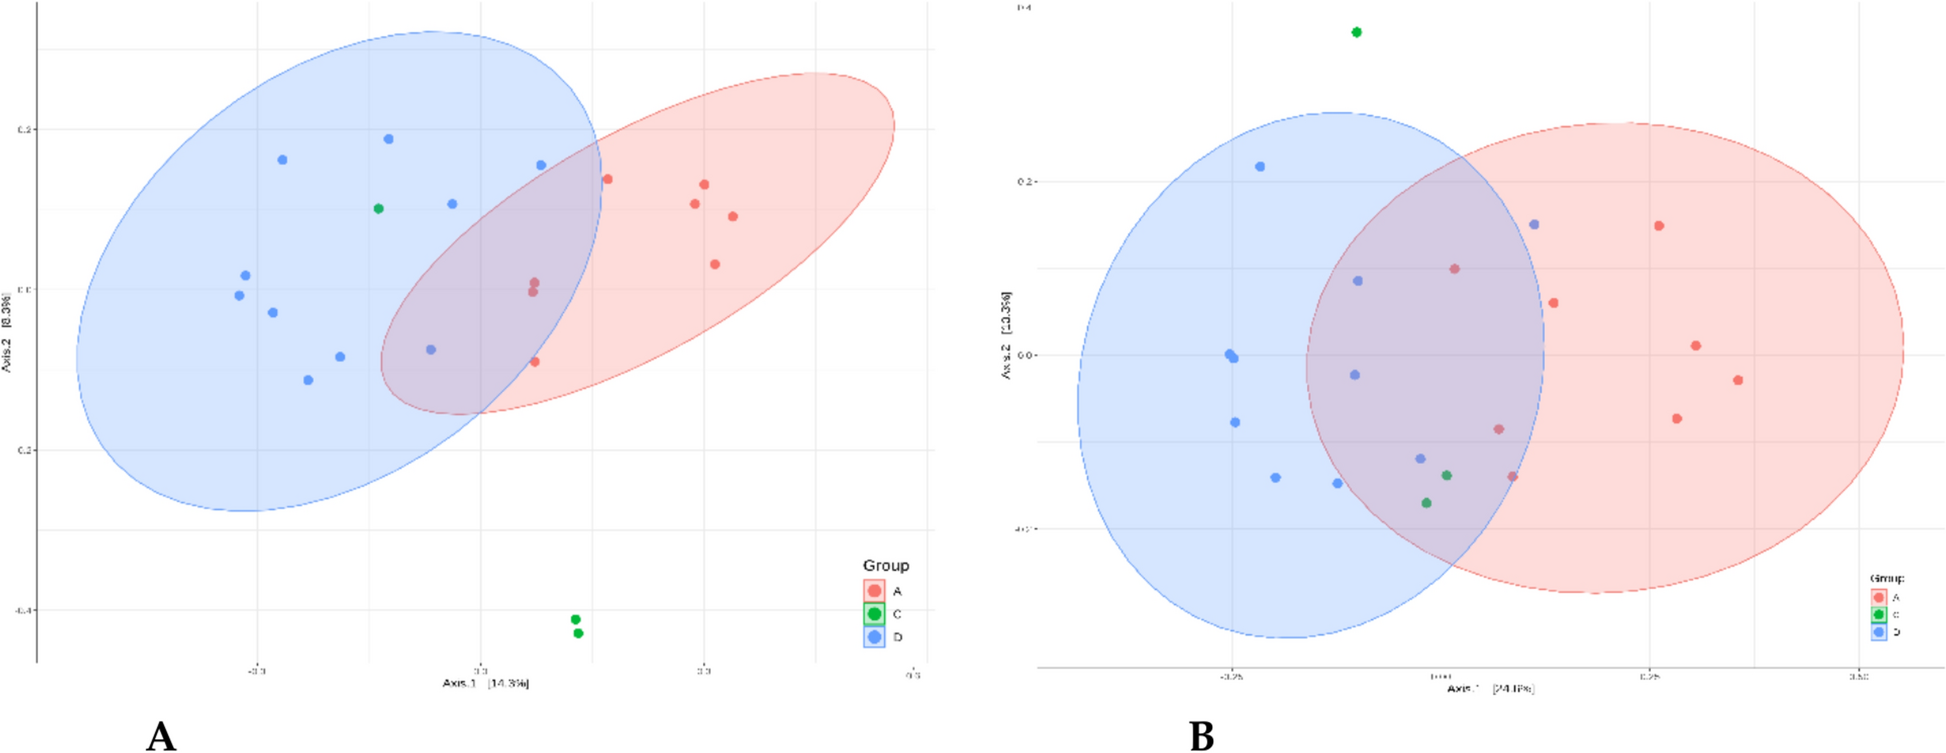
Comparative analysis of different species between groupsPCoA was used to analyze beta diversity in the community composition of the two groups. Figure 4 shows that the difference between Group H and Group P at the class OTU was less significant than the difference within the groups (P = 0.4610). Based on the Bray–Curtis distance clustering analysis, no obvious intergroup clustering was found. There was no obvious evolutionary classification relationship between samples, the samples of patients and controls were mixed, and the overlap of the 95% confidence ellipse was obvious. The samples within Group P were more discrete, suggesting that the mucosal bacterial community heterogeneity of PJS patients was more obvious than that of healthy people. Hierarchical clustering analysis was carried out based on the beta diversity distance matrix, and the clustering tree was constructed by UPGMA (Unweighted Pair-group Method with Arithmetic Mean) algorithm. The degree of similarity or difference in bacterial community composition was visualized. The UPGMA clustering tree in class level was generated in Fig. 4C, which showed that 5 clusters in 2 groups, indicating that the bacterial community composition was significantly different and clustered dividedly.
Fig. 4
Beta diversity of mucosa-associated bacteria. A The group ellipses of the 95% confidence interval overlapped significantly, which could not effectively distinguish the difference between groups (P = 0.4610), and the samples in the corresponding group of PJS patients were more discrete. B Based on OTU level analysis, the difference between groups was smaller than the difference within groups. C Bar graph of microflora relative abundance and hierarchical clustering of evolutionary relationships at the class level, revealing 5 clusters in the community branches of the two groups; (H: healthy control group, P: PJS patient group)
Differences in species abundance between groupsAt the family level, the relative abundances of Oscillospiraceae, Eggerthellaceae, Sutterellaceae and Butyricicoccaceae in controls were significantly higher than those in PJS patients. In the intestinal mucosal microbiota of PJS patients, the relative abundance of Xanthobacteraceae was significantly higher than that of controls. At the species level, the relative abundances of unclassified_g_Bacteroides, unclassified_f_Lachnospiraceae, Erysipelatoclostridium_ramosum, unclassified_g. _Romboutsia, metagenome_g_Blautia and other strains in controls were significantly higher than those in PJS patients (the results are shown in Additional file 2: Fig. S2).
Potential biomarkers in patients with PJSPotential biomarkers were screened by LEfSe. As shown in Fig. 5, the taxa that have the main influence on the species difference between the two groups at various levels. In Group H, the significantly enriched phyla included Firmicutes and Bacteroidota. At the class level, Clostridia and Bacteroidia significantly enriched. At the order level, Bacteroidales, Lachnospirales, Peptostreptococcales-Tissierellales, Erysipelotrichales significantly enriched. On the family level, Bacteroidaceae, Lachnospiraceae and Peptostreptococcaceae significantly enriched. At the genus level, significantly enriched genus included Blautia, Lachnoclostridium, Romboutsia, Bacteroides, etc. The key distinguishing units in the mucosal microbiota of Group P were Negativicutes (class), Veillonellales-Selenomonadales (order), and Veillonellaceae (family level).
Fig. 5
Linear discriminant analysis of effect sizes (LEfSe) bar plot. The yellow dots in A represent species with no significant difference between the two groups, and the diameter is proportional to the LDA; the length of the bar in B is the influence of the different species; red represents the healthy control group, and blue represents the PJS patient group (LDA = 2.0)
Data standardization and Partial least squares-discriminant analysis (PLS-DA)PLS-DA analysis is shown in Fig. 6. The horizontal coordinate is the permutation retention degree, in the same order as the original Model Y variable. Points with permutation retention degree 1 are the values of R2 and Q2 of the original model, and the vertical coordinate is the values of the permutation test of R2 and Q2. The intercept of the Q2 regression line and Y axis was the evaluation standard of the displacement test, and an intercept < 0 indicated that the research model was reliable and that there was no overfitting phenomenon. The distribution of RSD is shown in Additional file 3: Fig. S3.
Fig. 6
PLS-DA plot. A The separation between the two groups is obvious, the distance within the samples is close, and the classification effect is significant. B The two dotted lines represent regression lines of R2 and Q2. R2 is (0, 0.8842) and Q2 is (0, − 0.4197). The intercept between the regression line of Q2 and the Y-axis is less than 0, which means that the research model is robust
Differentially abundant metabolite analysisDifferentially abundant metabolites were screened, and visual analysis was carried out through the differential volcano map (the result is shown in Additional file 4: Fig. S4). The dots in the figure represent a metabolite, the red dots represent metabolites with upregulated expression, the blue dots represent metabolites with downregulated expression, and the closer to the left and right sides and the upper points, the more significant the differential expression, while the gray dots represent products with no significant differences in metabolism. In this analysis, the number of cationic peaks meeting all screening conditions was 1590, among which the number of differentially abundant metabolites with identified names was 532, while the number of anion peaks meeting the differential screening conditions was 1871, and the number of differentially abundant metabolites with identified names was 405.
The analysis of variables important in the projectionFigure 7 shows the heatmaps and variable importance in projection (VIP) of metabolite clustering. Metabolites significantly upregulated in Group P included deoxycholine serine, 6-ketoprostaglandin F1a, 4-ethylamino-6-isopropyl amino-1,3,5-triazine-2-ol, ozone, S-adenosine homocysteine, Altanserin, isocitric acid, Val-Gly-Val-Ala-Pro-Gly, 7,8-dehydrotaurine, spectinomycin, 2-cyanopyrimidine, and soybean saponin. Significantly downregulated metabolites included nitroparacetamol, 4a-hydroxy-tetrahydrobiotrexate, codeinone, 5Z-7-oxazolenol, 12-oxo-20-trihydroxyleukotriene B4, maphioside C, isoamylglutamate, hexylagarose, traumatic acid, and dexamethasone palmitate.
Fig. 7
Metabolite clustering tree and VIP bar plot. Each column represents a sample, and each row represents a metabolite. The denser the branch of the metabolite clustering tree, the more similar the expression patterns of all metabolites in the sample. In the histogram of VIP metabolites, the length of the blue bar indicates the contribution of metabolites to the difference between the two groups, the color of the VIP bar indicates the significance of the difference between the two groups of metabolites, and the lower the P value is, the darker the color (*P < 0.05, **P < 0.01, ***P < 0.001)
KEGG metabolic functional pathwayThe KEGG metabolic function pathway can be divided into seven major pathways: metabolism, genetic information processing, environmental information processing, cellular processes, organismal systems, human diseases, and drug development. As shown in Fig. 8, the primary classification of major metabolic pathways in mucosa mainly includes metabolism, organismal systems, human diseases, environmental information processing and cellular processes. Regarding secondary metabolites, metabolites in biosynthetic pathways, including lipid metabolism, amino acid metabolism, carbohydrate metabolism, nucleotide metabolism, nervous system, cofactor and vitamin metabolism and other secondary metabolites, were significantly upregulated.
Fig. 8
Bar chart of KEGG functional pathway metabolism. The vertical coordinate is the secondary KEGG metabolic pathway, and the horizontal coordinate is the number of metabolites annotated to this pathway. Colors such as blue, red, yellow, green and purple represent the primary classification of the 5 major metabolic functional pathways in this study. They are metabolism, organismal systems, human diseases, environmental information processing and cellular processes
Enrichment analysis of KEGG pathwaysAs shown in Fig. 9, 10 metabolic pathways showed lower P values and higher pathway enrichment rates between Groups P and H, including glycosylphosphatidylinositol (GPI)-anchored protein biosynthesis, asthma, pyrimidine metabolism, taste transduction, 5-hydroxytryptamergic synapse, linoleic acid, α-linolenic acid metabolism, purine metabolism, arachidonic acid metabolism, and glycerophospholipid metabolism, suggesting that these metabolic pathways may play a special role in the clinical manifestations of PJS patients.
Fig. 9
KEGG pathway enrichment analysis. The P value is represented by the change in the color gradient on the right, the horizontal coordinate is the metabolic pathway name, and the vertical coordinate is the enrichment ratio (*P < 0.05, **P < 0.01, ***P < 0.001)
Comments (0)