
Remember me


MANY CLINICAL nutrition guidelines focus on the importance of early initiation of enteral nutrition (EN) during critical illness (within the first 48 hours after intensive care unit [ICU] admission) in the absence of any contraindication to reduce mortality and the risk of malnutrition.1,2 Early EN initiation during hospitalization is associated with several benefits for clinical outcomes in critically ill patients.2,3
In contrast, malnutrition acquired in a hospital environment, particularly in an ICU, can affect approximately 1 in every 3 inpatients and is an independent risk factor for increased inhospital mortality, length of stay, and costs.4 Several circumstances can lead to malnutrition, including that ICU patients may receive less enteral energy and protein than the prescribed dose (approximately 15%-90%) of goal.5-7
Implementation of clinical nutrition guidelines in the ICU is affected by numerous barriers, which may restrict or limit the provision of adequate nutrition support to critically ill patients.8 Tools that identify the individual ICU barriers to EN delivery may facilitate the creation of EN protocols adapted to the unique features and characteristics of each institution.9
The Barriers to Enterally Feeding Critically Ill Patients survey (BEFIP) has been used to identify barriers to adequate EN support for critically ill patients. This questionnaire was developed by Cahill et al10,11 with the aim of exploring the barriers perceived by health care professionals (HCPs) in ICUs. In 2016, this questionnaire was revised, and the latest version made it possible to analyze the magnitude and severity of 20 potential barriers.12 In addition to its original version, the BEFIP has been successfully translated and validated for populations with other linguistic cultures when applied only to nurses.13,14 To date, there is no validated instrument for characterizing potential barriers to EN administration in critically ill patients in Portugal.
The main aim of this study was to validate the Portuguese version of the BEFIP and characterize the perceptions of HCPs (physicians, nurses, and nutritionists) regarding barriers to the administration of EN to critically ill patients.
METHODS Study designThis was a cross-sectional observational study in which the BEFIP was translated into Portuguese and, after a pretest, applied through an online platform to the final sample.
Study populationThe pretest was applied to 5 physicians and 5 nurses, which corresponds to the minimum number recommended by Wild et al,15 and only 3 nutritionists, given that the number of these professionals working in ICUs nationwide is small. The pretest inclusion criteria were as follows: (1) a physician, nurse, or nutritionist working in an ICU; (2) willingness to answer the questionnaire; (3) able to read Portuguese; and (4) a resident of Portuguese mainland or islands.
The final sample included physicians, nurses, and nutritionists working in Portuguese hospital ICUs. The criteria for inclusion in the final sample were the same as those for the pretest; however, the participants could not have previously participated in the pretest. The ICUs of 7 public sector hospitals from various health regions of the Portuguese mainland (4 from Lisbon and Tagus Valley, 1 from the Centre, and 1 from the North) and islands (1 from Terceira Island, Azores) agreed to collaborate among the 25 hospitals contacted.
Adjustment procedures of the Portuguese version of the BEFIP (BEFIP-PT)First, the revised version of the BEFIP was translated and adapted from its original language (English) to Portuguese by the principal investigator.16 It was linguistically verified by a second investigator, and the necessary semantic and grammatical adjustments were made.
The pretest, which consisted of the face-to-face administration of a mini survey to HCPs to assess their understanding of the translated version of the BEFIP-PT, was conducted between November and December 2020. The pretest assessed the acceptability, clarity, and comprehensibility of the questions, and the need to edit the survey.
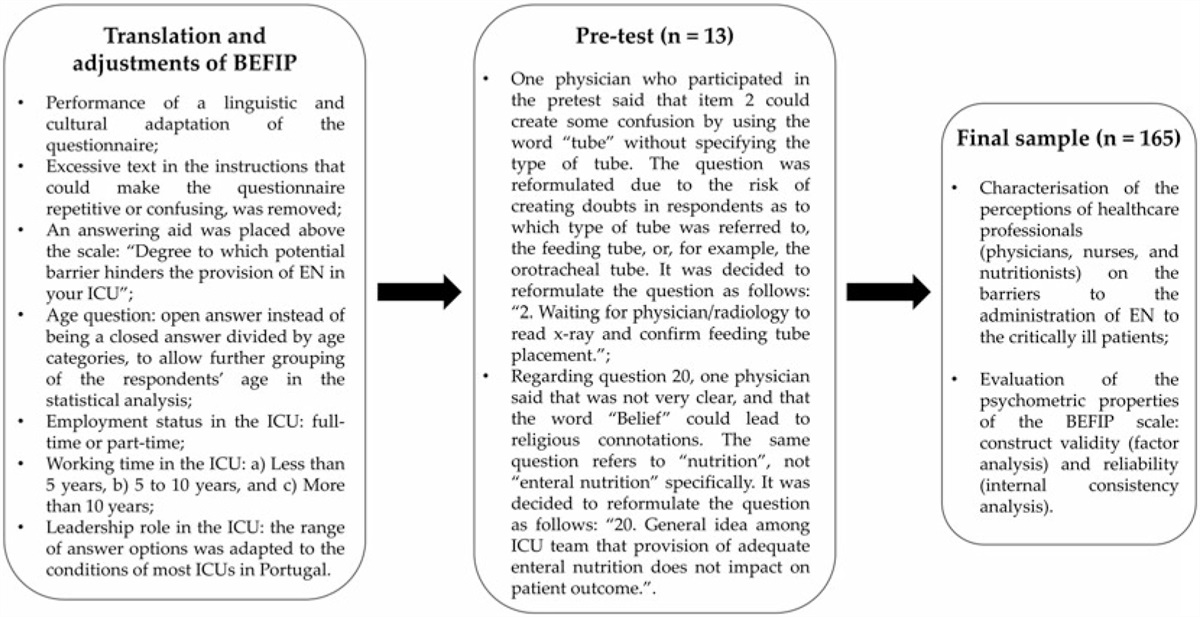
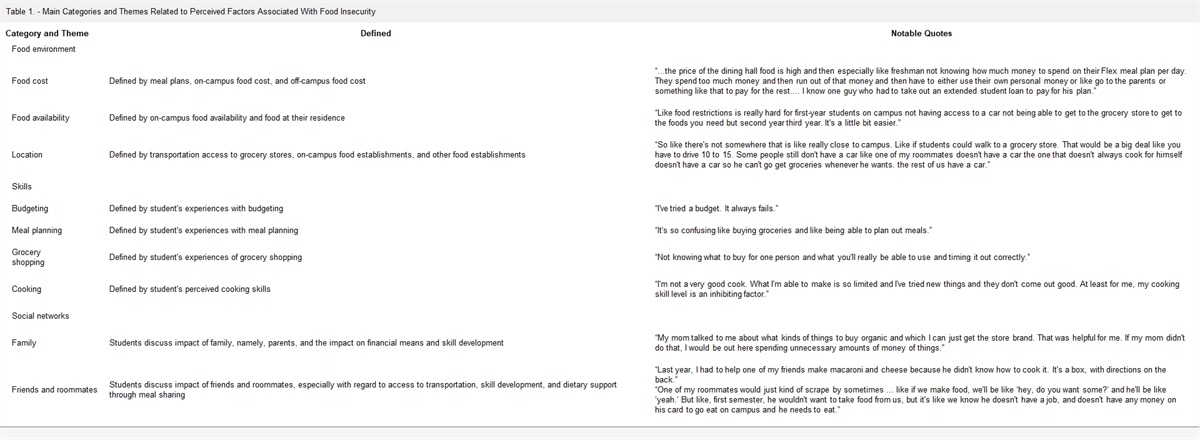
After the translation and application of the pretest, some questions were adjusted to obtain a more harmonious and culturally adapted version of the BEFIP-PT (Figure).
 Figure.:
 Workflow and adjustments made after the translation and pretest of the BEFIP. BEFIP indicates Barriers to Enterally Feeding Critically Ill Patients survey; EN, enteral nutrition; ICU, intensive care unit.
The Portuguese BEFIP version (BEFIP-PT) was provided through a link that directed the respondents to an anonymous questionnaire using the online survey platform LimeSurvey.org (LimeSurvey, Hamburg, Germany), which hosted the data in Great Britain.17 The link was sent through professional or personal emails of physicians, nurses, and nutritionists in each ICU by medical directors and/or head nurses in each unit between January and May 2021. A bimonthly email reminder was also sent requesting the participation of HCPs who had not yet responded to the questionnaire.
Assessment of the HCPs’ perceptions about barriers to ENThe original BEFIP analyzed 20 potential barriers across 4 domains: (1) delivery of EN to the patient, (2) nutritionist support, (3) ICU resources, and (4) critical care provider attitudes and behaviors.12 For each potential barrier, the respondent responded on a Likert-type scale with 7 response options, ranging from 0 for “Not at all” (the respondent does not perceive the item as a barrier) to 6 for “An extreme amount” (the respondent considers that the barrier severely affects the provision of EN in their ICU). As proposed by the authors of the BEFIP, to calculate each item's score, the value 0 is assigned to the ordinal scale from 0 to 3, and the values 1, 2, and 3 are assigned to answers on the ordinal scale of 4, 5, and 6, respectively. The sum of these values was then divided by 3 (the maximum possible value for each item) and multiplied by 100. After this conversion, the score for each domain can be calculated by averaging all items in the respective domain as well as the average of all items in the scale.11,12
Sociodemographic characteristicsSociodemographic information was also collected (gender identity, age, profession, employment status, working time, and leadership role in the ICU).12 The questionnaire also contained a section dedicated to additional comments regarding barriers that were not included in the questionnaire and/or possible improvements. This section was optional.
Ethical proceduresThe validation of the BEFIP-PT was authorized by the authors of the original version via email. The study protocol was submitted to and approved by the Ethics Committee of Egas Moniz (process number: 901) and the respective ethics committees for the health of public hospitals that agreed to collaborate.
Informed consent was incorporated into the online questionnaire and its completion could not be initiated without the consent of the respondents or the institution to which they belonged. The anonymity of the respondents was safeguarded by encryption and their IP address was not collected by the online platform.
Statistical analysisAll data obtained were analyzed using IBM SPSS Statistics for Macintosh, Version 27.0 (IBM Corp, Armonk, New York). Sociodemographic data and questionnaire items were analyzed using descriptive statistics. Given the ordinal nature and nonnormal distribution (verified by the Kolmogorov-Smirnov test) of the variables under study, the Kruskal-Wallis test was used to compare the perceptions of barriers between the 3 professional groups. Multiple comparisons between groups that had a statistically significant (P < .05) Kruskal-Wallis test result were performed using Fisher least significant difference test.18
Construct validity was assessed using factor analysis (FA) based on the principal component extraction method with varimax (orthogonal) rotation in a correlation matrix.19 Howard20 proposed that to perform an FA, the sample size should be at least 5 times greater than the number of items in the scale. The BEFIP scale has 20 items which, multiplied by 5, shows that data from at least 100 cases are needed to satisfy this condition.20 The final sample comprised 165 patients. Before interpreting the FA, 2 assumptions were verified: Bartlett's sphericity test (P < .05) and the Kaiser-Meyer-Olkin measure of sampling adequacy (KMO).21 An eigenvalue greater than 1 rule was used to determine the retention of factors that extracted at least 5% of the total variance.22 For the cumulative extracted variance after rotation, the minimum criterion of 50% to 60% proposed by Marôco23 was used. According to the guidelines of Matos and Rodrigues,24 minimum commonalities of 0.5 are considered acceptable for a sample of 100 to 200 individuals. Factor loadings greater than 0.5 were accepted to retain the item in a single factor, also considering its framework and conceptual coherence.11,25
Internal reliability was evaluated using Cronbach α coefficient (CAC) for each domain and total scale. Hill and Hill26 suggested that CAC should have a minimum of 0.7. If each item was eliminated, the item-total correlation matrix and CAC values were analyzed to assess the relevance of each item to the total scale. The item-total correlation was considered acceptable if the correlation coefficient was greater than 0.3.27,28
RESULTS Composition and sociodemographic characteristics of the sampleOf the 522 HCPs contacted, 32% (n = 165) responses were obtained. Of the 165 HCPs who responded, 12 (7.3%) were nutritionists, 35 (21.2%) were physicians, and 118 (71.5%) were nurses. On average, the participants took 8 minutes and 6 seconds to complete the questionnaire.
Regarding the sociodemographic characteristics of the sample, there was a higher prevalence of female HCPs (70.9%), those between 31 and 40 years of age (50.3%), nurses (71.5%), those who worked full-time in the ICU (90.9%), and those who had worked for less than 5 years (46.7%). Most HCPs (91.5 %) did not hold leadership positions in the ICU. Those who maintained managerial positions were mainly head nurses (35.7%), charge nurses (28.6%), and medical directors (28.6%) (Table 1).
Table 1. - Sociodemographic Characteristics of the Final Sample Characteristic % n Gender identity Male 29.1 48 Female 70.9 117 Total 100 165 Age, y ≤30 18.2 30 31-40 50.3 83 >40 31.5 52 Total 100 165 Health care profession Nutritionist 7.3 12 Physician 21.2 35 Nurse 71.5 118 Total 100 165 Employment status in the ICU Full-time 90.9 150 Part-time 9.1 15 Total 100 165 Working time in the ICU, y <5 46.7 77 5-10 22.4 37 >10 30.9 51 Total 100 165 Leadership role in the ICU No 91.5 151 Yes 8.5 14 Total 100 165 Type of leadership role in the ICU Medical director 28.6 4 Responsible physician 0 0 Head nurse 35.7 5 Charge nurse 28.6 4 Other 7.1 1 Total 100 14Abbreviation: ICU, intensive care unit.
In the domain “Delivery of Enteral Nutrition to the Patient,” items 1 (Physician order delay), 4 (Delayed motility agents), 5 (Delayed small bowel access), 6 (EN not a priority), and 7 (EN not discussed on rounds) were most frequently identified as barriers by the respondents. This trend was most notable for items 4 (median = 4.0) and 5 (median = 4.0). Items 2 (radiograph wait) (median = 1.0) and 3 (Feeding tube displacement) (median = 2.0) had little effect on EN administration (Table 2). Items 2 and 3 were less frequently reported by most professionals, with the exception of physicians (item 2: 13.3 ± 28.7; item 3: 17.2 ± 31.1) (Table 3).
Table 2. - Descriptive Statistics of BEFIP Response Scale Response Frequency (%) Domain/Item Median IQR Mode Not at All Very Little A Little A Moderate Amount A Lot A Great Deal An Extreme Amount Total Delivery of enteral nutrition to the patient 1. Delay in physicians ordering the initiation of EN. 3.0 2.5 4.0 9.7 12.1 15.2 18.2 20.0 13.3 11.5 100 2. Waiting for physician/radiology to read radiograph and confirm feeding tube placement. 1.0 3.0 0 41.8 18.2 13.3 6.1 6.7 8.5 5.5 100 3. Frequent displacement of feeding tube, requiring reinsertion. 2.0 3.0 1.0 14.5 33.9 12.1 12.7 7.9 12.7 6.1 100 4. Delays in initiating motility agents in patients not tolerating enteral nutrition (ie, high residual gastric volumes). 4.0 2.0 5.0 4.8 6.1 12.7 17.0 21.2 22.4 15.8 100 5. Delays and difficulties in obtaining small bowel access in patients not tolerating enteral nutrition (ie, high-residual gastric volumes). 4.0 2.0 4.0 1.1 3.0 3.0 24.2 26.1 24.8 17.6 100 6. In resuscitated, hemodynamically stable patients, other aspects of patient care still take priority over nutrition. 3.0 2.0 4.0 10.3 10.3 18.8 21.2 24.8 10.9 3.6 100 7. Nutritional therapy not routinely discussed on patient care rounds. 3.0 3.0 5.0 11.5 9.1 16.4 18.8 17.6 19.4 7.3 100 Nutritionist support 8. Waiting for the nutritionist to assess the patient. 2.0 4.0 0 26.1 13.3 11.5 17.6 8.5 7.9 15.2 100 9. Nutritionist not routinely present on weekday patient rounds. 3.0 4.0 0 20.0 5.5 9.7 18.8 14.5 13.3 18.2 100 10. No or not enough nutritionist coverage during evenings, weekends, and holidays. 3.0 4.0 0 18.2 7.9 13.9 15.8 17.6 10.3 16.4 100 11. Not enough time dedicated to education and training on how optimally to feed patients. 4.0 2.0 3.0 4.2 4.2 7.9 22.4 21.8 21.8 17.6 100 ICU resources 12. Enteral formula not available on the unit. 3.0 4.0 0 21.2 10.9 17.0 9.1 14.5 13.9 13.3 100 13. No or not enough feeding pumps on the unit. 1.0 5.0 0 40.6 9.7 6.7 7.3 10.3 12.7 12.7 100 Critical care provider attitudes and behavior 14. Non-ICU physicians (ie, surgeons, gastroenterologists) requesting that patients not be fed enterally. 3.0 2.0 4.0 11.5 12.1 16.4 17.6 23.6 10.9 7.9 100 15. Nurses failing to progress feeds as per the feeding protocol. 3.0 3.0 0 22.4 15.2 9.7 13.3 15.2 16.4 7.9 100 16. Feeds being withheld due to diarrhea. 3.0 3.0 3.0 9.1 7.3 11.5 23.6 21.2 18.2 9.1 100 17. Fear of adverse events due to aggressive feeding of patients. 2.0 3.0 2.0 15.2 13.3 24.8 18.2 17.6 9.1 1.8 100 18. Feeding being withheld too far in advance of procedures or operating room visits. 3.0 2.0 3.0 8.5 14.5 18.8 24.8 18.8 8.5 6.1 100 19. Lack of familiarity with current guidelines for nutrition in the ICU. 3.0 3.0 3.0 13.9 9.7 13.3 20.6 17.0 14.5 10.9 100 20. General idea among ICU team that provision of adequate enteral nutrition does not impact on patient outcome. 3.0 4.0 0 21.8 11.5 10.9 13.3 12.7 14.5 15.2 100Abbreviations: EN, enteral nutrition; ICU, intensive care unit; IQR, interquartile range.
Abbreviation: IQR, interquartile range.
aResults from the Kruskal-Wallis's test were statistically significant, with a P value of less than .05 and a confidence interval of 95%. Results from LSD Fisher tests on differences between professional groups: item 4, nutritionists versus physicians (P = .676); nutritionists versus nurses (P = .006); and physicians versus nurses (P < .001). item 8, nutritionists versus physicians (P = .901); nutritionists versus nurses (P = .037); and physicians versus nurses (P = .002).
In contrast, item 4 (Delayed motility agents) had a high mean score (37.8 ± 37.3). According to the analysis of multiple comparisons between professional groups, item 4 presented a significant difference (P = .006) between nurses (median = 4.0), nutritionists (median = 3.0), and nurses and physicians (median = 3.0; P < .001) (Table 3). Nurses tended to perceive that item more frequently as a barrier. These professional groups may have a better perception of this barrier, as they need to wait for the prescription of motility agents by the physician to carry out this change in therapy and administer to patients. Item 5 (Delayed small bowel access) also tended to be considered as a barrier and had a high mean score (42.8 ± 36.4) but without distinction between professional groups (P = .089) (Table 3).
Regarding item 6 (EN not a priority), there was dissonance in the answers given by HCPs. Half considered the item as less (39.4%; n = 65) and the other half as more than “A moderate amount” (39.3%; n = 65) (Table 2). They tended to respond to the intermediate category of the BEFIP Likert-type scale (median = 3.0), except for nutritionists, who were most likely to consider this item a barrier with little impact on EN administration (median = 2.0; P = .401) (Table 3).
Nutritionist supportIn the domain “Nutritionist Support,” item 11 (Not enough time dedicated to EN education) tended to be identified by respondents as a barrier with the greatest impact on EN administration (median = 4.0). Items 9 (Nutritionist is not present on rounds) and 10 (No or not enough nutritionist coverage) were categorized as having less impact on EN administration, and item 8 (Wait for the nutritionist) was even less (median = 2.0) than the other items (9, 10, and 11) in this domain (Table 2).
According to multiple comparisons between professional groups, item 8 (Wait for the nutritionist) presented a significantly different distribution (P = .037) between nurses (median = 3.0) and nutritionists, nurses, and physicians (P = .002). Nurses tended to perceive this barrier more frequently, whereas physicians (median = 1.0) and nutritionists (median = 1.0) considered item 8 (Wait for the nutritionist) to have little impact on the administration of EN in their ICU (Table 3). Physicians may find that waiting for a nutritionist to assess the patient has little impact on EN administration because there may be no nutritionist fully or partially allocated to the ICU, as mentioned by a physician in the additional comments section of the questionnaire. Alternatively, as mentioned by a nutritionist in the additional comments, some medical teams may still be reluctant to assign responsibility to the nutritionist for providing EN support.
Item 11 (Not enough time dedicated to EN education) had a high mean score (39.3 ± 37.8), tending to be categorized as “A lot” of a harmful barrier (median = 4.0), essentially by physicians and nurses (Table 3). This is an aspect mentioned in the statements of some physicians (1), nurses (2), and nutritionists (2) as an extremely relevant point, as the continuous training of members of the multidisciplinary team on matters of nutrition, specifically EN, is not regularly provided. This is an extremely relevant barrier and a gap reported by professionals and identified as a need.
ICU resourcesItems 12 (Enteral formula not available) and 13 (No or not enough feeding pumps) of the “ICU Resources” domain were considered more frequently by HCPs as “Not at all” harmful (Table 4). Item 13 (No or not enough feeding pumps) tended to have a lower median value (median = 1.0), reflecting a reduced effect of EN administration (Table 2). However, regarding item 12 (Enteral formula not available), analysis revealed differences between the professional groups because nurses (median = 3.0) perceived this barrier more frequently than physicians (median = 2.0) and nutritionists (median = 1.5) (P = .125) (Table 3) since nurses might have closer contact with the stock management of EN products and more likely to deal with possible failures in the supply system.
Table 4. - Results From Factor Analysis (N = 165) Domain/Item Factor 1 Factor 2 Factor 3 Factor 4 h 2a Delivery of enteral nutrition to the patient 1 0.496 0.614 0.171 −0.084 0.659 2 0.138 0.804 0.019 0.073 0.671 3 0.009 0.668
Comments (0)