
Remember me


Among the cohort of 51 pediatric patients diagnosed with EBV-HLH, 17.6% (9/51) patients were confirmed to have EBV-positive lymphoma following PET-CT imaging and subsequent pathology biopsy. The study group compromised 19 male patients (37.3%) and 32 female patients (62.7%), with a median age of 44 months (IQR: 25.5–85). The primary clinical manifestations observed in these patients with EBV-HLH included fever (100%), lymphadenopathy (51.0%), hepatosplenomegaly (90.2%), and multi-cavity effusion (45.1%)(Table 1).
Table 1 Descriptive baseline characteristics of patients (n = 51)The patients were divided into two groups based on their different backgrounds (EBV-HLH(n = 42), EBV-positive lymphoma-HLH(n = 9)). The PBMC and plasma EBV-DNA loads at the onset were compared among the two groups. The EBV-positive lymphoma-HLH group exhibited a significant higher plasma EBV-DNA load(1.10 × 10⁶ copies/ml) compared to the EBV-HLH group(1.98 × 10⁴ copies/ml) (P = 0.006), The difference in PBMC EBV-DNA load between the two groups was not statistically significant (P = 0.739)(Table 2).
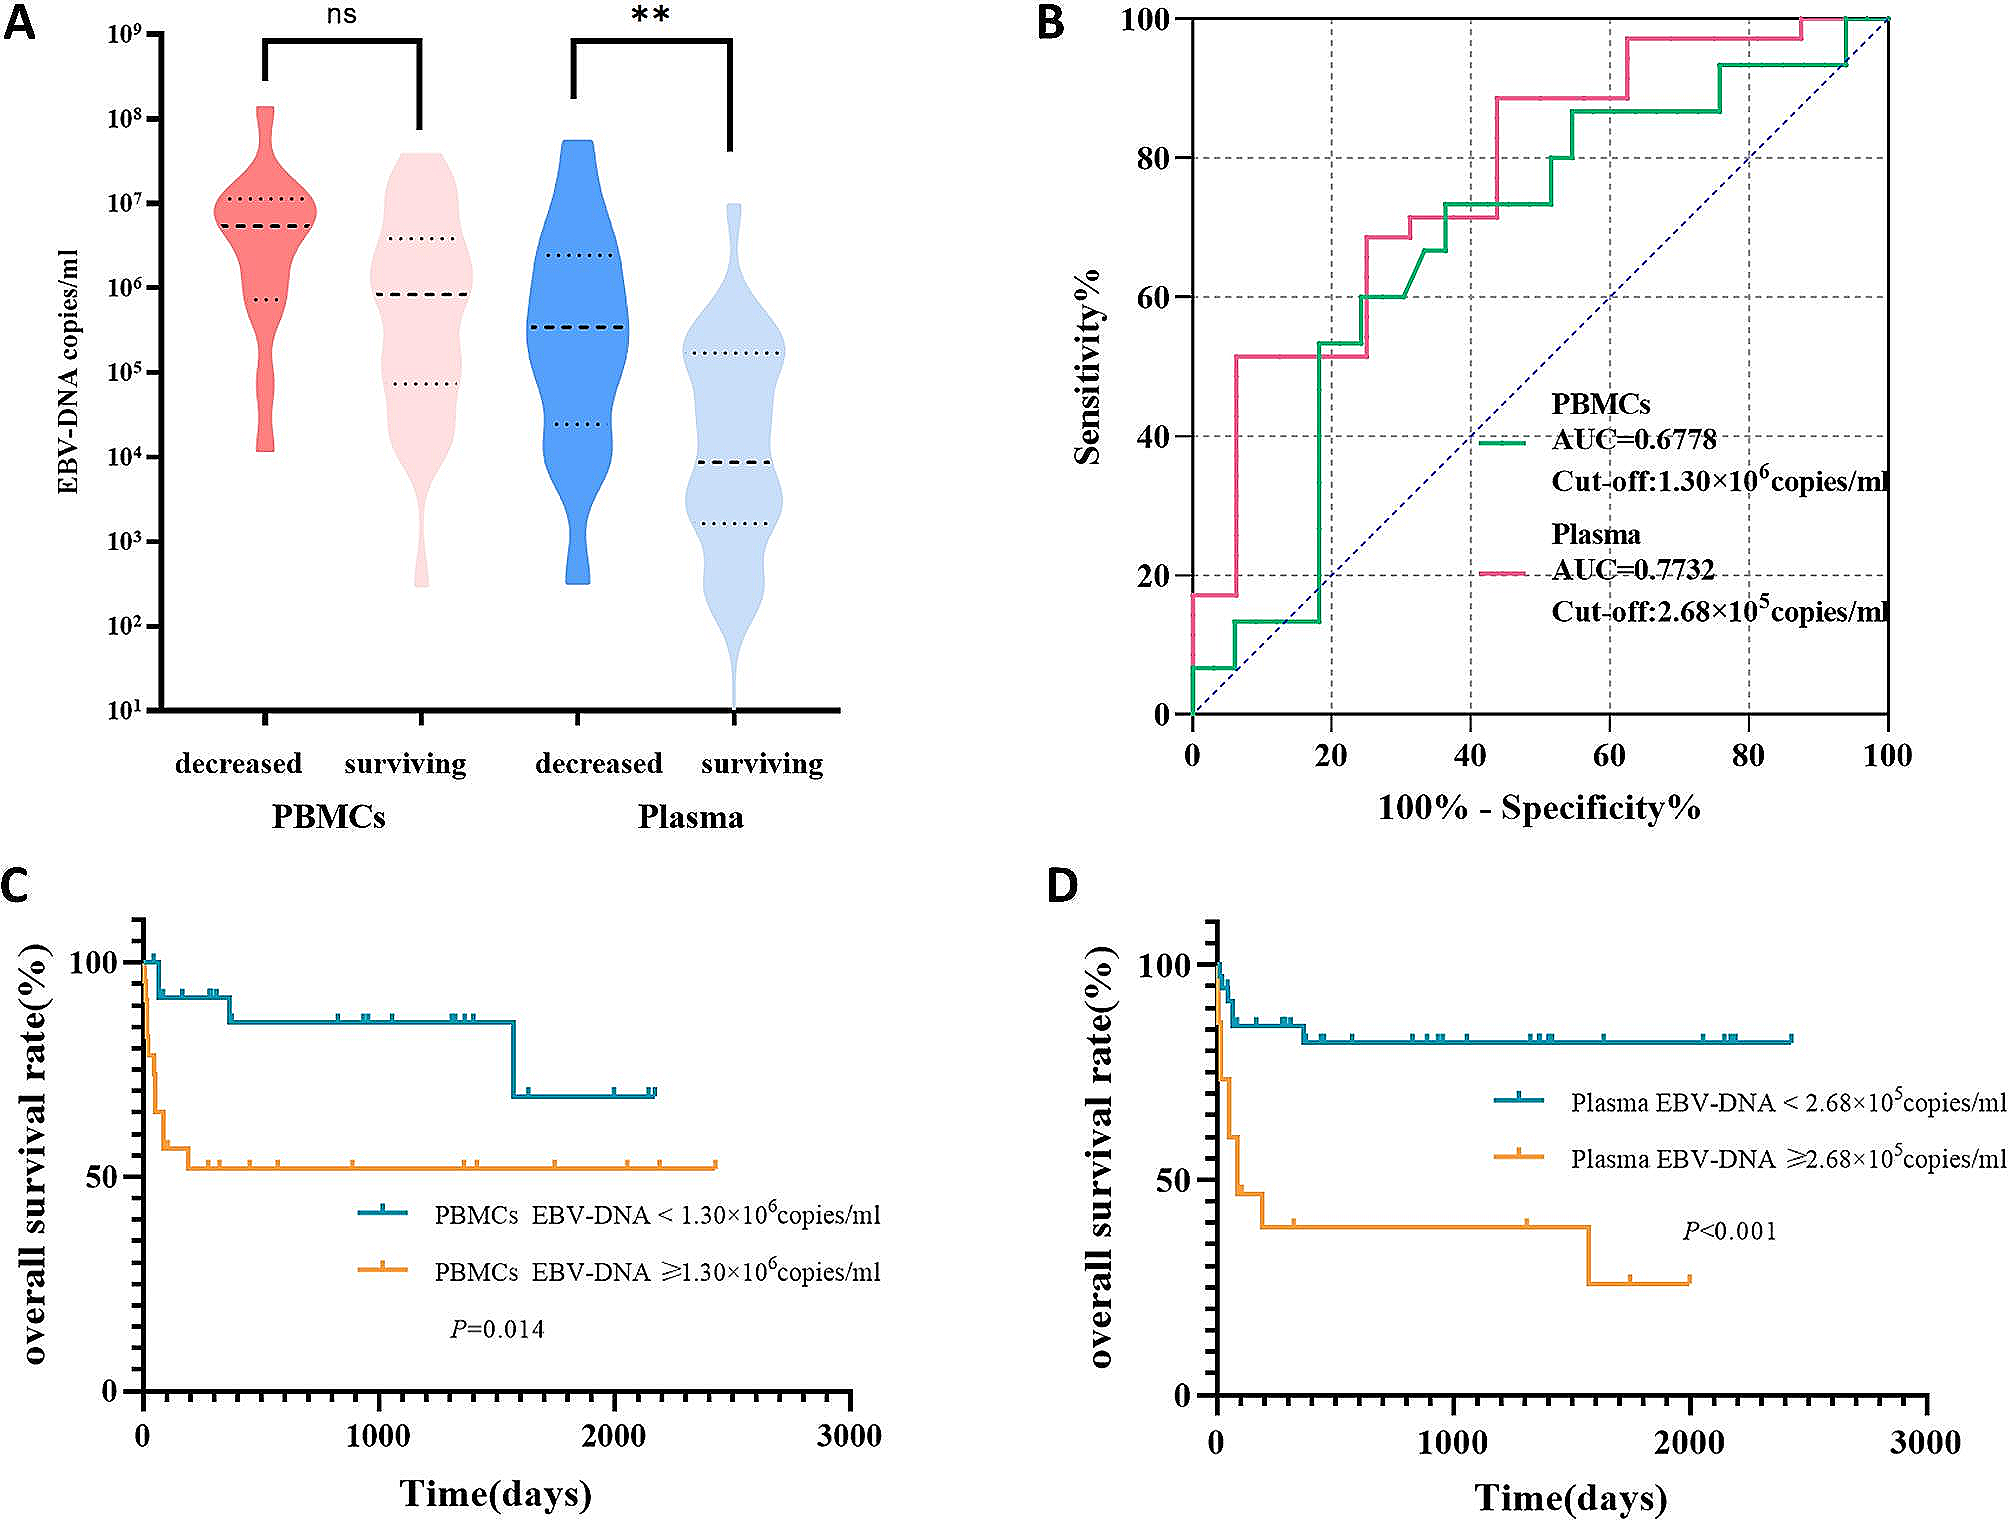
Table 2 Initial EBV-DNA levels in patients with EBV-HLH with different backgroundsPrognostic value of initial EBV-DNA in EBV-HLHBased on the prognosis at follow-up, the patients were categorized into two groups: the deceased group, characterized by death resulting from disease progression, and the surviving group. It was observed that the levels of initial PBMC and plasma EBV-DNA were higher in the deceased group compared to the surviving group. Notably, a statistical difference was observed in the plasma EBV-DNA between the two groups (P = 0.002) (Fig. 1A).
Fig. 1
The significance of initial EBV-DNA in EBV-HLH. (A) EBV DNA loads in plasma and PBMCs in patients with EBV-HLH with different prognoses. (B) ROC curves for EBV DNA load in PBMCs and plasma of patients with EBV-HLH in the decreased group versus the surviving group. (C) Kaplan-Meier analysis of overall survival stratified by initial PBMCs EBV DNA load in patients with EBV-HLH. (D) Kaplan-Meier analysis of overall survival stratified by initial plasma EBV DNA load in patients with EBV-HLH
ROC analysis was used to determine the optimal cutoff value for predicting the prognosis of EBV-HLH. The area under the curve (AUC) for predicting death based on EBV-DNA loads in PBMC was 0.6778 (0.5136 to 0.8420), with a cut-off value of 1.30 × 10⁶copies/ml, a sensitivity of 73.33%, and a specificity of 63.64% (Fig. 1B). Based on the cutoff value, the patients were divided into two groups: those with an initial PBMC-EBV-DNA ≥ 1.30 × 10⁶ copies/ml and those with an initial < 1.30 × 10⁶ copies/ml. The survival rates of the two groups were compared using the Log-rank test (Fig. 1C). Results revealed that patients with initial PBMC-EBV-DNA ≥ 1.30 × 10⁶copies/ml had a significantly lower overall survival (P = 0.014).
The AUC for predicting death based on EBV-DNA loads in plasma was determined to be 0.7732 (0.6344 to 0.9121), with an optimal cutoff value of 2.68 × 10⁵copies/ml, a sensitivity of 88.57%, and a specificity of 56.25%. Patients were divided into two groups based on initial plasma EBV-DNA levels: those with initial plasma EBV-DNA loads ≥ 2.68 × 10⁵copies/ml and those with loads < 2.68 × 10⁵copies/ml. The survival rates of these groups were compared using the Log-rank test, revealing that patients with initial plasma EBV-DNA levels ≥ 2.68 × 10⁵ copies/ml exhibited a significantly lower overall survival rate. (P < 0.001) (Fig. 1D).
The significance of dynamic monitoring EBV-DNA for determining the disease status of EBV-HLHIn our study, a total of 51 patients underwent 151 PBMC-EBV-DNA tests and 159 plasma EBV-DNA tests. The 310 EBV-DNA test results were categorized into two groups: active and inactive, based on the patient’s disease status at the time of each test. The median PBMC-EBV-DNA load in the active group was 9.15 × 10⁵ copies/ml, which was significantly higher than that in the inactive group(7.04 × 10⁴ copies/ml) (P < 0.001). Similarly, the median plasma EBV-DNA load in the active group(1.87 × 10⁴copies/ml) was significantly higher compared with the inactive group(2.04 × 101copies/ml) (P < 0.001) (Fig. 2A).
Fig. 2
The significance of dynamic monitoring EBV-DNA in EBV-HLH. (A) EBV DNA loads in plasma and PBMCs in different activation states of patients with EBV-HLH. (B) ROC curves for EBV DNA loads in PBMCs and plasma of patients with EBV-HLH in active group versus inactive group. (C) Kaplan-Meier analysis of overall survival stratified by dynamic plasma EBV DNA trajectories in patients with EBV-HLH
The levels of bone marrow EBV-DNA, white blood count(WBC), hemoglobin(HB), platelet count(PLT), alanine aminotransferase (ALT), aspartate aminotransferase (AST), and cytokines were compared in different disease states. It was observed that the blood cell counts(WBC, HB, PLT) in the active group were significantly lower compared to the inactive group, while the levels of bone marrow(BM) EBV-DNA, ALT, AST, and cytokines were significantly higher (P < 0.05) (Table 3).
To further assess the efficacy of PBMC and plasma EBV-DNA in distinguishing between active and inactive statues in EBV-HLH, we constructed an ROC curve (Fig. 2B). The results revealed an AUC of 0.7155 (95% CI: 0.6326 to 0.7984) for PBMC-EBV-DNA diagnosis of the active status. The cut-off value was determined to be 2.95 × 10⁵ copies/ml, with a sensitivity of 69.14%, and a specificity of 64.71%. Similarly, the AUC for plasma EBV-DNA diagnosis of active status was found to be 0.9039 (0.8541 to 0.9536), with a cut-off value of 1.32 × 10³ copies/ml, a sensitivity of 84.34%, and a specificity of 87.67%. Hence, both PBMC and plasma EBV-DNA demonstrate significant diagnostic value in distinguishing between active and inactive status in patients with EBV-HLH.
Table 3 laboratory results in the different activation status of patients with EBV-HLHPrognostic value of dynamic monitoring EBV-DNA in EBV-HLHDuring the treatment, we monitored blood EBV-DNA in EBV-HLH patients (including 151 of PBMC-EBV-DNA and 159 plasma EBV-DNA tests). Based on the results from dynamic monitoring of plasma EBV-DNA, the patients were divided into recurrent positive patients and other patients (those who tested negative after treatment and remained negative). One patient underwent only one EBV-DNA test before treatment and was therefore excluded from the analysis of this part. The rate of disease relapse in plasma EBV-DNA recurrent positive patients (85.2%) was significantly higher than that in other patients (4.3%) (P < 0.001). Furthermore, recurrent positive plasma EBV-DNA was observed in all nine EBV-positive-lymphoma-HLH patients. (Table 4).
Table 4 Comparison of relapse rates and disease backgrounds between patients with recurrent positive plasma EBV-DNA and other patients aa: One patient underwent only one EBV-DNA test before treatment and therefore was excluded from inclusion in this table.
To determine the correlation between dynamic changes of EBV-DNA and the prognosis of EBV-HLH patients, survival curves were plotted for both groups. It was observed that recurrent positive patients had a significantly lower overall survival rate than other patients (P < 0.001) (Fig. 2C).
Comments (0)