
Remember me


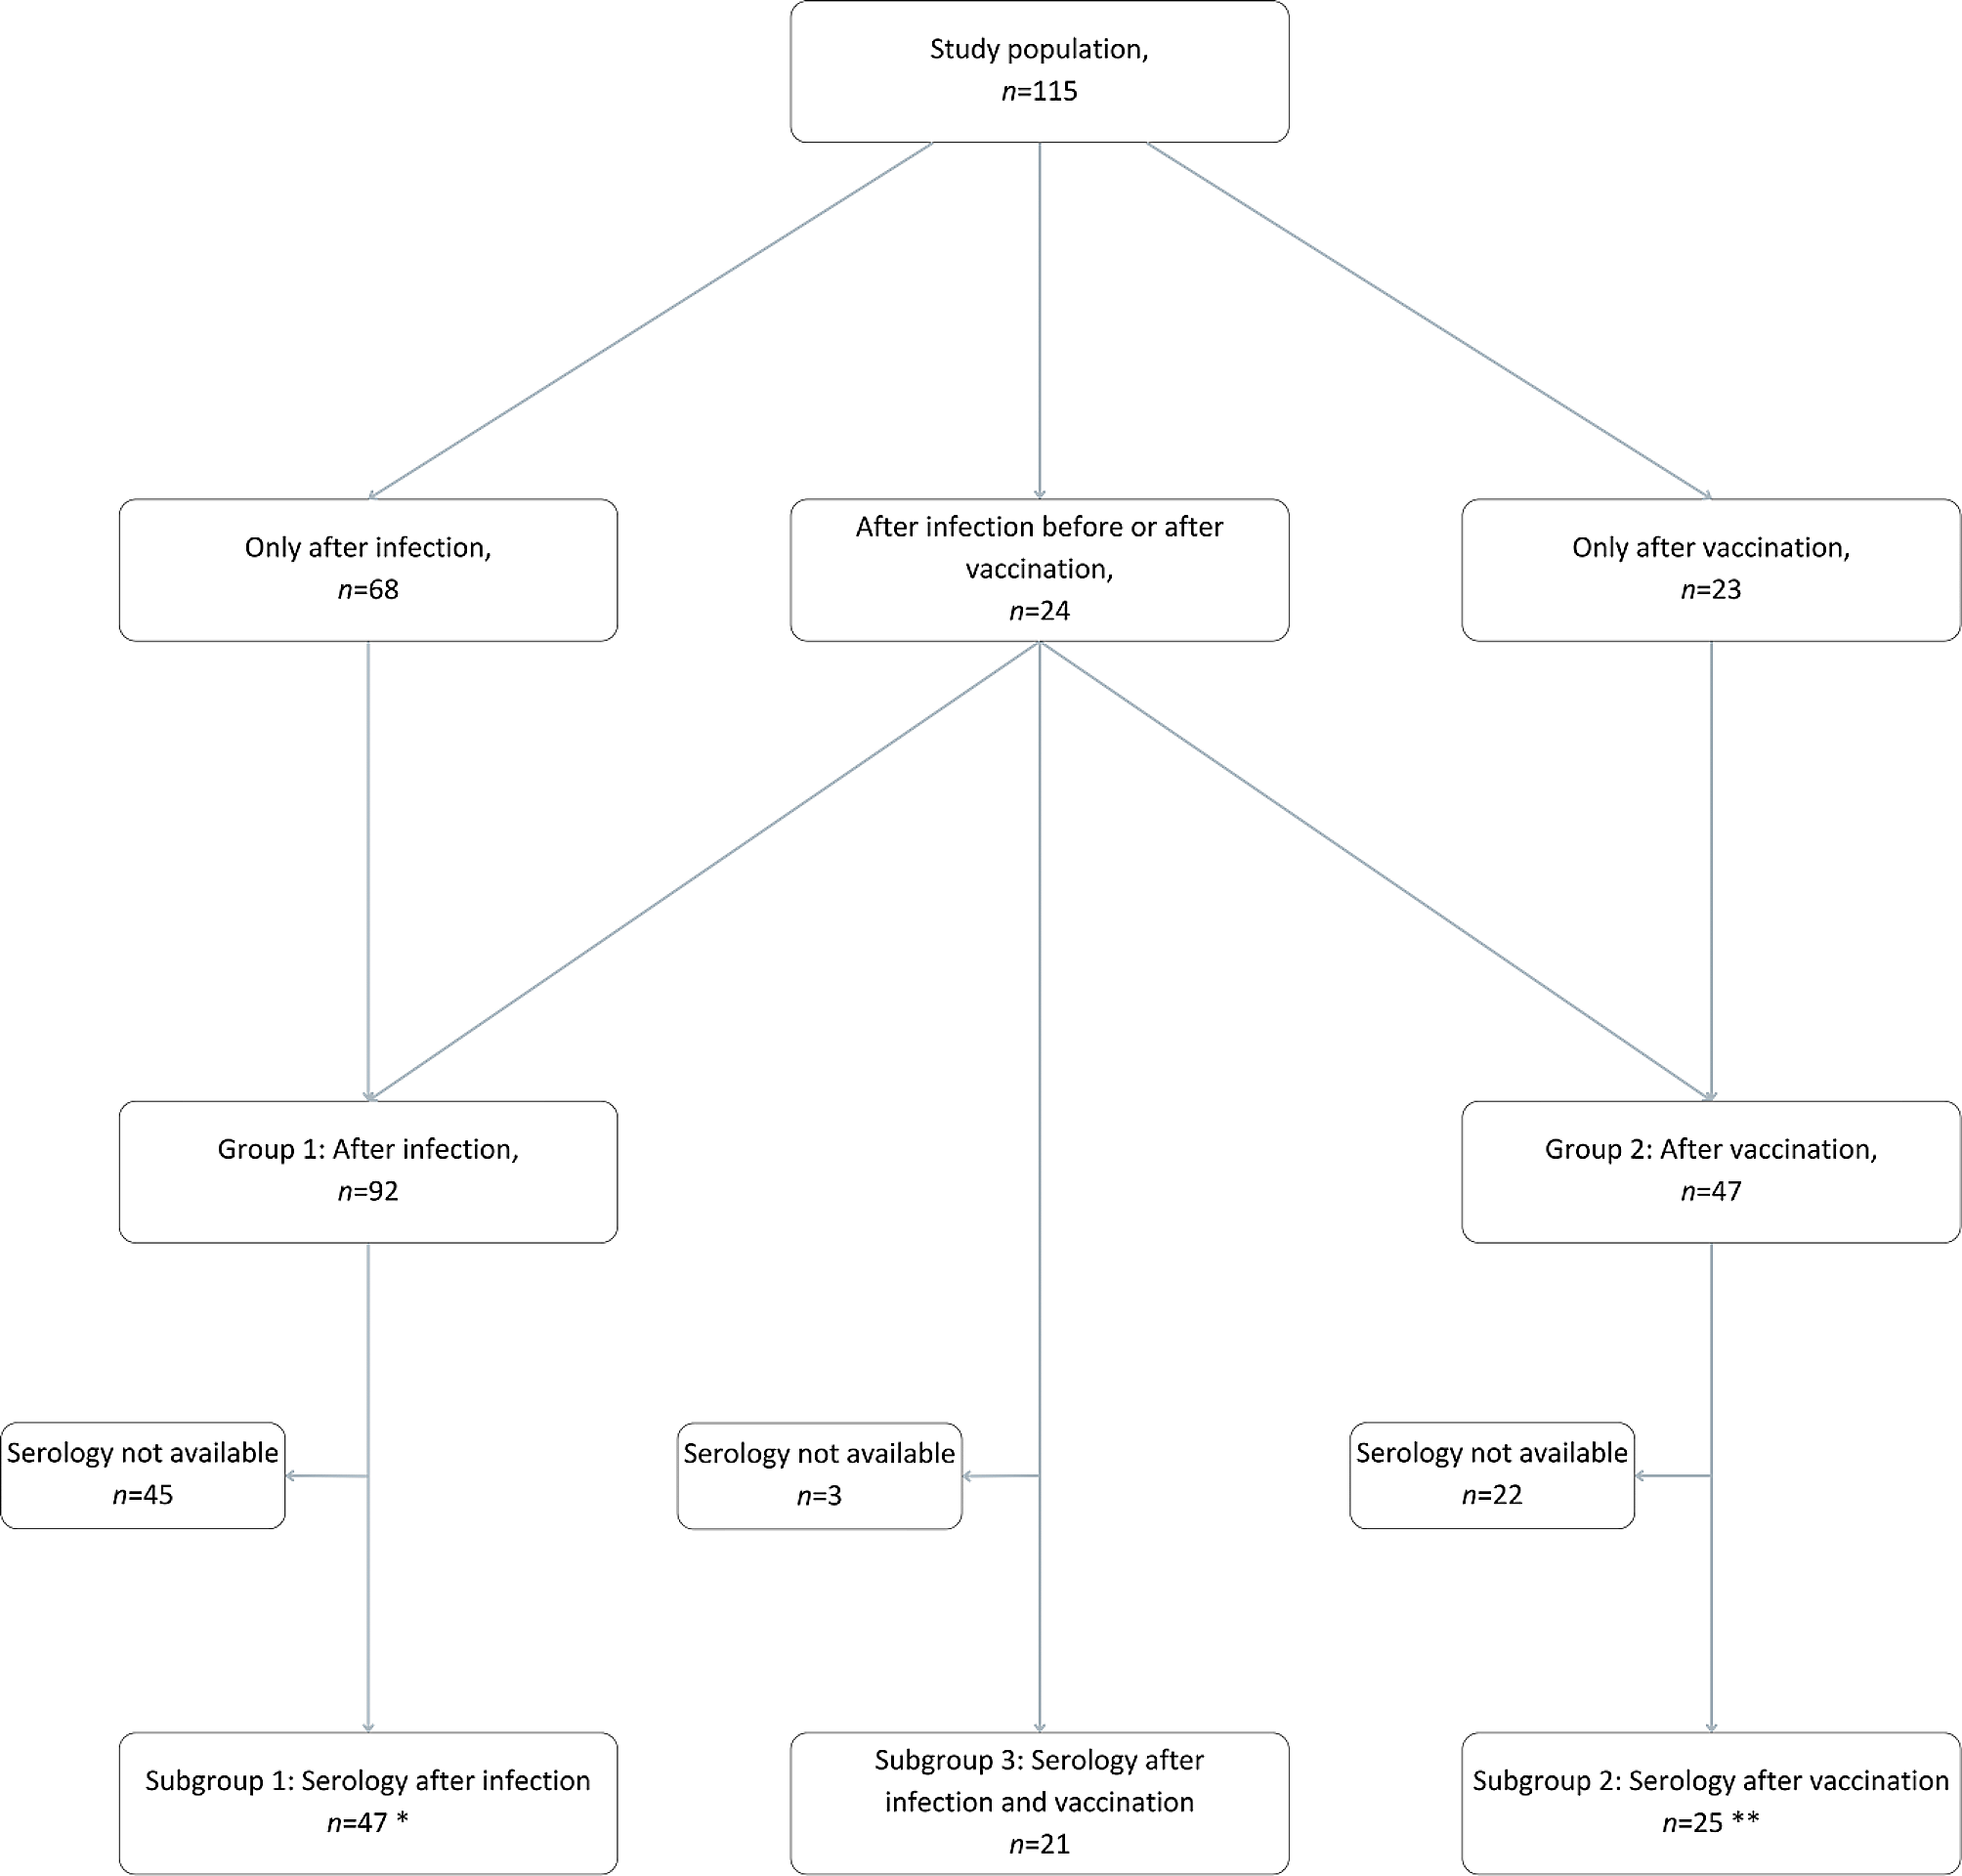
We gathered data from 115 pARD and divided them into two groups. Group 1 consisted of 92 pARD after SARS-CoV-2 infection, and Group 2 of 47 pARD after vac-cination against COVID-19. Since 24 patients had COVID-19 before or after receiving the vaccine, we included them in both groups. Therefore, in Group 1, we included pARD who only had COVID-19 (n = 68) and pARD after both events (n = 24), and in Group 2, we included pARD only after vaccination (n = 23) and pARD after both events (n = 24). The division into Groups 1 and 2 was used for the analysis of disease relapse rate in pARD. Results are already published and available in an open-access format online [3]. We determined the effectiveness of the vaccine and adverse events (AE) within Group 2.
To understand the serological response after infection or vaccination, pARD were further divided into three subgroups based on the event (infection, vaccination, or both) they experienced. Serological data were available for 47 of 92 (51%) pARD after infection (Subgroup 1) and for 25 of 47 (53%) after vaccination (Subgroup 2). For the analysis of Subgroups 1 and 2, only values after one event (infection or vaccination) were included. The serological data obtained from patients who were vaccinated before or after the in-fection (experienced both events, n = 24) were considered part of Subgroup 3 after they experienced the second event. In Subgroup 3, serological data was available for 21 of 24 pARD (88%). A graphical representation of the study population with divisions into groups and subgroups is available in Fig. 1.
The basic characteristics of the groups and subgroups are presented in the text below.
Fig. 1
Graphical representation of the study population
* Subgroup 1: of the pARD who got vaccinated after the infection, only IgG/IgA values after infection but before vaccination are included – as soon the infected pARD (Subgroup 1) got vaccinated, they were considered after both events (Subgroup 3) and their later recorded IgG/IgA values were analysed as part of Subgroup 3
** Subgroup 2: of the pARD who got infected after the vaccination, only IgG/IgA values after vaccination but before infection are included – as soon as the vaccinated pARD (Subgroup 2) got infected, they were considered after both events (Subgroup 3) and their later recorded IgG/IgA values were analysed as part of Subgroup 3
The majority of pARD had JIA (81% in Group 1, 86% in Group 2). The mean age was 13.4 (S.D.=4.1) years in Group 1, and 15.9 (S.D.=2.4) years in Group 2; there were 73% females in Group 1, and 64% in Group 2.
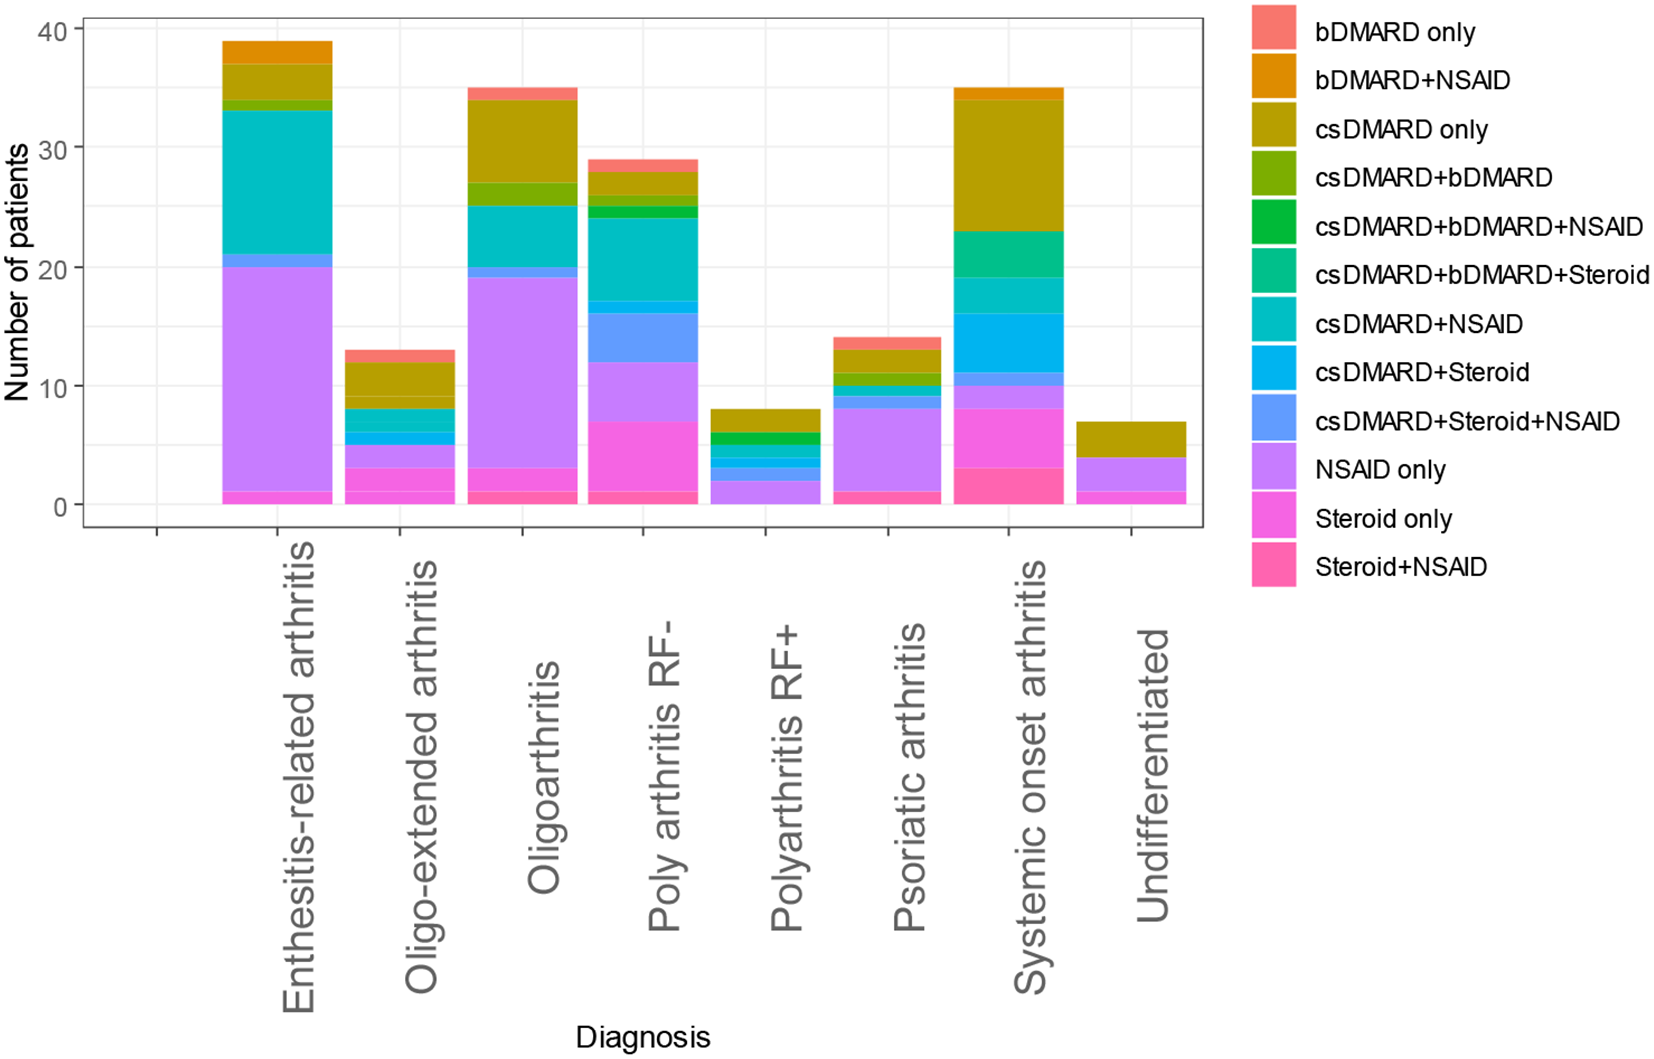
In Group 1, 69 (75%) and in Group 2, 32 (68%) of pARD were receiving immunomodulatory medications. Of those in Group 1, 23 (33%) pARD were using csDMARDs, 30 (43%) were using bDMARDs, and 16 (23%) were receiving a combination of bDMARDs and csDMARDs. Of those in Group 2, 10 (31%) were using csDMARDs, 10 (31%) were using bDMARDs, and 12 (38%) were receiving a combination of bDMARDs and csDMARDs.
More detailed information regarding groups 1 and 2 (diagnoses, therapy, etc.) has already been published and is available in an open-access format online in Tables 1 and 2 [3].
To evaluate the safety profile of the BNT162b2 Comirnaty vaccine in pARD, we also collected data from 92 healthy adolescents (63% females) who were vaccinated with two doses of the BNT162b2 Comirnaty vaccine. The mean age was 16.3 (S.D.=1.3) years at the time of vaccination. Four (4%) adolescents reported having a chronic condition; one had asthma, and three had type 1 diabetes. All 92 had no symptoms of acute disease before receiving the vaccine.
In 47 pARD, a total of 94 vaccinations were performed. On average, patients received the second dose 3.7 (S.D.=1.4) weeks after the first dose. In 92 healthy adolescents, a total of 184 vaccinations were performed. Data on the time interval between the first and second dose was unfortunately not available.
In 92 pARD, we registered 103 COVID-19 cases, 11 patients got the infection twice. Infection was confirmed by a positive RT-PCR or rapid antigen test for SARS-CoV-2 in 65 (63%) cases. In 27 (26%) cases, pARD were in contact with a SARS-CoV-2-positive person and had a typical clinical presentation of COVID-19. In the other 11 (11%) cases, COVID-19 was confirmed retrospectively by positive IgG anti-SARS-CoV-2 antibodies. A more in-depth description regarding COVID-19 confirmation has already been published and is available in an open-access format online [3].
Serological response after COVID-19 infection and vaccinationBasic characteristics for the three subgroups of pARD are available in Table 1.
Table 1 Basic characteristics of patients with available serological dataIn Subgroup 1, 35 (74%) pARD were on immunomodulatory medications (Table 2). Of those, 28 (80%) were receiving one, 6 (17%) two, and 1 (3%) three medications. Twelve (26%) pARD were not taking any medications at the time of SARS-CoV-2 infection.
In Subgroup 2, 15 (60%) pARD were on immunomodulatory medications (Table 2). Of those, 10 (67%) were receiving one, and five (33%) two medications. Ten (40%) pARD were not taking any medications at the time of vaccination against COVID-19.
In Subgroup 3, 15 (71%) pARD were on immunomodulatory medications (Table 2). Of those, 9 (60%) were receiving one, and six (40%) two medications. Six (29%) were not taking any medications at the time of the second event (infection or vaccination).
Table 2 Medications among patients with available serological dataWe confirmed the anti-SARS-CoV-2 antibodies in 40 (85%) pARD from Subgroup 1, in 25 (100%) from Subgroup 2, and in 21 (100%) from Subgroup 3. To compare the mean levels of IgA and IgG antibodies between the three groups in three different time frames (less than three months, three to six months, and six to 12 months), we performed one-way ANOVA.
IgG antibody levelsThere was a statistically significant difference in IgG levels between the three Subgroups as determined by one-way ANOVA for all time frames (less than three months, three to six months, and six to 12 months). The results were as follows:
For less than three months after infection, vaccination, or the second event (in Subgroup 3): F(2,53) = 55.70, p < 0.001. A Tukey post hoc test revealed that IgG antibody levels were statistically significantly lower in Subgroup 1 (2.61 ± 2.83) compared to Subgroup 2 (8.84 ± 2.80, p < 0.001) and Subgroup 3 (10.12 ± 1.92, p < 0.001). There was no statistically significant difference in IgG levels between Subgroups 2 and 3 (p = 0.43).
For three to six months after infection, vaccination, or the second event (in Subgroup 3): F(2,29) = 16.43, p < 0.001. A Tukey post hoc test revealed that IgG antibody levels were statistically significantly lower in Subgroup 1 (2.82 ± 2.23) compared to Subgroup 2 (6.99 ± 2.90, p < 0.001) and Subgroup 3 (9.59 ± 0.57, p < 0.001). Again, there was no statistically significant difference in IgG levels between Subgroups 2 and 3 (p = 0.24).
For six to 12 months after infection, vaccination, or the second event (in Subgroup 3): F(2,29) = 19.68, p < 0.001. A Tukey post hoc test revealed that IgG antibody levels were statistically significantly lower in Subgroup 1 (2.61 ± 2.63) compared to Subgroup 2 (8.61 ± 3.33, p < 0.001) and Subgroup 3 (9.93 ± 1.24, p < 0.001). Again, there was no statistically significant difference in IgG levels between Subgroups 2 and 3 (p = 0.76).
IgA antibody levelsSimilar results were obtained for IgA antibodies with a statistically significant difference in IgA levels between the three Subgroups as determined by one-way ANOVA for all time frames (less than three months, three to six months, and six to 12 months).
For less than three months after infection, vaccination, or the second event (in Subgroup 3): F(2,53) = 32.39, p < 0.001. A Tukey post hoc test revealed that IgA antibody levels were statistically significantly lower in Subgroup 1 (1.49 ± 2.12) compared to Subgroup 2 (5.84 ± 4.72, p = 0.008) and Subgroup 3 (10.08 ± 4.60, p < 0.001). There was a statistically significant difference in IgA levels between Subgroups 2 and 3 (p = 0.014).
For three to six months after infection, vaccination, or the second event (in Subgroup 3): F(2,29) = 4.02, p = 0.029. A Tukey post hoc test revealed that IgA antibody levels were statistically significantly lower in Subgroup 1 (2.29 ± 2.67) compared to Subgroup 3 (7.00 ± 4.78, p = 0.023), but no statistically significant difference was noted when compared to Subgroup 2 (2.68 ± 2.00, p = 0.92). There was a statistically significant difference in IgA levels between Subgroups 2 and 3 (p = 0.049).
For six to 12 months after infection, vaccination, or the second event (in Subgroup 3): F(2,29) = 4.43, p = 0.021. A Tukey post hoc test revealed that IgA antibody levels were statistically significantly lower in Subgroup 1 (2.41 ± 2.90) compared to Subgroup 2 (7.49 ± 6.33, p = 0.018), but no statistically significant difference was noted when compared to Subgroup 3 (5.97 ± 5.20, p = 0.43). Again, we found no statistically significant difference in IgA levels between Subgroups 2 and 3 (p = 0.87).
A graphical representation of the results is available in Figs. 2 and 3.
Fig. 2
IgG antibody levels after COVID-19 infection, vaccination or both events
Fig. 3
IgA antibody levels after infection, vaccination or both COVID-19 infection, vaccination or both events
Effect of medications on IgG and IgA responseA series of Mann-Whitney U tests were conducted to determine whether there is a difference in IgG and IgA levels between pARD who were receiving methotrexate (MTX) or TNF-α inhibitors at the time of infection, vaccination, or the second event (Subgroup 3) and those who were not. Tests were carried out for Subgroups 1 and 2 for the three time frames (less than three months, three to six months, and six to 12 months), and for Subgroup 3 for one time frame only (less than three months), since not enough data were available to also do the test for the other two time frames (three to six months and six to 12 months). In total, for each medication 14 tests were performed, therefore, the Benjamini and Hochberg method to control the false discovery rate when doing multiple comparisons was used, and for this part of the analysis a p-value < 0.0036 was considered statistically significant.
The results indicated a non-significant difference between pARD who were taking MTX compared to those who were not for all Subgroups and observed time frames (p > 0.0036). Similarly, no statistically significant difference was noted between pARD who were receiving TNF-α inhibitors compared to those who were not for all Subgroups and observed time frames (p > 0.0036).
Safety of the BNT162b2 comirnaty vaccineWe received completed questionnaires regarding the safety of the vaccine from 43 pARD (91%) and 92 healthy adolescents (100%) after vaccination with the BNT162b2 Comirnaty vaccine. The basic characteristics of healthy adolescents are reported in Table 3.
Table 3 Basic characteristics of healthy adolescentsResults of reported AE after the first and the second dose of the BNT162b2 Comirnaty vaccine for pARD and healthy adolescents are available in Table 4.
Table 4 Adverse events after the first dose of the BNT162b2 Comirnaty vaccine in healthy adolescents and patients with autoimmune rheumatic diseasesTo evaluate the overall frequency of AE between pARD from Group 2 and healthy adolescents, a Chi-square test was performed. The results showed no statistically significant difference between the two groups, with p-values of 0.20 after the first dose and 0.59 after the second dose of the vaccine. Furthermore, we compared the frequency of local and systemic AE between the two groups. There were no statistically significant differences in local AE, with p-values of 0.47 after the first and 0.55 after the second dose of the vaccine. However, systemic AE were more frequently observed in healthy adolescents after the first (p = 0.039) but not after the second dose of the vaccine (p = 0.90).
Next, a series of Chi-square tests and Fisher’s exact tests (when at least one of the observed values was zero) were executed to evaluate the frequency of each adverse event between the two groups. P-values of < 0.05 were calculated for tiredness after the second dose (p = 0.021) and for weakness after both doses of the vaccine (p = 0.0050 after the first and 0.046 after the second dose of the vaccine, respectively). However, after using the Benjamini and Hochberg method to control the false discovery rate when applying multiple comparisons, none of the results were statistically significant anymore.
Efficacy of the BNT162b2 comirnaty vaccineAfter getting vaccinated against COVID-19, pARD were followed, on average, for 38.3 (S.D.=11.1) weeks after receiving the second dose. The median follow-up time was 41.3 (IQR 31.3–45.8) weeks. Nineteen (40%) pARD reported having COVID-19 even though they were fully vaccinated, on average 19.2 (S.D.=7.4) weeks after receiving the second dose of the BNT162b2 Comirnaty vaccine. Of those, 16 (84%) had a mild, and three (16%) had a moderate clinical presentation of the disease. None required hospitalization because of COVID-19. In pARD who were vaccinated and still got COVID-19, we registered three (16%) patients who experienced a relapse of their ARD after infection. More detailed information about the clinical presentation of COVID-19, and the relapse rate of the ARD after COVID-19 and vaccination against COVID-19 has already been published. Data is available in an open-access format online [3].
Comments (0)