Study design
We analyzed data drawn from two waves of the COVID States Project, a nonprobability [17] web-based survey conducted by a consortium of academic sites (COVIDstates.org) between November 2, 2023, and January 8, 2024. Primary analyses combined Wave 29, conducted between November 2 and December 2, 2023, and Wave 30, conducted between December 21, 2023, and January 26, 2024. Participants were individuals 18 and older residing in the United States who elected to take a general opinion survey through a commercial survey panel aggregator (PureSpectrum); they were drawn from all 50 U.S. states and the District of Columbia. To maximize representativeness, the survey applied state-level Census-based quotas intended to balance the sample on age, gender, race, and ethnicity. Participants provided written online consent before answering survey questions. The survey protocol was determined to be exempt by the Harvard University Institutional Review Board. We present results in accordance with AAPOR guidelines [18].
MeasuresIrritability
The Brief Irritability Test (BITe5) includes 5 questions beginning with, “Please indicate how often you have felt or behaved in the following ways, during the past two weeks, including today.” [19] For each item, frequency is reported on a 1–6 scale, from never to always, and item scores are summed to yield a total score between 5 and 30. Items were derived from a larger set to minimize overlap with depression, anger, and other related constructs; in a validation study it further demonstrated minimal effects of gender and strong internal consistency [19], and it has been employed in other survey-based investigations of negative affect (see, e.g., Li [20]). A recent psychometric review of irritability measures in young adults concluded that the BITe5 was optimal for this application [21].
Mood, anxiety, and thoughts of death and suicide
Depressive symptoms were assessed with the 9-item Patient Health Questionnaire (PHQ-9) to screen for depressive symptom severity [22, 23]. The 9 items reflect the individual diagnostic criteria for major depressive disorder in the DSM-5; respondents rate each symptom in terms of frequency over the prior 2 weeks on a 0–3 Likert-type scale (0 = not at all, 3 = nearly every day). A score of 10 or greater, representing at least moderate depression, was used to define a probable major depressive episode [22, 23]. Item 9 of this scale specifically assesses thoughts of death or suicide, asking about frequency of “[t]houghts that you would be better off dead, or of hurting yourself.” [24] Anxiety was measured using the 2-item Generalized Anxiety Disorder screen (GAD-2), derived from the 7-item version [25], which has been shown to have similar performance as a screening measure; a 3 or greater on this scale represents probable generalized anxiety.
Sociodemographic variables
We collected sociodemographic features by self-report. We asked survey respondents to identify race and ethnicity from a list including African American or Black, Asian American, Hispanic, Native American, Pacific Islander, white, or other, with the opportunity to provide a free text self-description. These categories were collected in order to confirm representativeness of the U.S. population, and are reported as advised in a recent guidance statement [26]. As in prior work, to facilitate the inclusion of smaller groups, we collapsed Native American, Asian-Pacific Islander, and other into a single category for analysis. Employment status was dichotomized to “working full-time” (yes vs. all others) as a dichotomous variable for consistency with prior work using this survey. Household socioeconomic status was collected by asking about annual household income, categorized as <$25k, $25–<$50k, $50k–<$100k, or $100k+ per year. Educational status was collected by asking respondents to select from highest level of formal education from among some high school or less, high school graduate, some college, undergraduate degree, or graduate degree.
Statistical analysis
All analyses used R 4.3.2 [27]. For continuous measures we report mean and SD; for categorical variables, we report proportions and confidence intervals. In all regression models, we considered the following sociodemographic features: age in years, gender, education, annual household income, employment status, race and ethnicity, and rural, suburban, or urban setting based upon zip code. Extended regression models also included total depression severity as measured by PHQ-9 (or PHQ-8, where suicidal ideation was the dependent variable) and total anxiety severity as measured by GAD-2. As advised for nonprobability samples [28], we applied interlocking poststratification survey weights to approximate national demographic distributions (race and ethnicity, age, gender, educational level, region, and living in urban, suburban, or rural areas) as determined by 2020 US Census American Community Survey results [29], using the R survey package [30] (version 4.2–1). For participants who responded to more than one survey wave, the initial (index) survey was included; analyses of prior waves adopting alternate approaches (random selection of a wave, or including all observations as nested within an individual) yielded similar results [31]. In light of very low rates of missing data (Table 1), we did not apply multiple imputations. For all analyses, two-tailed p < 0.05 was considered to represent statistical significance.
Table 1 Characteristics of survey respondents with or without moderate or greater depressive symptoms.We first examined associations between irritability and individual sociodemographic features as specified above via univariate and multivariable linear regression models, to understand potential correlates of irritability. We adopted the same approach to examine associations between total irritability score and total depression and anxiety scores, again in univariate and multivariable (sociodemographic-adjusted) linear regression models.
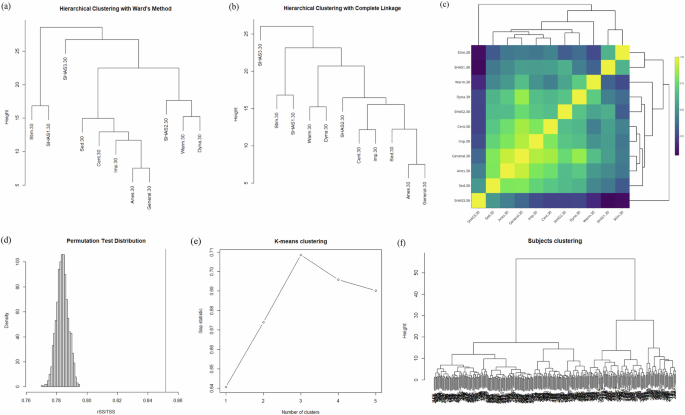
Beyond total scores, we then examined simple correlations between individual irritability, depression, and anxiety items. As a means of understanding higher-order relationships among these items (i.e., beyond bivariate correlations), we applied network analysis, visualizing symptom networks in individuals with moderate or greater depressive symptoms, and in those with less than moderate symptoms (i.e., no depression or mild depression). Symptoms were visualized using the igraph package [32] as enhanced by Ognyanova [33]; networks were contrasted using permutation to determine if they were significantly different in structure.
We then investigated the nature of the relationship between suicidal ideation, measured by PHQ-9 item 9, and irritability. These analyses utilized linear regression, both univariate and multivariable with adjustment for sociodemographic features. While all other analyses treated survey data cross-sectionally (i.e., with one observation per participant), we then investigated whether irritability preceded emergence of suicidal ideation. To do so, we derived a sub-cohort from the total group, defined by individuals who responded to survey Wave 29 and returned for Wave 30 (n = 2295), and whose PHQ-9 item 9 score at Wave 29 was 0 (n = 1979; 86.2%), indicating no suicidal ideation or thoughts of death at initial survey. After characterizing this group descriptively, we used logistic regression to examine association irritability at initial survey and new onset of suicidal ideation at subsequent survey, adjusting for sociodemographic features.
Finally, we investigated the characteristics of individuals who experience high levels of irritability outside of a probable major depressive episode or positive screen for generalized anxiety, defined as individuals with PHQ-9 less than 10 (i.e., less than moderate depression) and GAD-2 less than 3 (i.e., not screen-positive for generalized anxiety disorder) and irritability in the top decile of symptoms across the population. These analyses again applied linear regression to investigate associations between sociodemographic features and irritability.

Comments (0)