Cell culture and transfection
Human umbilical vein endothelial cells (HUVECs) and human VSMCs were purchased from CHI Scientific, Inc. (7–1074) and Procell Technology Co. (CP-H081), respectively. FBS (Gibco, Invitrogen, New York, USA) was ultracentrifuged (Beckman, Germany) at 110,000 × g for 90 min to eliminating exogenous EVs of FBS before culturing cells. HUVECs were cultured in F-12 k medium (Hyclone), supplemented with 10% FBS, 0.05 mg/ml EC growth supplement (ECGS), 0.1 mg/ml heparin (Sciencell, San Diego, USA) and 1% penicillin/streptomycin. VSMCs were cultured in high glucose Dulbecco’s Modified Eagle’s Medium (DMEM, Hyclone, Logan, USA) supplemented with 10% FBS and 1% penicillin and streptomycin (P/S; Cat. No. 15070063, Gibco). Cells were maintained at 37 °C in a 95% humidified atmosphere with 5% CO2 and passaged every 3–4 days.
For transient transfection of miR-1251-5p mimics, inhibitor or control oligos, hsa_circ_0008362 plasmid, as well as siRunx2 oligos using Lipofectamine 3000 (Invitrogen; Thermo Fisher Scientific, Inc., Waltham, MA, USA) according to the manufacturer’s instructions as previous studies descripted. MiR-1251-5p mimics, inhibitor, and control oligos were purchased from Ribobio (Guangzhou, China). Hsa_circ_0008362 plasmid and siRunx2 were synthesized by GenePharma (Shanghai, China).
EVs isolation and identification
EVs were isolated from ECs induced with normal glucose (5 mmol/L, ECNG-EVs) or high glucose (30 mmol/L, ECHG-EVs) by ultracentrifugation (Beckman, Germany). Briefly, the cell culture supernatants were centrifuged at 300 × g for 10 min, 2000 × g for 30 min, 10,000 × g for 30 min, and finally ultracentrifugation at 110,000 × g for 90 min at 4 °C.
To isolate plasma EVs, the plasma sample was diluted with phosphate buffer saline (PBS) buffer in a ratio of 1:4 before ultracentrifugation. After ultracentrifugation at 110,000 × g for 90 min at 4 °C, the EVs-enriched pellet was re-suspended in PBS and filtered through a 0.22 µm filter (Cat. No. SLGP033RS, Millipore) to remove residual cell debris. EVs were concentrated by 10 kDa centrifugal filter units (Millipore, Billerica, USA) until the final volume was about 100 μL. The protein quantification of EVs was performed using a BCA kit (Beyotime Biotechnology, Shanghai, China).
The concentration, distribution, and size of EVs were analyzed via nanoparticle tracking analysis (NTA) using a ZetaView PMX 110 (Particle Metrix, Germany) [57]. The morphology of EVs was identified using a Hitachi H-7650 transmission electron microscope (TEM; Hitachi, Tokyo, Japan). WB analysis was employed to detect EVs surface marker proteins, including CD9, CD63, TSG101, and Calnexin as previously described [2]. Besides, FBS marker BSA, as well as ECs markers, including CD31 and CD144 was measured by WB to further validate the purity and origin of EVs.
EVs uptake analysis
EVs were labelled with a PKH26 Red fluorescent cell linker kit (MINI26-1KT, Sigma) according to the manufacturer’s instructions [2]. Briefly, 5μL of the PKH26 fluorescent probe was dissolved in 1 mL Diluent C solution and incubated with 100 μg EVs at room temperature (RT) for 5 min. 1 mL BSA was used to stop the staining reaction. The labelled EVs were precipitated by ultracentrifugation at 110,000 × g for 90 min after washing with PBS. The labelled EVs were incubated with VSMCs at 37 °C for 12 h, and then VSMCs were fixed with 4% paraformaldehyde (PFA) for 30 min at RT and washed with PBS. And then VSMCs specific marker Alpha-smooth muscle actin (α-SMA) and DAPI (Invitrogen, Carlsbad, USA) were stained for 3 min and washed with PBS three times. The effects of EVs up-taken by VSMCs were observed under a laser scanning confocal microscope and Z-stack analysis (Zeiss LSM880, Germany).
In mice, the stock solution of DiR (D12731, Thermo Fisher Scientific) was prepared in ethanol and a 300 mmol/L working solution was prepared (Sigma-Aldrich). ECHG -EVs were incubated with 2 mmol/L DiR for 30 min, and then washed with PBS and followed by 110,000 × g for 90 min at 4 °C to remove free dye. The DiR dye alone or DiR-labelled EVs (100 μg per mice) were injected into wild-type (WT) mice via the tail vein, and 12 h later, the mice were imaged, and the thoracic aortas were collected. The aorta tissues were frozen in liquid nitrogen quickly to make frozen sections.
Transwell co-culture experiments
Six-well plates with a 0.4 μm pore-sized filter trans-well inserts (3412, Corning) were used following the manufacturer’s instructions. ECs (1.5 × 10⁵) cultured in the trans-well inserts and pre-treated with GW4869 (Sigma-Aldrich) for 48 h, and VSMCs (2 × 10⁵) were cultured in the six-well plate. Before starting the co-culture experiments, both ECs and VSMCs were washed with PBS and then the trans-well insert ECs were put into the six-well plate with VSMCs. All co-culture experiments were done in complete DMEM supplement with HG (30 mM). After co-culture for 72 h, the protein of VSMCs were collected for further study.
ARS staining
ARS staining was performed as previously described [2]. Briefly, VSMCs were cultured with 100 μg/mL ECHG-EVs for 14 days and fixed in 4% PFA for 30 min at RT and then stained with 1% (pH 4.2) ARS for 10 min at 37 °C. For artery samples, arteries were processed using the paraffin-embedded method, and the artery sections were stained with 1% (pH 4.2) ARS for about 1 min at RT. The stained matrixes were assessed and photographed with a digital microscope.
Alkaline phosphatase (ALP) staining
VSMCs were seeded in 24-well plates with different treatment for 7 days. After that VSMCs were washed with PBS, fixed with 4% paraformaldehyde at RT for 30 min, and washed 3 times with PBS. Then VSMCs were incubated with ALP staining working solution (C3206, Beyotime Biotechnology, Shanghai, China) at RT for 30 min in the dark according to the manufacturer’s instructions. After washing with PBS, the stained matrixes were assessed and photographed with a digital microscope.
RNA isolation and RNA analyses
Total RNA was extracted and purified from VSMCs using the miRNeasy® Mini Kit (Qiagen, cat. No. 217084) according to the standard protocol. Briefly, 700μL QIAzol lysis reagent was added, followed by chloroform extraction, and phase separation was achieved by centrifugation at 12,000 × g for 15 min at 4 °C. Total RNA was isolated from the aqueous phase by spin column purification. Concentration and purity of RNA were assessed using the RNA Nano Drop 2000 System (Agilent Technologies, CA, USA).
Quantitative real-time polymerase chain reaction (qRT-PCR)
Total RNA was extracted from cultured ECs, VSMCs, and EC-EVs using the miRNeasy® Mini Kit (Qiagen, USA). The cDNA was synthesized from 1 μg of total RNA using RevertAid™ H Minus First Strand cDNA Synthesis Kit (Fermentas, Cat#: K1631) and qRT-PCR was carried out to analyze the RNA levels of hsa_circ_0008362 and Runx2. Briefly, 25 μl of reactants were incubated in a 96-well optical plate at 95 °C for 5 min, followed by 40 cycles of 95 °C for 20 s, 60 °C for 20 s and 72 °C for 20 s. For miR-1251-5p analysis, the All-in-One™-miRNA-qRT-PCR detection system was used (AOMD-Q060, Genecopoiea) as described by the manufacturer’s protocol and using U6 snRNA as the reference. The detailed reaction conditions had been described in our previous study [2]. Briefly, a 25 µl reverse-transcription reaction was carried out for 60 min at 37 °C, 5 min at 85 °C, and a hold at 4 °C. The qRT-PCR was performed for 5 min at 95 °C, followed by 40 cycles of 10 s at 95 °C, 20 s at 60 °C, and 10 s at 72 °C. The relative mRNA and miRNA level were calculated using the relative standard curve method (2−△△CT) and normalized to the relevant control value within the sample. The following PCR primers used in this study were purchased from Genecopoeia. Other gene sequence used in the study were shown in the Supplemental Table 1.
Identification of hsa_circ_0008362
Total RNA extracted from ECs or EC-EVs was digested with RNase R (Thermo Fisher Scientifc Inc, Waltham, MA, USA) for enrichment of circRNAs. Reverse transcription was conducted and the level of hsa_circ_0008362 and FBXW4 mRNA were detected by qRT-PCR. Besides, the size of the reverse transcription product (hsa_circ_0008362) was examined by 3% agarose gel electrophoresis (AGE). To determine the stability of hsa_circ_0008362, ECHG treated with Actinomycin D (5 μg/ml) following the manufacturer’s recommendation. The total RNA was collected and the level of hsa_circ_0008362 and FBXW4 mRNA were measured using qRT-PCR at 0, 2, 4, 8 and 12 h, respectively. For this measurement, 18 s RNA was used as the reference control because it is very stable and minimally affected by nucleases. The primers used in the study were shown in supplemental Table 1.
Fluorescent in situ hybridization (FISH)
FISH was performed to detect the location of hsa_circ_0008362 and miR-1251-5p using a RiboTM Fluorescent In Situ Hybridization Kit (Cat#: C10910, RiboBio Co., Ltd. Guangzhou, China). VSMCs were fixed with 4% paraformaldehyde for 30 min at RT and then incubated with 200 μl pre-hybridization buffer for 30 min at 37 °C. Hsa_circ_0008362 and miR-1251-5p FISH probe mix or 18 s or U6 was mixed with pre-hybridization buffer and then incubated with VSMCs at 37 °C overnight. The nuclei were stained with DAPI (Molecular Probe, Cat#: D1306). The results were observed under a Leica TCS SP5 laser confocal scanning microscope and analyzed using Image Pro Plus software (version 6.0).
Western blot (WB) analysis
Protein expression was determined by WB as previously described [6]. Briefly, 30 μg protein was analyzed by SDS gel electrophoresis and then transferred to a polyvinylidene fluoride membrane. After blocking with 5% non-fat milk, the membrane was incubated with primary antibodies, including anti-CD9 (20597-1-AP, 1: 2000, Proteintech), anti-CD63 (bs-23032R, 1:1000, BIOSS), anti-TSG101 (A1692, 1: 1000, abclonal), anti-calnexin (81938-1-RR, 1:5000, Proteintech), anti-CD31(A19014, 1: 2000, abclonal), anti-CD144 (AF6265, 1:1000, Affinity), anti-BSA (ab79827, 1:5000, Abcam), anti-BMP2 (66383-1-Ig, 1:2000, proteintech) and anti-Runx2 (ab23981, 1:1000, Abcam) at 4 °C overnight. The next day, the membranes were incubated with appropriate secondary antibody (1:4000 dilution) at RT for 1 h. The immunoreactive bands were processed using an enhanced chemiluminescence (ECL) kit (Cat#: RPN2232, Amersham Biosciences Ltd., UK) and then analyzed using Image-Pro Plus software (version 6.0).
RNA pull-down
RNA pull-down assays were carried out using a Pierce™ Magnetic RNA–Protein Pull-Down Kit (Cat#: 20164, Thermo Fisher Scientific). Briefly, for each assay, biotinylated miR-1251-5p or hsa_circ_0008362 was conjugated to streptavidin magnetic beads. Then, the conjugated beads were incubated with the lysates from VSMCs in binding reaction buffer at 4 °C for 60 min with rotation. Next, the bound RNA–protein complexes were washed and eluted from the magnetic beads. Finally, RNAs in the complexes were purified and the enrichment patterns of hsa_circ_0008362 mRNA or Runx2 protein were measured using qRT-PCR and WB, respectively.
Luciferase reporter assay
Partial fragments of Runx2 3’UTR containing the predicted binding sites of miR-1251-5p were amplified by PCR and cloned into XbaI-FseI restriction sites of the pGL3 luciferase reporter vector (Promega, Madison, WI, USA). VSMCs were co-transfected with a luciferase reporter carrying Runx2 wild-type 3′ UTR, Runx2 mutant 3′ UTR, and miR-1251-5p mimics or scramble oligonucleotides. Then, 48 h after transfection, luciferase activities were quantified with the luciferase reporter assay system (Promega, USA) according to the protocols of the manufacturer. The nucleotide sequences of primers for the construction and mutation of 3′ UTR Runx2 mRNA were purchased from Ribobio (Guangzhou, China).
RNA immunoprecipitation (RIP) assay
RIP assay was performed using EZ-Magna RIP kit (No. 17-701, Millipore, Billerica, MA, USA) and Argonaute 2 (Ago2) antibody (Abcam, ab32381) to explore whether Runx2 and hsa_circRNA_0008362 existed in RNA-induced silencing complex (RISC). Briefly, VSMCs were lysed in RIP lysis buffer, followed by the incubation of protein A/G magnetic beads and antibody against rabbit IgG or Ago2. Then, RNAs in magnetic beads-binding complexes were purified. Lastly, qRT-PCR assay was employed to measure the enrichment patterns of hsa_circRNA_0008362 and FBXW4 mRNA by IgG or Ago2 antibody.
Cycloheximide (CHX) experiment
To examine whether the stability of Runx2 protein was affected by hsa_circ_0008362, VSMCs were pretreated with CHX (5ug/ml). Meanwhile, VSMCs was treated with EVs (ECNG-EVs vs ECHG-EVs) or hsa_circ_0008362 plasmid, the total protein were collected and the level of Runx2 protein was measured using WB at 0, 2, 4, 8 and 12 h, respectively.
Animals
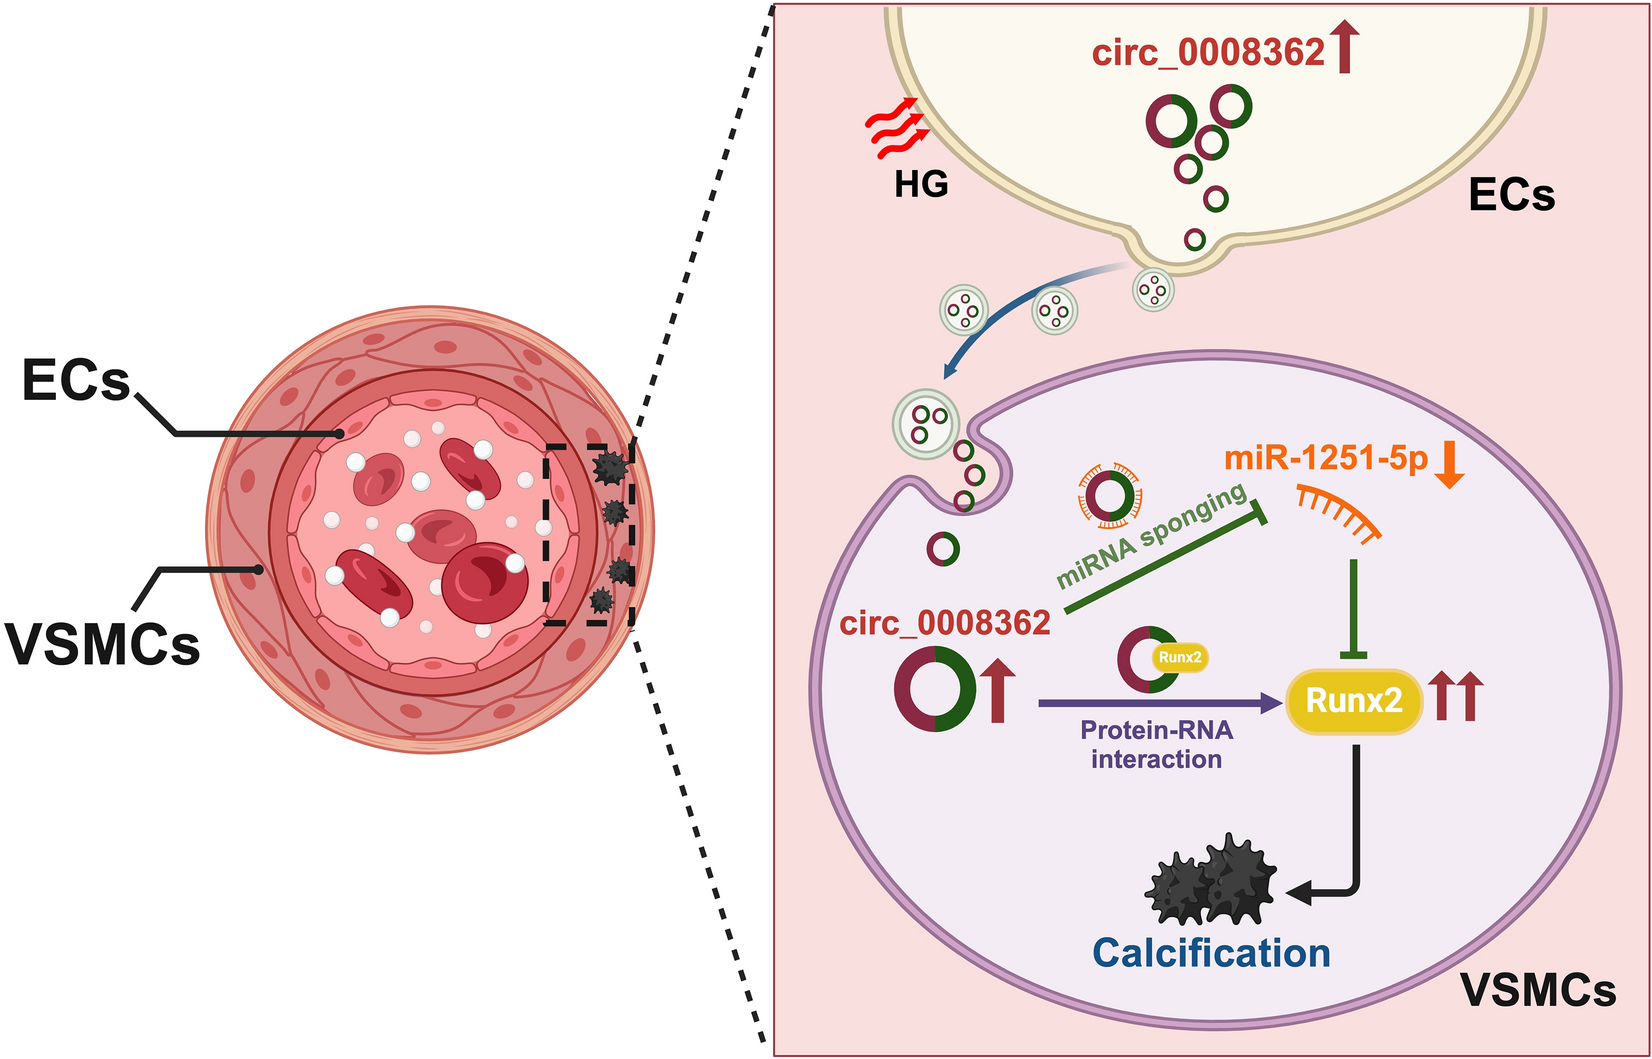
The animal investigation conformed to published guidelines (National Research Council, The Care and Use of Laboratory Animals, 7th ed. Washington, DC: National Academies Press; 1996). All animal studies were formally approved by the Ethics Committee of the Second Xiangya Hospital, Central South University (Cat#: 2021161). 15 six to eight-week-old C57BL/6 mice were divided into three groups: control group, DM + DMSO group and DM + GW4869 group. DM mice model was established by streptozotocin (STZ, Sigma). Briefly, STZ (50 mg/kg) was freshly dissolved in 0.1 M phosphate-citrate buffer (pH 4.5) and injected into mice on five consecutive days. The control mice received the same dose of citrate buffer. Blood glucose levels were monitored after 3 days, and levels > 16.67 mM indicated the onset of DM [6]. The body weight and the level of blood glucose were taken before and every week after STZ injection. After 12 weeks, mice were sacrificed, and the thoracic aortas were dissected. The expression of circ_0008362 and miR-1251-5p were detected by qRT-PCR, the level of Runx2 protein was measured by WB and immunohistochemistry. ARS staining was used to detect artery calcification. Artery calcium content was measured by the o-cresolphthalein method. Total protein was quantified using the Bradford protein assay. All mice were housed with 12 h daylight/darkness in the animal house of the Second Xiangya Hospital.
In vivo circ_0008362 overexpression was achieved by AAV9 vectors. Recombinant AAV9 vectors carrying circ_0008362 or empty vector with a plasmid cytomegalovirus (pCMV) promoter (AAV9-pCMV-circ_0008362 or AAV9-pCMV-empty) were manufactured by JTS Scientific, (Wuhan, China). AAV9-pCMV-empty served as negative control. AAV9-pCMV-circ_0008362/empty vectors (5 × 10¹¹ vector genomes/mice) were delivered by intravenous injection. Four weeks after AAV9 delivery, the overexpression of circ_0008362 was verified by qRT-PCR. The mice were sacrifice and the aorta were distracted after 12 weeks injection.
Immunohistochemistry analysis
The expression of Runx2 in the aorta tissues were examined by immunohistochemistry as described previously [22]. Briefly, sections of the arteries isolated from mice were fixed and processed using the paraffin-embedded method. Firstly, the artery tissue sections were baked at 65 °C for 2 h, followed by two rounds of dewaxing in xylene for 10 min and dehydrating in 99, 95 and 75% ethanol for 5 min each. Then, antigens were retrieved by trypsin solution and incubated with 3% hydrogen peroxide to clear endogenous peroxidase. After blocking with 5% BSA, sections were incubated with antibodies against Runx2 (ab23981, 1:100, Abcam) overnight at 4 °C. The next day, sections were incubated with a biotinylated secondary antibody and detected by the avidin–biotin-peroxidase complex and 3,3′-diaminobenzi dine chromogen (cat#: GK500710; Gene Tech, Shanghai). The immune-positive results were measured using a Nikon Eclipse microscope (Nikon Instruments Korea, Seoul, Korea) and analyzed using Image-Pro Plus software (version 6.0).
Clinical study
A total of 40 patients from the Second Xiangya Hospital of Central South University were enrolled in our study. The study included 20 patients with DM (DM group) and matched 20 normal controls (Control group). The study was approved by the Ethics Committee of the Second Xiangya Hospital of Central South University and conformed to the 1975 Declaration of Helsinki. Informed consents were gained from all subjects. The blood sample was collected in an EDTA tube. After centrifugation at 2000 × g for 30 min at 4 °C, the plasma was aspirated and stored at − 80 °C before use. The relative expression of hsa_circ_0008362 was measured by qRT-PCR. Additionally, the fasting venous blood samples of the patients were obtained after resting for at least 15 min. Lipid profile (TG, triglyceride; TC, total cholesterol; HDL-C, high-density lipoprotein cholesterol; LDL-C, low-density lipoprotein cholesterol) were collected and performed in the biochemistry laboratory at the Second Xiangya Hospital of Central South University.
The coronary computed tomography angiography (CCTA) and lung high resolution computed tomography coronary images were obtained from using the Siemens Somatom Definition computed tomography (CT) multilayer spiral scanner (Germany). Coronary artery calcification scores (CACs) and aorta artery calcification scores (AACs) were quantified via Agatston and analyzed by Siemens Ca Scoring software (syngo. via Siemens Healthcare GmbH). The CACs was calculated the sum of calcification scores of the calcified lesions from the four main branches of the coronary arteries: the left main, left anterior descending, left circumflex and right coronary artery. The AACs was calculated the sum of calcium scores of the calcific lesions from ascending aorta, aortic arch and descending aorta (thoracic aorta and part of abdominal aorta). The measure of the area of calcification times a fixed coeficient (the maximum pixel density decision) and the total score of the calcification of all faults were termed as the CACs and AACs.
Statistical analysis and reproducibility
The data analysis was performed with SPSS (version 27.0) and GraphPad Prism software (version 9.4.1). Quantitative variables were expressed as mean ± standard deviation (SD), or median with minimum and maximum. Qualitative variables were expressed as numbers and percentages. The normality of data distribution was assessed by Shapiro–Wilk test before analysis, and a student’s t-test was used to compare normally distributed data between two different groups. Comparisons of multiple groups were made using a one-way analysis of variance (ANOVA) with “Tukey’s multiple comparisons test”. The non-parametric Mann–Whitney U test was used to compare non-parametric datasets (non-normal distribution or n < 6) between two groups. Categorical variables were compared using chi-squared tests. The correlations between plasma concentration of hsa_circ_0008362 and CACs or AACs were analyzed using a Spearman’s correlation analysis. A level of p < 0.05 was considered statistically significant. All experiments were repeated at least three times, with similar results. And representative experiment results were shown in the figures.


Comments (0)