
Remember me


Approval was granted by the local ethical committee (RWTH Aachen University (Germany), reference number EK 24-177), and the requirement to obtain individual informed consent was waived. All methods were carried out following relevant guidelines and regulations. The study was designed as a retrospective study on existing radiologic images used as inputs to GPT-4V to evaluate the model’s performance. Figure 1 details the study workflow.
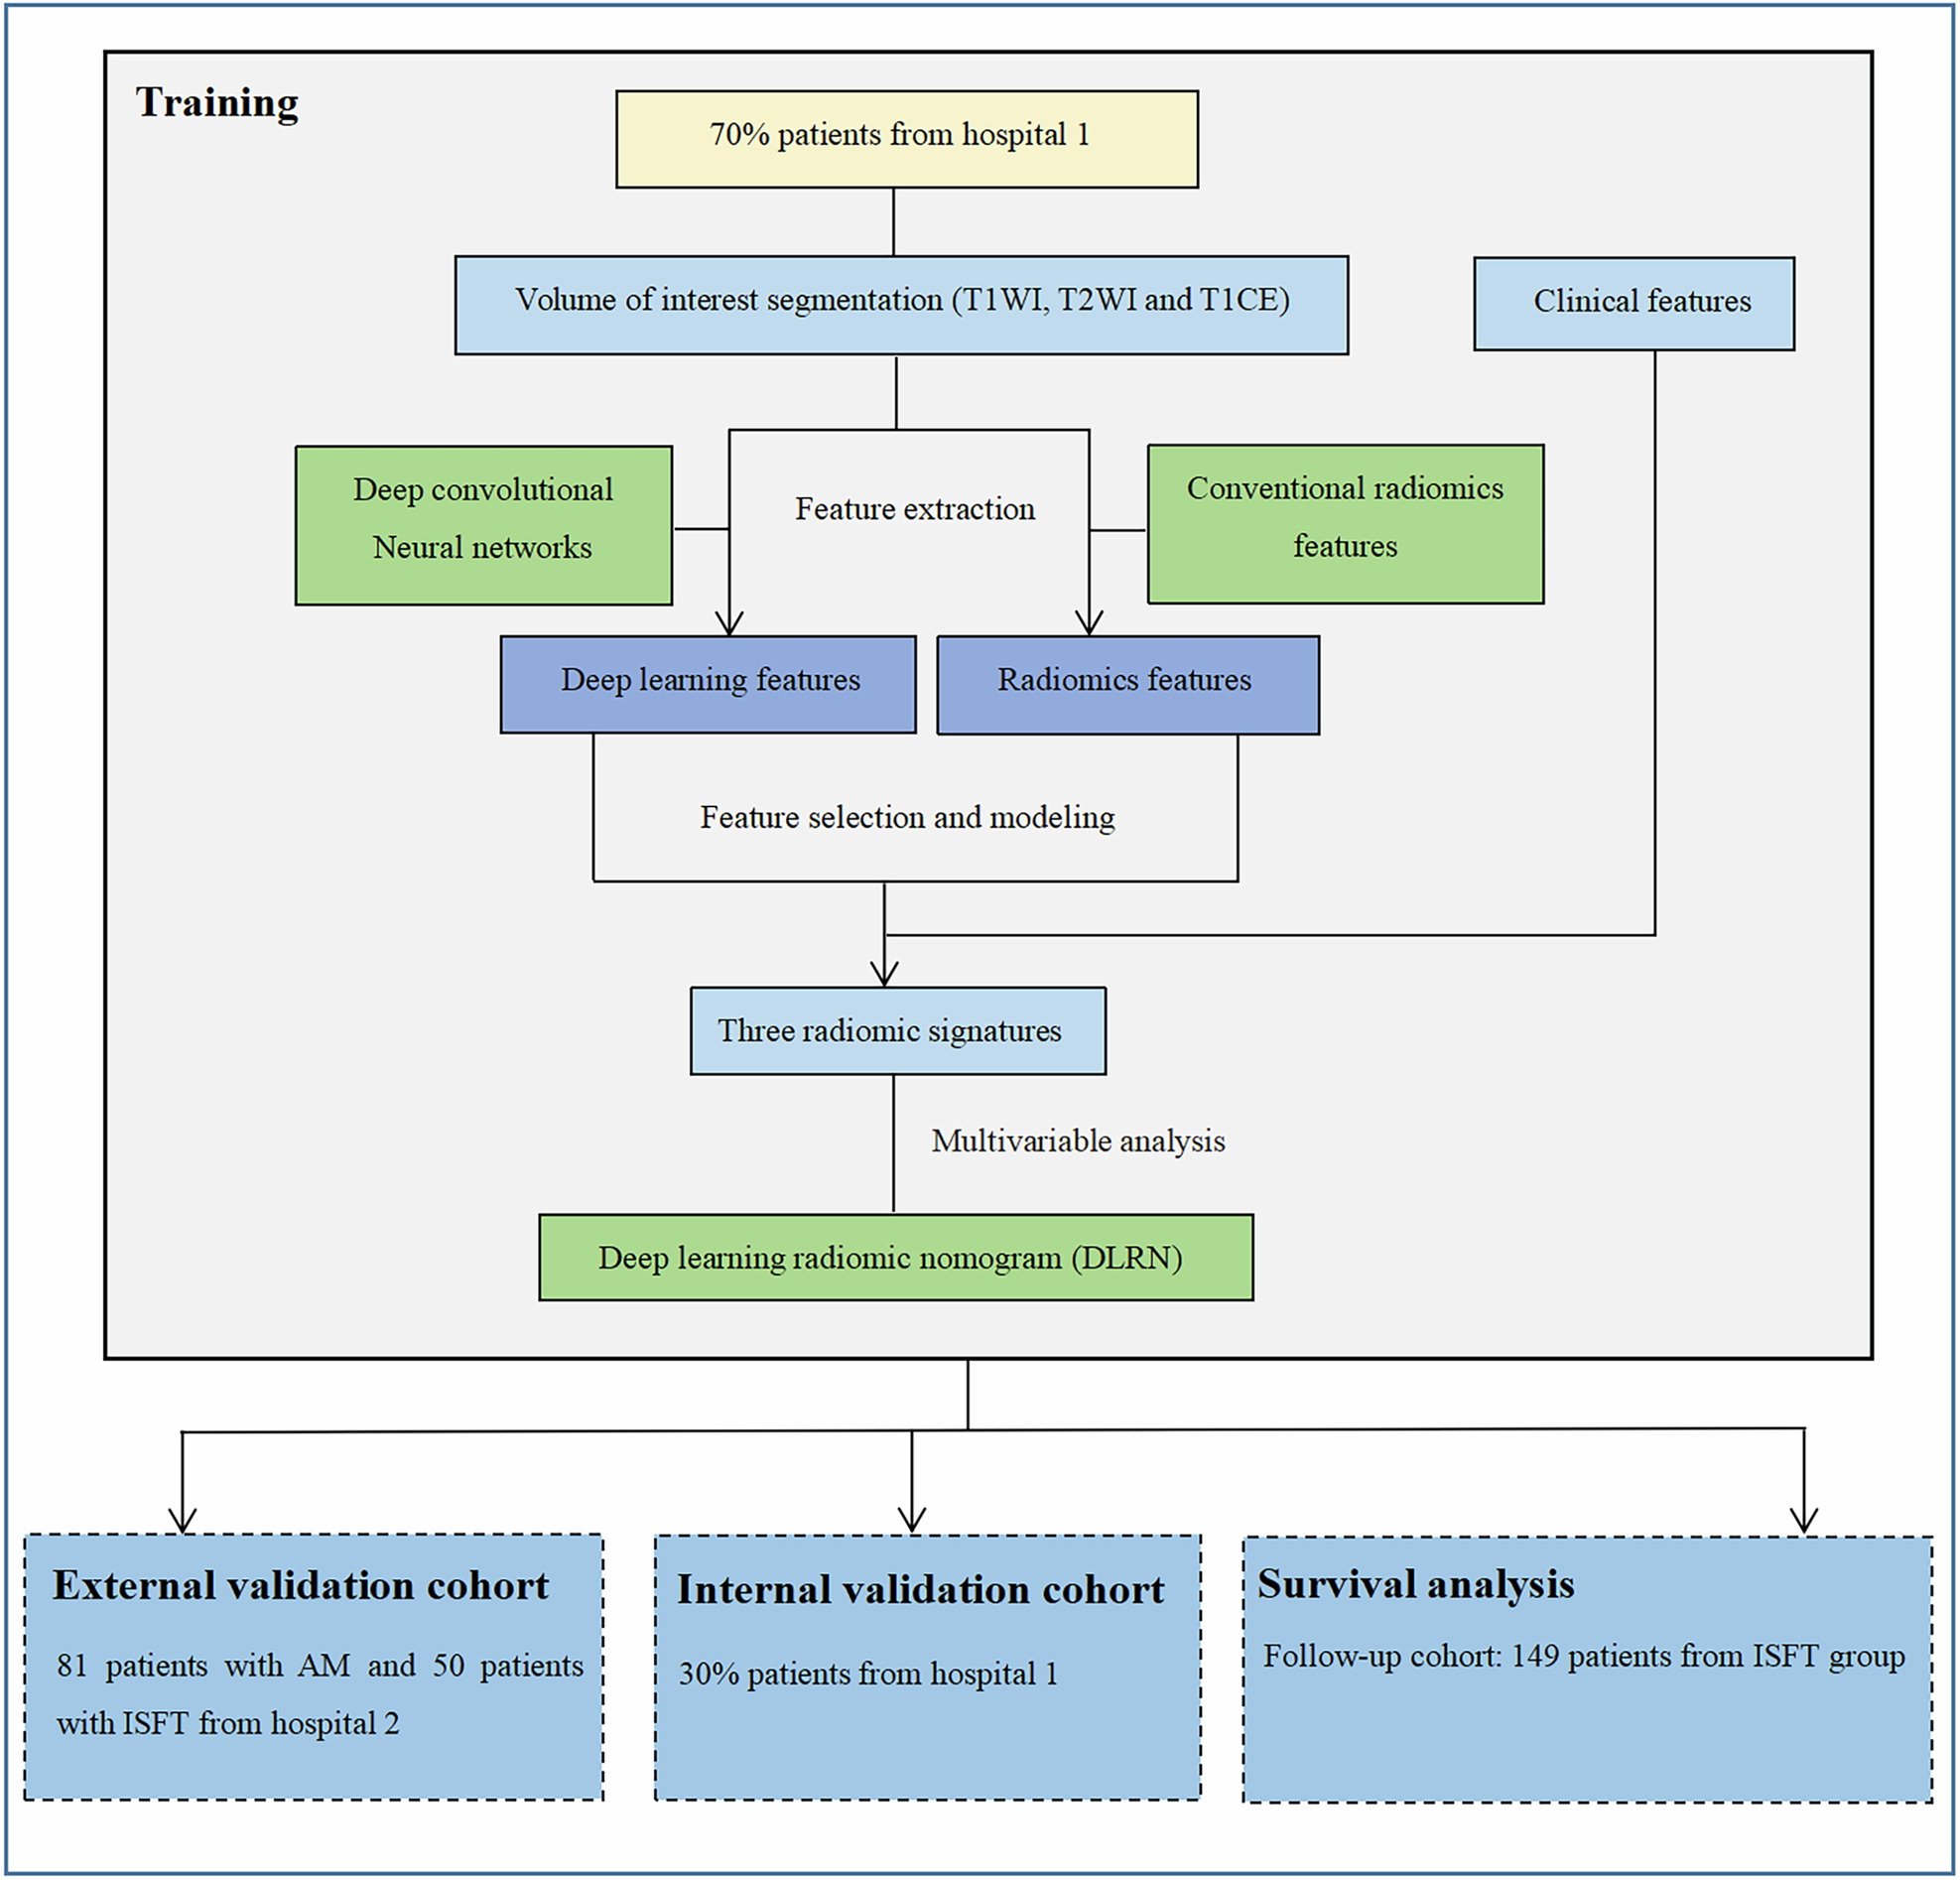
Fig. 1
Study workflow. Projections or cross-sectional images that unequivocally visualized the key finding(s) necessary to make the correct diagnosis were selected for each imaging modality. GPT-4V was tasked to read and interpret the images in a contextualized and uncontextualized manner. Its responses were analyzed using the diagnostic dimensions indicated
By screening the local PACS (Picture Archiving and Communication System, iSite, Philips Healthcare) of our tertiary academic medical center (University Hospital Aachen, Aachen, Germany), two resident radiologists (R.S. and M.H., with 4 years of clinical experience each) and two board-certified clinical radiologists (D.T. and S.N., with 10 and 8 years of clinical experience) selected 60 radiographic, 60 CT, 60 MRI, and 26 angiographic studies (Electronic Supplementary Material). The imaging studies reflected various conditions of variable severity and complexity, chief complaints, including asymptomatic individuals, and demographic characteristics, i.e., patient age and sex (Supplementary Tables S1–S4). Only imaging studies with unequivocal findings were selected, and the reference diagnoses were established based on the synopsis of (1) the assessment of the four radiologists mentioned above, (2) the original radiologic report, (3) associated clinical and non-imaging findings, and (4) follow-up imaging studies. Imaging studies were disregarded in the case of inconsistent or contradictory findings.
After removing all DICOM tags, the relevant projection (radiography), cross-sectional image (CT, MRI) or corresponding frame (angiography) demonstrating the finding unequivocally was identified for each imaging study and saved as a PNG file with a 512 × 512 (pixel) resolution.
Patient age, sex, the chief complaint (leading to the imaging study), the consented reference diagnosis, and image acquisition specifications (e.g., sequence) were registered.
GPT-4V encoding and promptingGPT-4V was accessed online (https://chat.openai.com/) from October 13, 2023, to January 17, 2024, and operated as the latest operational ChatGPT version. Alongside the respective images, prompts were provided in a standardized format for (1) uncontextualized and (2) contextualized image readings (Fig. 1).
For the uncontextualized image readings, only one prompt was provided:
Prompt #1: What is the most likely diagnosis?
For the contextualized image readings, four prompts were provided in the following sequence:
Prompt #1: Attached is a representative (radiograph–CT image–MR image–angiographic image) of (an asymptomatic) XX-year-old (female–male) who complains of (chief complaint). What is the most likely diagnosis?
Prompt #2: Which imaging finding led you to make this diagnosis?
Prompt #3: How certain are you of your diagnosis—on a scale of 0 to 10, with zero being the most uncertain and ten being the most certain?
Prompt #4: Are there plausible differential diagnoses?
The images were uploaded via the graphical user interface along with prompt #1.
If GPT-4V refused to respond, citing that it was not a medical professional, we insisted by responding: Please answer the question. What is the most likely diagnosis?
If the tool still refused to respond, we stated that our question served an educational purpose.
If GPT-4V provided numerous differential diagnoses in response to prompt #1, we instructed it to state its top differential diagnosis: Please choose only one diagnosis that you think fits best.
In select images that were misinterpreted without context but correctly interpreted with context, we introduced control conditions to evaluate whether GPT-4V’s improved accuracy was based on integrating (1) image and context or (2) context alone. Alongside the conspicuous (abnormal) image and its context, an inconspicuous (normal) image, without pathological imaging findings but obtained using identical acquisition parameters, was presented with the same context. The evaluation sequence was (1) the conspicuous (abnormal) image without context, (2) the conspicuous (abnormal) image with context, and (3) a paired inconspicuous (normal) image with an identical context. An additional prompt #5 (the same as prompt #1) was provided for these select images.
A new chat session was started for each image and reading scenario to avoid memory retention bias.
GPT-4V’s responses were saved for subsequent analyses.
Outcome metricsThe model’s outputs were evaluated regarding diagnostic accuracy, truthfulness, reasoning, confidence, contextualization, and consistency. Moreover, hallucinations and false findings were assessed.
Diagnostic accuracy was assessed by comparing GPT-4V’s responses to the established reference diagnoses and calculating the number of correct diagnoses to the total number of diagnoses.
The response was registered as ‘immediately correct’ if the correct diagnosis was given in response to prompt #1 or as ‘iteratively correct’ if given to prompt #4, i.e., mentioned among the differential diagnoses. Superordinate diagnoses (e.g., ‘peripheral artery disease’) instead of the more specific diagnosis (e.g., ‘superficial femoral artery stenosis’) were considered correct if the clinical presentation and imaging findings did not differ considerably. Overly vague diagnoses (e.g., ‘vasculopathy’) or considerably different clinical presentations and imaging findings (e.g., ‘tuberculosis’ instead of ‘miliary tuberculosis’) were considered incorrect.
Diagnostic truthfulness was assessed by the four radiologists and extended beyond the diagnosis or differential diagnoses provided by GPT-4V. The radiologists independently evaluated whether the information was valid, up-to-date, and reliable and whether the described findings were visible in the image. Notably, the training period of GPT-4V extended until 08/2022 [19], which was considered during the response quality evaluation.
Diagnostic reasoning was assessed by the same radiologists, who evaluated the plausibility of the responses to prompts #2 and #4. Key imaging findings and differential diagnoses were considered plausible or implausible for each imaging study.
Diagnostic confidence was parameterized and quantified based on the tool’s self-reported confidence scores.
Diagnostic contextualization was assessed by comparing the diagnostic accuracy of the uncontextualized and contextualized readings.
The selected imaging studies correctly interpreted only with context (and incorrectly interpreted without context) were complemented with control conditions as outlined above.
Diagnostic consistency was assessed by repeating the contextualized analysis on a subset of 20 random images after 30 and 90 days. Based on diagnostic accuracy, we assessed if the performance changed over time. Moreover, the prompt-response conversations at each time point were evaluated for consistency, i.e., how similar the content was, based on a five-point Likert scale. Here, one meant the responses were not alike, and five meant they were identical. Divergent scores were discussed until a consensus was reached.
Hallucinations were defined as (1) falsely perceived or fabricated findings, (2) non-sensical responses when considered against common knowledge in radiology, or (3) inconsistent responses when considered against the framework information stated in the prompt or visible in the image. In preliminary experiments, we observed that the differential diagnoses were usually well aligned with the reported imaging findings, irrespective of their actual presence in the image. Consequently, ‘hallucinations’ were categorized as follows:
1.Fabricated imaging findings. The tool described findings that were not visible in the image. Fabrications were further subcategorized as (1) imaging findings not present that were principally possible (e.g., cardiomegaly in chest radiographs (‘possible fabrication’)) or (2) imaging findings not present and not possible (e.g., distal radius fracture in chest radiographs (‘impossible fabrication’)).
2.Misidentified modality or anatomic region. The tool confused the imaging modality or the anatomic region, e.g., mistaking CT for radiography or the chest for the abdomen.
Statistical and power analysesM.H., R.S., and S.N. performed the statistical analysis using GraphPad Prism software (v9.5), Python (v3.11), and its library statsmodel.
Cochran’s Q test was used to assess whether the differences in diagnostic accuracy were significant. Post-hoc analysis was performed using the adjusted McNemar’s test for group-wise comparisons. Because three pairwise comparisons were conducted, the Bonferroni correction was used, and the significance level was set to α = 0.5/3 = 0.0167. Spearman’s correlation coefficient was used to quantify the correlation between diagnostic accuracy and confidence. The Chi-square test assessed whether the frequencies of fabrications and misidentifications differed significantly with or without context. Data are presented as means and 95% confidence intervals unless stated otherwise.
The power analysis is detailed in Supplementary Text S1 [20,21,22].
Comments (0)