
Remember me
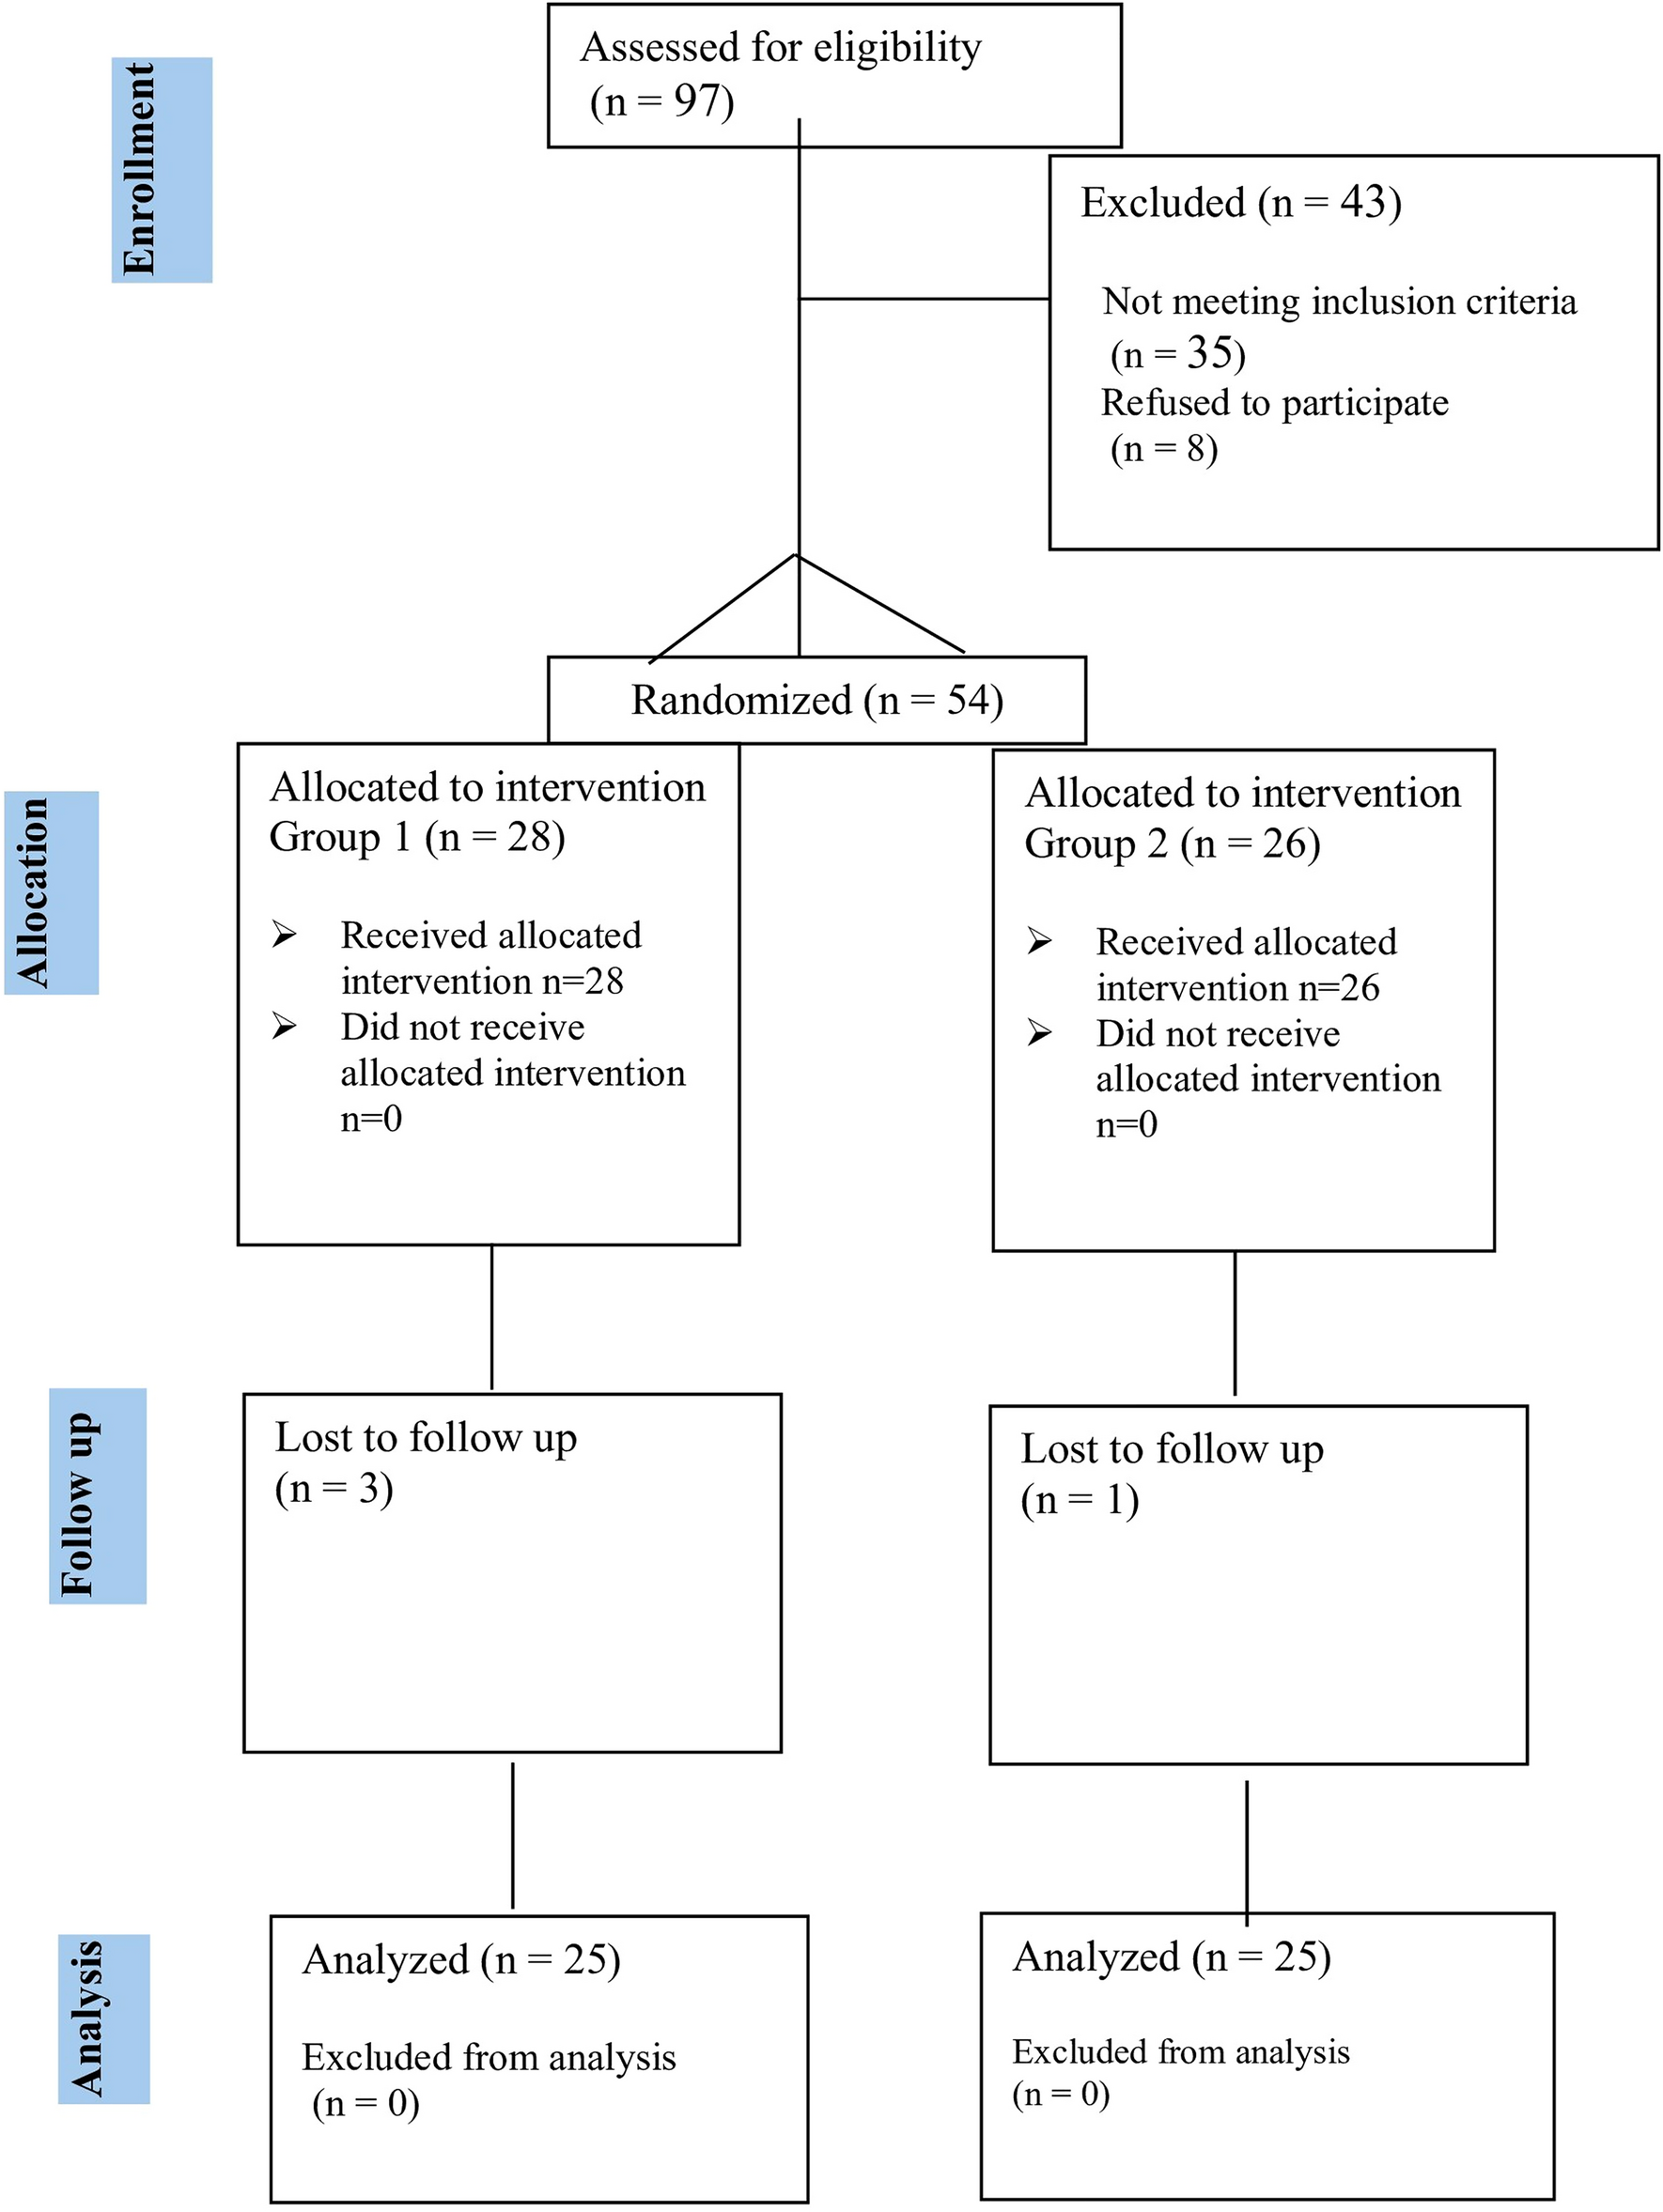
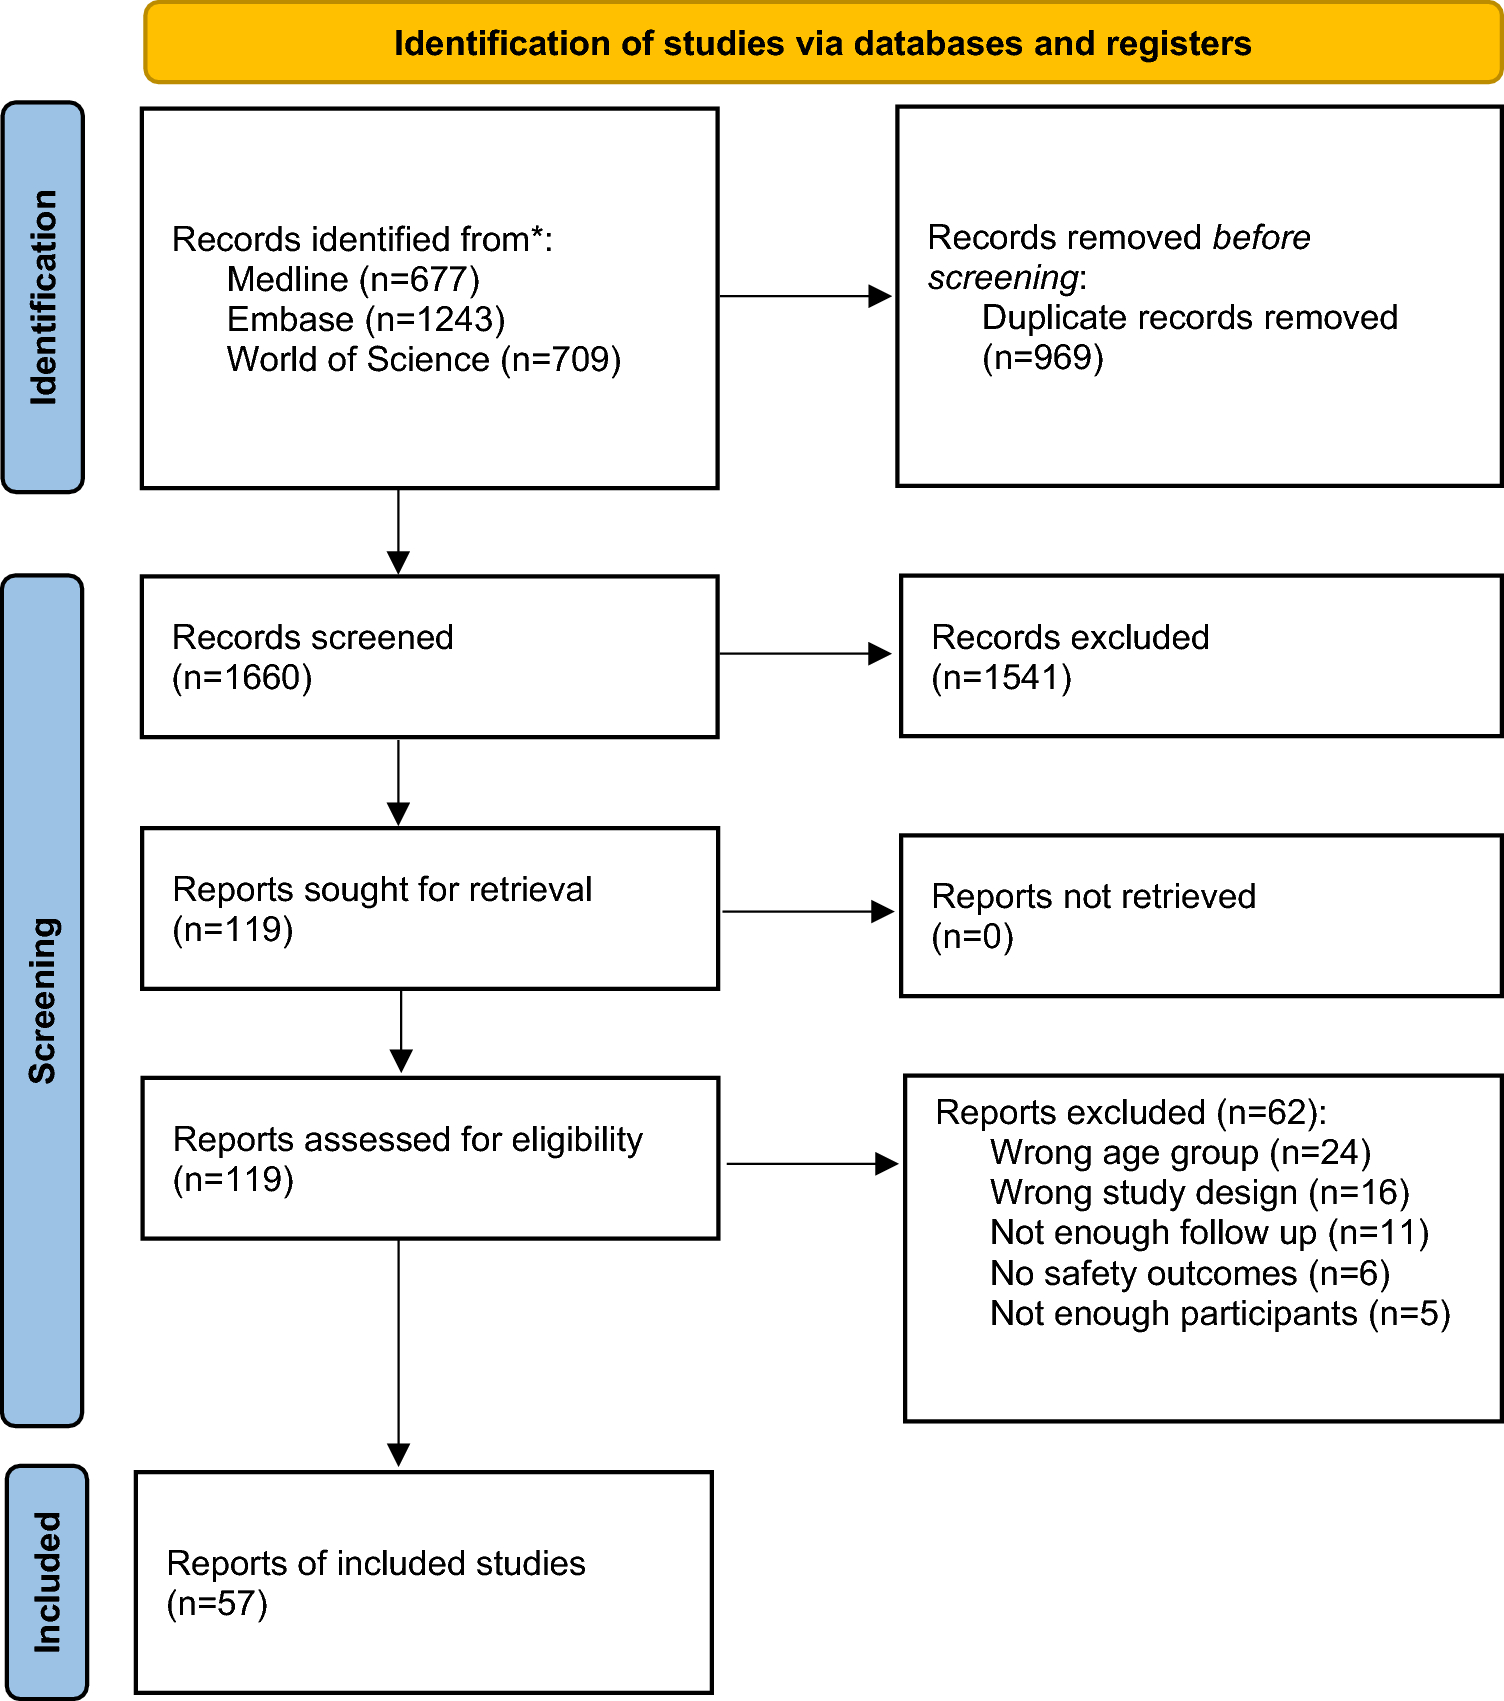
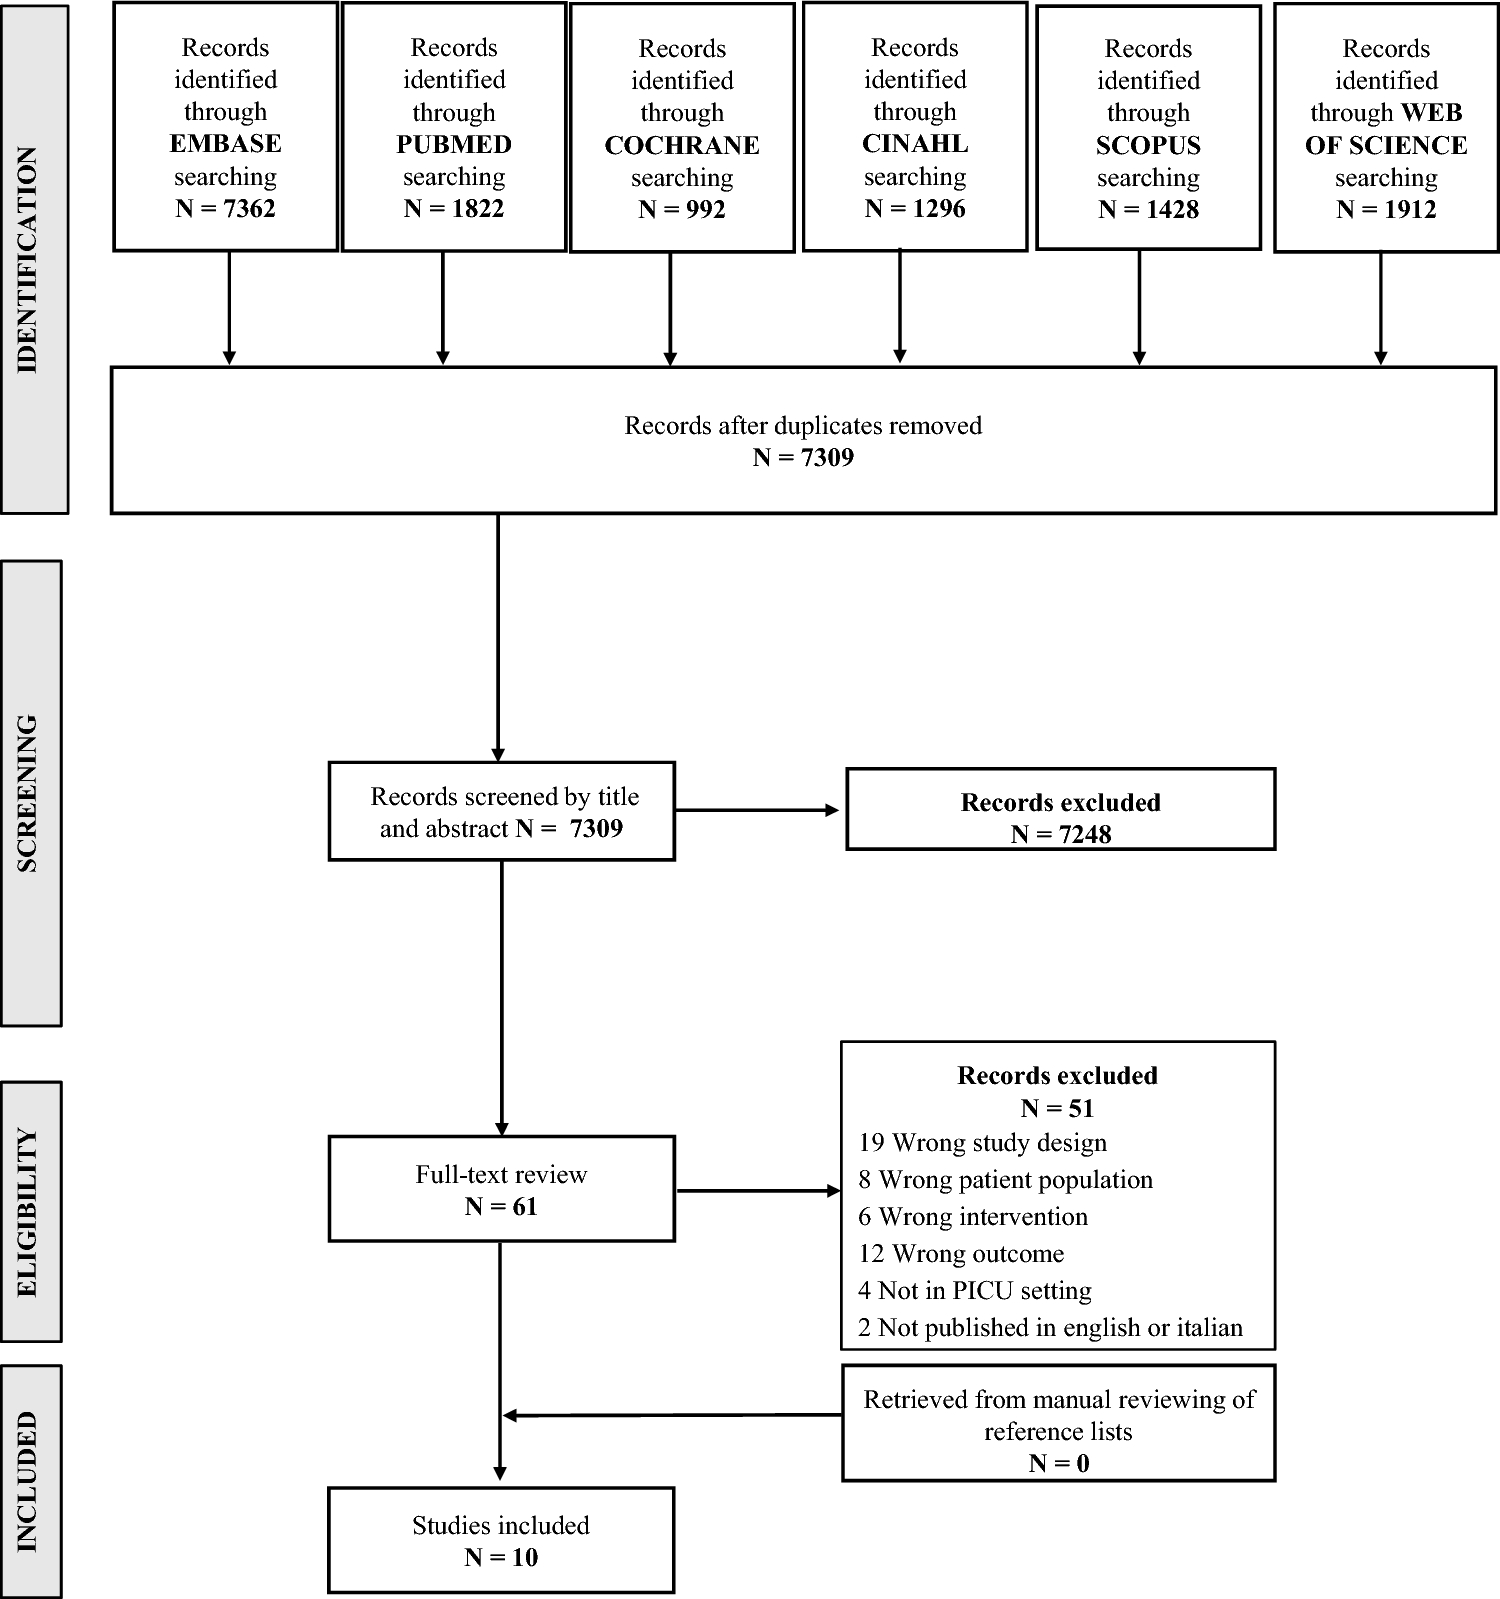
The electronic databases search identified a total of 103 references. Removing duplicated records left 58 articles, whose titles and abstracts were screened for relevance to our research question. This yielded 38 papers, for which full texts were retrieved and assessed for eligibility. Of these, 28 studies failed meet the eligibility criteria and were excluded, while four studies identified from citation searching were added. A total of 14 studies were finally included in the network meta-analysis, of which 10 were RCTs (two double-blind [25, 26], seven randomised but not double-blinded [27,28,29,30,31,32,33] and one randomised pilot study [34]), three were single-arm controlled trials [35,36,37] and one was a retrospective observational study [38] (see Table 1—Characteristics of included studies). One of the RCTs [31] was available only as an abstract. Another RCT [26] supplemented the data of a previous study [30]. The only study available with propranolol 0.1% eye micro-drops [35] was discontinued, so the data of this study were excluded from efficacy analyses. No results from unpublished clinical trials were found in the clinicaltrials.gov, trialsearch.who.int, or clinicaltrialsregister.eu registries. No other records from grey literature databases fulfilled the inclusion criteria. A PRISMA flow diagram summarises the search process and the selection results (Fig. 1—PRISMA flow chart).
Table 1 Characteristics of included studiesFig. 1
PRISMA flow chart of literature search and selection with numbers for included and excluded studies
This NMA included 474 propranolol-treated preterm infants. Our primary endpoint (stage progression of ROP) was reported in all included studies. The secondary outcomes (appearance of plus disease and need for anti-VEGFs or laser therapy) were reported by 7, 10 and 10 studies, respectively. Demographic data are displayed in Table 1.
3.2 Confidence in EvidenceThe quality of the included clinical trials and the observational study is assessed in ESM 3—Risk of bias. Three out of the ten RCTs included had a low risk of bias, six showed some concerns and one was considered high risk. The three non-randomised studies showed moderate risk of bias. The grading of paired comparisons in the network with the CINeMA approach showed low confidence across most estimates (see ESM 4—CINeMA grading), mainly due to the imprecision of most direct and indirect estimates. Assessment of heterogeneity showed a number with “some concerns”, while indirectness showed “no concerns”.
3.3 Network Meta-Analysis of Stage Progression of ROP as the Primary Outcome3.3.1 Bayesian AnalysisThe Bayesian network meta-analysis (Fig. 2) showed that oral propranolol 1.5 and 2.0 mg/kg/day had the lowest OR values, 0.15 (95% CrI 0.05–0.44) and 0.31 (95% CrI 0.09–0.99), respectively, statistically significant versus control, followed by propranolol 1.0 and 0.5 mg/kg/day with OR values approaching yet not reaching significance. The OR value for propranolol 0.2% eye micro-drops (144 μg/eye) was 0.35 (95% CrI 0.07–1.11), close to the OR values of oral propranolol but failing to reach statistical significance.
Fig. 2
Effects of propranolol on the stage progression of retinopathy of prematurity (ROP) as the primary outcome. The upper panels (a–d) correspond to effects of propranolol analysed without separation by stages of disease progression, and the lower panels (e–h) indicate results for separate analyses of propranolol given at earlier (stages 0 to 1) vs later stages (stages 2 and 3) of ROP. Panels a and e: Network plot. Number on the lines indicate the number of studies conducted for each comparison. Panels b and f: Forest plot depicting the effect estimates (odds ratio) for stage progression with the corresponding 95% credible intervals (95% CrI) for each treatment compared with placebo/control (Plc). Panels c and g: The Litmus Rank-O-Gram presents a cumulative rank-o-gram alongside a litmus strip of the Surface Under the Cumulative RAnking curve (SUCRA) values. Highest values and cumulative curves correspond to a better position in the ranking and are situated nearer the top. Panels d and h: Radial SUCRA plots. Size of the nodes represent number of patients and thickness of lines indicate number of studies conducted. Abbreviations for propranolol treatments: D_02: 0.2% eye micro-drops; O_05: oral 0.5 mg/kg/day; O_10: oral 1.0 mg/kg/day; O_15: oral 1.5 mg/kg/day; O_20: oral 2.0 mg/kg/day; S01_D_02: eye drops 0.2% given at stages 0–1; S01_O_10: oral 1.0 mg/kg/day given at stages 0–1; S01_O_15: oral 1.5 mg/kg/day given at stages 0–1; S01_O_20: oral 2.0 mg/kg/day given at stages 0–1; S23_D_02: eye drops 0.2% given at stages 2–3; S23_O_05: oral 0.5 mg/kg/day given at stages 2–3; S23_O_10: oral 1.0 mg/kg/day given at stages 2–3; S23_O_15: oral 1.5 mg/kg/day given at stages 2–3; S23_O_20: oral 2.0 mg/kg/day given at stages 2–3
3.3.2 SUCRA RankingConsistent with the data on the forest plot, the SUCRA values (Fig. 2) showed that oral propranolol 1.5 mg/kg/day ranks best followed by a cluster composed of oral propranolol 0.5 and 2 mg/kg/day and eye propranolol 0.2%, and in turn these appear somewhat better than oral propranolol 1 mg/kg/day.
3.3.3 Model FitThe computed measures of fit (Dbar 25.226, pD 22.161, DIC 47.387) indicate a good model performance in the Bayesian analysis. The UME residual deviance plots, stem and leverage plots are included in ESM 5: Model fit assessment and outlier detection. The goodness of fit is indicated by inspecting these plots, showing small residual deviance and good leverage.
3.3.4 Frequentist AnalysisThe Bayesian analysis was complemented with frequentist analysis, and the OR values for stage progression were found to be mostly comparable with those of Bayesian analysis with an OR of 0.42 (95% confidence interval [CI] 0.18–0.96) for ocular propranolol 0.2% reaching statistical significance. The forest plot and league table are provided in ESM 6: Frequentist NMA.
3.3.5 Propranolol at Early Versus Late StagesThe preceding analyses of the stage progression after different oral and ocular doses of propranolol did not differentiate between effects of propranolol given at early stages (stages 0 and 1; ‘S01’) of ROP compared with later stages (stages 2 and 3; ‘S23’) of disease progression. The lower row of panels in Fig. 2 shows the network plot and the results for Bayesian analysis of the effects of propranolol on the rate of stage progression with this segregation. There was a trend to obtain greater effect sizes for propranolol given at S23 in comparison to S01. Thus, the OR values for oral propranolol 1.5 and 2 mg/kg/day given at S23 were 0.13 (95% CrI 0.04–0.37) and 0.16 (95% CrI 0.04–0.61), respectively, while given at S01 were 0.28 (95% CrI 0.02–2.96) and 0.78 (95% CrI 0.14–4.43), respectively. A similar tendency was observed for eye propranolol 0.2% with an OR at S23 of 0.37 (95% CrI 0.09–1.00) versus an S01 OR value of 0.64 (95% CrI 0.21–2.04). The same general disposition was obtained with SUCRA plots in which best probability values were obtained for drug administration at S23 versus S01, particularly for oral propranolol 1.5 and 2.0 mg/kg/day, which ranked above the cluster conformed by oral propranolol 1.0 and 0.5 mg/kg/day and eye propranolol 0.2%. Oral propranolol 1.5 mg/kg/day at S01 ranked better than the other interventions at early stages. Computed measures of fit (Dbar 33.382, pD 29.914 and DIC 63.296) as well as the UME residual deviance plots, stem and leverage plots indicated a good model performance (ESM 5: Model fit assessment and outlier detection). Frequentist analysis displayed values comparable to those obtained for the Bayesian approach with eye propranolol 0.2% reaching significance at S23 (OR 0.50; 95% CI 0.28–0.89). The forest plot and league table are provided in ESM 6: Frequentist NMA.
3.4 Network Meta-Analysis of the ROP Progression to Plus Disease and the Need For Anti-VEGF Agents or Laser Therapy as Secondary OutcomesGiven the observed trend of differences in propranolol effects on stage progression when administered at earlier compared with later stages of ROP, the analyses for secondary outcomes were carried out following the same scheme, as displayed in Fig. 3.
Fig. 3
Effects of propranolol on the secondary outcomes. Upper (a–c), middle (d–f) and lower (g–i) panels correspond to analysis of plus disease appearance, need for treatment with an anti-VEGF agent, and requirement for laser therapy, respectively. Panels on the left side show the corresponding network plots; middle panels show forest plots with odds ratio and 95% credible intervals (CrI) compared with placebo/control (Plc); and panels on the right side show the Litmus Rank-O-Gram with a litmus strip of the Surface Under the Cumulative RAnking curve (SUCRA) values. Values nearer the top represent a better ranking position. Abbreviations for propranolol treatments: D_02: 0.2% eye micro-drops; O_05: oral 0.5 mg/kg/day; O_10: oral 1.0 mg/kg/day; O_15: oral 1.5 mg/kg/day; O_20: oral 2.0 mg/kg/day; S01_D_02: eye drops 0.2% given at stages 0–1; S01_O_10: oral 1.0 mg/kg/day given at stages 0–1; S01_O_15: oral 1.5 mg/kg/day given at stages 0–1; S01_O_20: oral 2.0 mg/kg/day given at stages 0–1; S23_D_02: eye drops 0.2% given at stages 2–3; S23_O_05: oral 0.5 mg/kg/day given at stages 2–3; S23_O_10: oral 1.0 mg/kg/day given at stages 2–3; S23_O_15: oral 1.5 mg/kg/day given at stages 2–3; S23_O_20: oral 2.0 mg/kg/day given at stages 2–3
3.4.1 Plus DiseaseResults for Bayesian analysis showed a significant beneficial effect only for oral propranolol 1.5 mg/kg/day (OR 0.14; 95% CrI 0.02–0.84) at S23. The same profile was obtained in the SUCRA ranking, in which the best probability value was obtained for 1.5 mg/kg/day of oral propranolol at S23. Computed measures of fit (Dbar 14.944; pD 14.521; DIC 29.465), UME residual deviance plots, stem and leverage plots indicated a good model performance (ESM 5: Model fit assessment and outlier detection). Frequentist analysis displayed OR values comparable to those obtained for the Bayesian approach, with significance confirmed for oral propranolol 1.5 mg/kg/day at S23 but also attained by 2.0 mg/kg/day of oral propranolol (OR 0.30; 95% CI 0.10–0.87) as well as by eye propranolol 0.2% (OR 0.43; 95% CI 0.23–0.80) at S23 (forest plot and league table are provided in ESM 6: Frequentist NMA).
3.4.2 Anti-VEGFA significant decrease in the need for anti-VEGF treatment was achieved for 1.5 mg/kg/day of oral propranolol (OR 0.23; 95% CrI 0.05–0.93) at S23. A cluster of good probability values was obtained in the SUCRA ranking for 1.5 and 2.0 mg/kg/day of oral propranolol at S23 along with oral propranolol 1.0 mg/kg/day at S01 followed by eye propranolol 0.2% at S23. Computed measures of fit (Dbar 15.615, pD 14.383, DIC 29.998), UME residual deviance plots, stem and leverage plots indicated a good model performance (ESM 5: Model fit assessment and outlier detection). Frequentist analysis displayed OR values comparable to those obtained for the Bayesian approach with significance confirmed for oral propranolol 1.5 mg/kg/day at S23, but no other intervention reached statistical significance (forest plot and league table are provided in ESM 6: Frequentist NMA).
3.4.3 LaserResults for Bayesian analysis showed no statistically significant differences among interventions. A cluster of good probability values was obtained in the SUCRA ranking for 0.5, 1.5 and 2.0 mg/kg/day of oral propranolol followed by eye propranolol 0.2%, all given at S23. Computed measures of fit (Dbar 24.972, pD 21.319, DIC 46.291), UME residual deviance plots, stem and leverage plots indicated a good model performance (ESM 5: Model fit assessment and outlier detection). Frequentist analysis displayed OR values comparable to those obtained for the Bayesian approach with significance attained for oral propranolol 1.5 (OR 0.19; 95% CI 0.05–0.72) and 2.0 (OR 0.25; 95% CI 0.10–0.65) mg/kg/day at S23 as well as for eye propranolol 0.2% at S23 (OR 0.41; 95% CI 0.20–0.86) with no other intervention reaching statistical significance (forest plot and league table are provided in ESM 6: Frequentist NMA).
3.5 Model-Based, Dose–Response, Network Meta-AnalysisGiven that the results obtained with oral propranolol in decreasing the risk of stage progression indicated a dose–response association, we further analysed the dose–effect relationship with the MBNMAdose software programme. This package was applied to the data obtained for the effects of the different doses of oral propranolol administered at early (S01) and late (S23) stages of ROP in reducing the rate for stage progression as the primary outcome. This dataset was selected since it is derived from all the studies included in this meta-analysis. This model-based, dose–response NMA was not carried out with data from ocular propranolol because efficacy information was limited to one dose point only.
Following the established procedure in this package, we first viewed a ‘split’ NMA in which each dose is examined as unrelated to each other, not assuming any dose–response association. This analysis showed that no studies were disconnected at the dose level with good model fit (pD 21.9, DIC 127.7). Next, the MBNMAdose was applied to calculate model predictions. Figure 4 shows the predicted dose–response function plotted with the observed data overlaid. The tighter 95% CrI on the predicted MBNNMA line indicates a reasonable modelling not yielding a poorer fit (pD 17.0, DIC 120.1) as required. Thus, the dose–response prediction plots exhibited nonlinearities with an apparent plateauing within the predicted variation in the exposure response. The predicted maximal effect for oral propranolol was greater when given at late stages (S23) compared with early (S01) stages administration with a difference in magnitude nearly reaching statistical significance (OR 0.16; 95% CrI 0.08–0.29 and OR 0.61; 95% CrI 0.26–1.34, respectively).
Fig. 4
Dose–response relationship for oral propranolol on the primary outcome (stage progression of retinopathy of prematurity [ROP]) plotted with the model-based, network meta-analysis (MBNMA) software programme. The upper panels represent the observed effects for the different doses of propranolol in reducing the rate of stage progression. The x-axis represents the dose (μg/kg/day) and the y-axis shows the effect size of the observed responses (odds ratio [OR] with 95% credible interval [CrI] as natural logarithm). Lower panels represent the dose–response prediction plots. The solid lines represent the mean predictions as a function of dose of oral propranolol. Shaded areas represent the 95% CrI. The embed points represent the mean observed values with their variation. Oral propranolol was administered at early (stages 0 and 1) and late (stages 2 and 3) stages of progression of ROP as indicated by the respective legends O-S01 and O-S23 at the upper part of each of the panels
3.6 Analysis of Adverse EventsSeveral of the included studies with oral propranolol recorded adverse events in the intervention and control cohorts [25,26,27,28, 30, 31, 34], while others reported no adverse effects [29, 32, 33, 38]. The adverse events disclosed in the oral propranolol arm comprised death, apnoea, increased ventilator need, bradycardia, hypotension, hypoglycaemia, bronchospasm, viral infection and insufficient weight gain. Some of these adverse events were also reported in the untreated arm. In the three studies with propranolol eye micro-drops [35,36,37], neither local nor severe adverse events related to propranolol were observed. Since OR values are not quantifiable where there are zero adverse events, risk differences (RD) were calculated instead to enable comparative intervention effect estimates for all studies, thus including the largest possible dataset as shown in the network plot (Fig. 5). The forest plot shows that only eye propranolol 0.2% and oral propranolol 0.5 mg/kg/day had no risk difference with respect to control while positive differences were obtained for higher doses of oral propranolol versus control, with the highest risk difference found for 2.0 mg/kg/day (RD 0.06; 95% CI −0.01 to 0.13). Nevertheless, these values failed to reach statistical significance. The corresponding league table is shown in ESM 6.
Fig. 5
Risk differences for adverse events after propranolol. Left panel: Network plot of included studies. Right panel: Frequentist forest plot showing pairwise risk differences versus placebo/control (Plc) for total counts of adverse events. Effect estimates are shown with their 95% confidence intervals (95% CI)
Comments (0)