
Remember me


Two bone pieces were studied: ribs (n = 5) and tibia (n = 5) at a late PMI of 15 (PMI15) and 20 years (PMI20), as detailed in Table 1. Additionally, we included an early PMI of < 1 year (PMI1) using only rib fragments acquired from male cadaveric donors (n = 5). Proteins were extracted from 100 mg cortical bone powder following an in-house standardized protocol that allowed us to maximize the protein yield for bone proteomics (see “Methods”). Ribs samples showed on average 1.13 ± 0.15 mg (PMI1), 0.63 ± 0.07 mg (PMI15), and 0.82 ± 0.29 mg (PMI20) of total extracted protein. Tibia samples yielded 0.72 ± 0.07 mg (PMI15) and 0.78 ± 0.17 mg (PMI20). The amount of total protein obtained highlights the difficulty of protein extraction from bone tissue and pinpoints that late PMIs yield less amounts of extracted proteins.
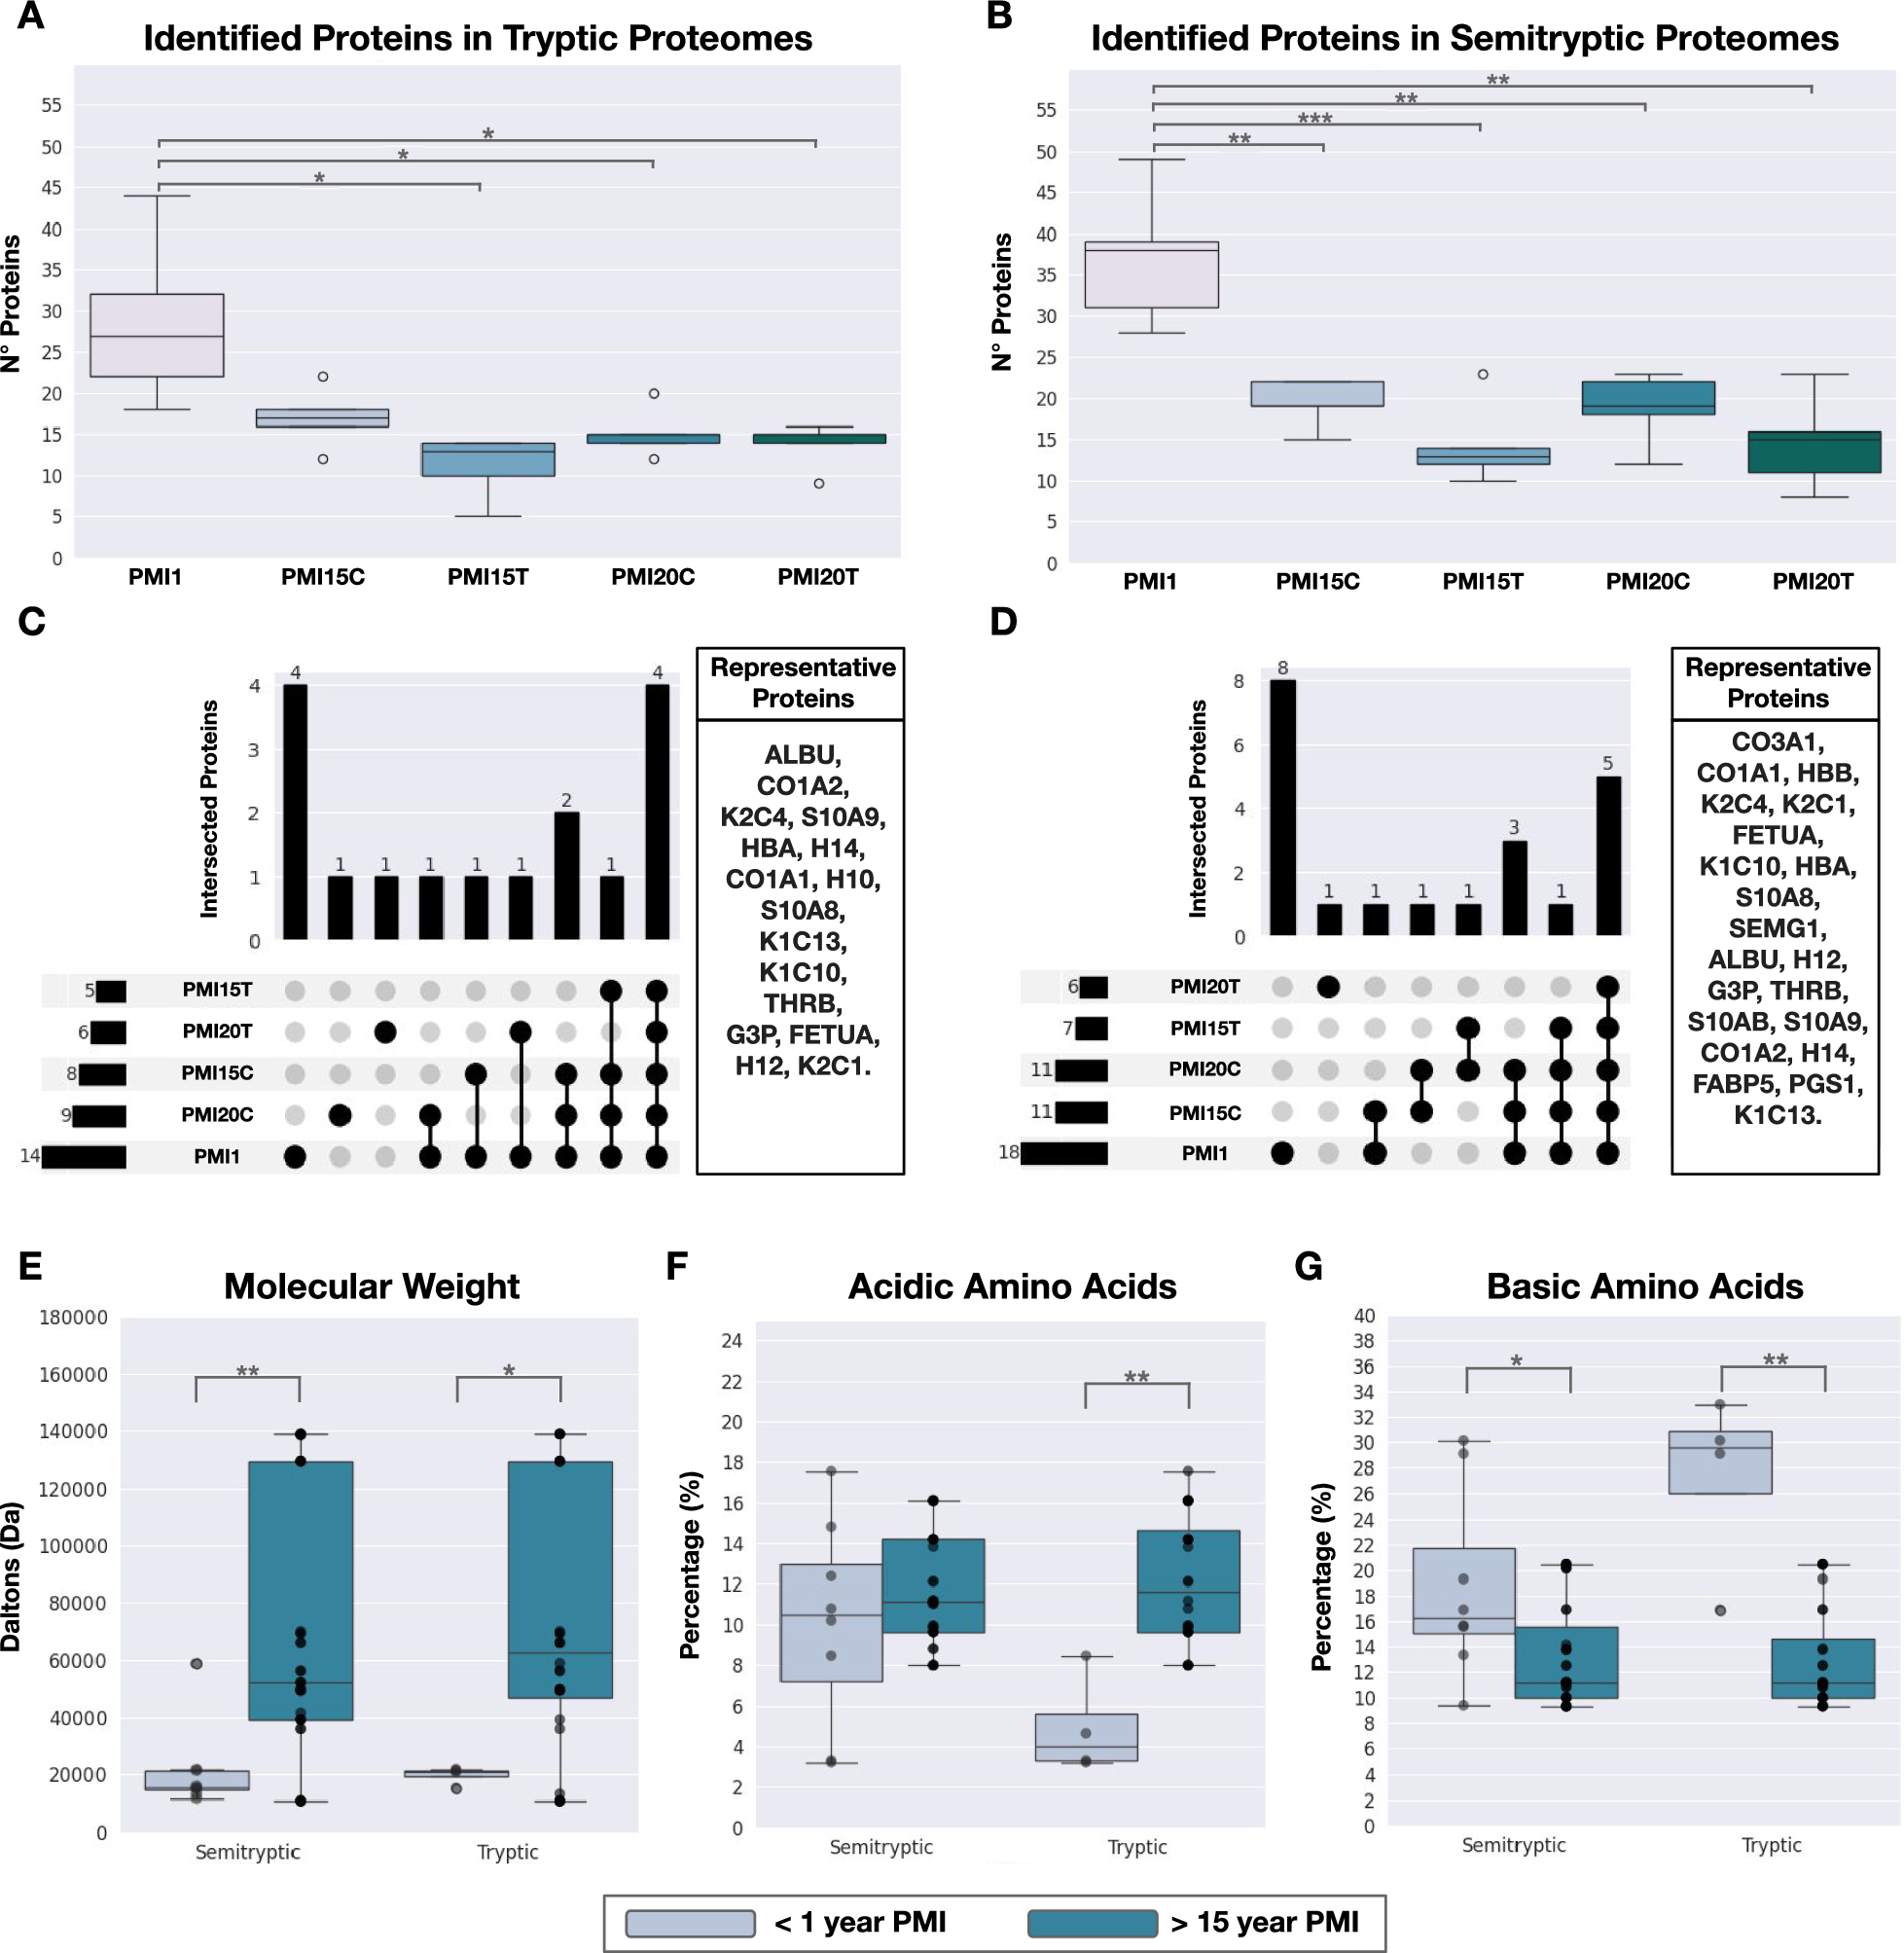
Table 1 Detailed list and description of bone samples collected for the studyProteome characterization of ribs and tibia remainsSamples were profiled using LC–MS/MS, and the proteome of each sample identified through bioinformatics analysis. The protein identification was carried out using two approaches; (i) a trypsin-specific search, commonly employed in proteomics, generating a proteome referred to as “tryptic proteins or proteome”, and (ii) a nonspecific search, generating a proteome referred to as “semitryptic proteins or proteome”. The semitryptic search was included in our study to account for the expected natural protein degradation in the samples, as the tryptic search could result in the loss of information and bias in abundance estimation. Protein abundances were calculated separately for both tryptic and semitryptic proteins. No significant differences were observed in the total number of proteins identified per PMI between tryptic and semitryptic proteome (Supplementary Table 1). However, early PMIs exhibited a statistically greater number of proteins compared to late PMIs within the same proteome type (Supplementary Tables 2 and 3). As shown in Fig. 1A, for tryptic proteomes, we identified a median of 27 proteins in PMI1, 17 proteins in PMI15 rib (PMI15C), 13 proteins in PMI15 tibia (PMI15T), 15 proteins in PMI20 rib (PMI20C), and 15 proteins in PMI20 tibia (PMI20T). Similar results were observed for identified proteins in semitryptic proteomes (Fig. 1B). To ensure analytical consistency, we established the proteome of each condition as the set of proteins consistently identified across all five biological replicates. Through this approach of consistency filtering, the tryptic proteomes comprised 14 proteins in PMI1, 8 proteins in PMI15 rib (PMI15C), 5 proteins in PMI15 tibia (PMI15T), 9 proteins in PMI20 rib (PMI20C), and 6 proteins in PMI20 tibia (PMI20T) as listed in Supplementary Table 4. Similarly, the semitryptic proteomes included 18 proteins in PMI1, 11 proteins in PMI15C, 7 proteins in PMI15T, 11 proteins in PMI20C, and 6 proteins in PMI20T, detailed in Supplementary Table 5. The proteome analysis among PMIs revealed that most proteins are shared between two or more PMIs (Fig. 1C, D). Specifically, only 4 and 8 proteins were uniquely identified in PMI1 for tryptic and semitryptic proteins, respectively.
Fig. 1
Characterization of proteomes in bone remains. A Protein identification using tryptic search. B Protein identification using semitryptic search. C Comparison of proteomes by PMI and bone segments for proteins identified through tryptic search. D Comparison of proteomes by PMI and bone segments for proteins identified through semitryptic search. E In silico characterization of molecular weight distribution between PMI < 1 year and PMI > 15 years. F Percentage of acidic amino acids in proteins from PMI < 1 year and PMI > 15 years. G Percentage of basic amino acids in proteins from PMI < 1 year and PMI > 15 years
To explore whether tryptic and semitryptic proteomes exhibit significant differences, we defined a set of “representative proteins” that included all proteins identified by either tryptic or semitryptic searches across all PMI samples (Fig. 1C, D). A total of 16 representative proteins were identified using tryptic peptides, while 21 were identified using semitryptic peptides. These representative proteins included plasma proteins (ALBU, THRB, FETUA), hemoglobin (HBA, HBB), several collagens and collagen-related proteins (COL1A1, COL1A2, COL3A1, PGS1), keratins (K2C4, K1C10, K1C13), and bone matrix-related proteins (SEMG1, S10AB, S10A9), confirming the bone-specific signature of the obtained proteomes.
Recent hypotheses suggest that proteins persisting in late PMIs (> 12 years) often display higher molecular weights and are enriched in acidic amino acids [21]. To investigate this, we grouped proteomes by early (PMI1) and late PMI stages (PMI15 and PMI20), subtracting proteins present in late PMIs from the early set. Biochemical parameters, such as molecular weight and amino acid composition (acidic and basic), were analyzed (Fig. 1E–G). We observed that proteins in late PMIs, indeed, displayed higher molecular weights (Fig. 1E and Supplementary Table 6) and showed significant enrichment in acidic amino acids (Fig. 1F and Supplementary Table 7). Conversely, the early PMI proteome, identified by both peptide types, was enriched in basic amino acids (Fig. 1G and Supplementary Table 8).
These findings collectively demonstrate that our bone proteomes exhibit distinct identities and biochemical properties dependent on PMI. This led us to question whether these properties could be predictive of PMI in skeletal remains.
Unveiling global proteomic patterns describing tibia and rib remainsIn our quest to elucidate global patterns within proteomic abundance that could potentially inform the PMI, Principal Component Analysis (PCA) was employed as an analytical tool. This statistical method facilitated the effective visualization of major sources of variation within the data, conducted without prior assumptions about sample identity (unsupervised learning). These analyses were coupled with clustering analysis using K-means algorithm for enhancing visualization of sample aggregation through the principal components (PC) as shown in Fig. 2. Our results indicated that protein abundance, calculated based on both tryptic and semitryptic peptides, give rise to similar aggregation and clustering results (Fig. 2A, B). Notably, more than 70% of the variability is explained by the first three principal components (PC1, PC2 and PC3), with PC1 accounting for 48% of the variation, thereby driving the most significant source of variability among samples (Supplementary Table 9 and 10). Surprisingly, we observed that samples do not aggregate by PMI values; instead, it is the type of bone piece (tibia or rib) that drives the clustering (Fig. 2A, B, PC1 in both plots). In both scenarios, PMI1 disaggregates from late PMI ribs, indicating a distinct proteomic pattern. Subsequently, we assessed the variable’s loadings to understand the extent to which each protein influences the observed clustering (Fig. 2C, D). We found that collagen-related proteins (CO1A1, CO1A2, CO3A1, and PGS1) and the plasma protein THRB influence late PMI bone piece aggregation. In contrast, keratins (K2C1, K1C10, K1C13, K2C4), histones (H14, H10, H12), hemoglobins (HBA, HBB), G3P, and bone matrix-related proteins (SEMG1, S10AB, S10A9) are characteristic of early PMI proteomes. Concurrently, we also performed multiple correspondence analysis (MCA) to evaluate whether proteome diversity (presence or absence of proteins) could inform PMI, but this approach did not yield conclusive results (Supplementary Figure 1). These findings suggest that late PMI stages cannot be directly distinguished by PCA, as the bone type has a greater influence on the proteome than the differences in PMI do (15 and 20 years). Additionally, analysis of protein loadings helps to differentiate between early and late PMI stages, although it does not provide insights into specific differences within late PMIs. Based on these insights, we decided to apply ML modeling as an alternative approach to integrate and learn about intrinsic differences between PMI15 and PMI20, which may allow us to distinguish PMI within a 5-year range.
Fig. 2
Global visualization of proteomes through principal component analysis. A Three-dimensional visualization of the first three principal components for proteins identified through tryptic search. B Three-dimensional visualization of the first three principal components for proteins identified through semitryptic search. C Variable loadings for the tryptic search. D Variable loadings for the semitryptic search
Machine learning supervised training to accurately predict PMIWe opted for a Random Forest model, an ensemble of decision trees, as our aim was to predict PMI categories. Random Forest is recognized as a robust model for small datasets due to its ability to prevent overfitting by combining multiple decision trees, each built on different subsets of data and variables.
Initially, we focused on modeling late PMI for each bone type—rib and tibia, independently—with the goal of training a model capable of discerning differences within a 5-year PMI range and identifying critical proteins for classification. Once the model was trained and crucial parameters were established (refer to Methods section), we conducted 100 iterations, resampling the training and test sets each time. This process ensured that all samples were included in each set at least once and allowed us to evaluate the model’s consistency across different datasets. These iterations were critical for detecting potential overfitting, as significant variations in performance metrics such as accuracy and F1-score between training and test sets indicated the model’s inability to generalize beyond the training data.
Initial modeling with abundance of full set representative proteins consistently showed better performance for semitryptic proteins in tibia samples (Fig. 3A) compared to tryptic peptides across iterations (Supplementary Figure 2). However, model accuracy oscillated between 100 and 50%, with even lower F1-scores in some iterations (Fig. 3A).
Fig. 3
Model optimization via variable screening for tibia late PMI using semitryptic proteins. A Initial model performance using the identified hyperparameters and the complete set of representative proteins. B Importance score for full set of proteins in model A. C Model performance after selecting 11 proteins with an importance score greater than 4%. Proteins were then iteratively removed based on their SHAP values. D SHAP value distributions for the most important proteins contributing to the classification of PMI 15. E SHAP value distributions for the most important proteins contributing to the classification of PMI 20. F Final model performance after reducing the set to three key proteins: PGS1, K1C13, and CO3A1
Subsequently, to enhance the model’s performance, we opted to eliminate proteins (referred to as “variables”) that were not informative for the model’s training. Random Forest provides a measure of how informative each protein is through the “importance score”. Additionally, we assessed the contribution of each protein to the model’s output by calculating SHAP values. An iterative selection of the most informative proteins was conducted based on their importance scores and SHAP values. This combined approach enabled the elimination of uninformative or noisy variables, while simultaneously identifying key proteins that contribute to PMI prediction, which aligns with one of the objectives of our study—identifying potential biomarkers for this task.
For the supervised variable screening, the average importance score was calculated from the 100 iterations performed with the full set of representative proteins. As shown in Fig. 3B, for semitryptic proteins from tibia proteomes, the proteins PGS1, K1C13, K2C1, FETUA, CO3A1, S10A8, SEMG1, THRB, CO1A1, CO1A2, and K2C4 displayed importance scores greater than 4%. These eleven proteins were selected for model retraining; however, performance did not improve (Fig. 3C). SHAP distributions for this protein set were plotted for each PMI (Fig. 3D, E). Proteins were then gradually eliminated based on their SHAP values, and model performance was evaluated at each step (Supplementary Figure 3), until optimal and sustained accuracy and F1-scores were achieved with the minimal set of proteins. The supervised variable screening successfully improved the model’s performance, resulting in a consistent accuracy and F1-score of 100% across all iterations (Fig. 3F). The minimal set of proteins sufficient to classify samples from 15- and 20-year PMI was found to be PGS1, K1C13, and CO3A1.
Interestingly, the refinement process using tryptic proteins did not lead to steady improvements in model performance (Supplementary Figure 2). These findings suggest that, in a forensic context, protein abundance estimated from the semitryptic search more accurately reflects bone decomposition than abundance obtained through tryptic search.
Similarly, rib samples modeling consistently demonstrated poor performance for both tryptic proteomes (Supplementary Figure 4) and semitryptic proteomes (Supplementary Figure 5). These findings led to the exclusion of late PMI rib data and tibia tryptic peptides from downstream analysis. At the same time, these results demonstrate that tibia bone and semitryptic protein abundance seems to be reliable predictors for late PMI.
Subsequently, we integrated PMI1 samples into the late PMI tibia modeling to assess the stability performance with an additional PMI category. The model maintained 100% accuracy across iterations, effectively predicting PMI using semitryptic abundances of K1C13, PGS1, and CO3A1 (Fig. 4A, B). Thus, these three proteins constitute potential biomarkers for PMI prediction.
Fig. 4
Potential protein biomarkers for distinguishing Early and Late PMI. A Prediction performance using proteins K1C13, CO3A1, and PGS1 to classify PMI < 1 year, PMI 15 years, and PMI 20 years. B Importance score for the model in A. C–E Distribution of SHAP values for the three protein biomarkers across 100 iterations for rib samples with PMI < 1 year (C), tibia samples with PMI 15 years (D), and tibia samples with PMI 20 years (E). F–H Semitryptic protein abundance (intensity) for K1C13, CO3A1, and PGS1 across 100 iterations for rib samples with PMI < 1 year (F), tibia samples with PMI 15 years (G), and tibia samples with PMI 20 years (H)
To further explore how the model has learned to differentiate PMIs based on the expression patterns of the critical proteins—K1C13, PGS1, and CO3A1—we analyzed the distribution of SHAP values across the 100 iterations of our final model for these potential biomarkers (Fig. 4C–E). At this point, the SHAP values reflect the contribution of each protein’s abundance to the model’s classification decisions. For instance, K1C13 and CO3A1 show a greater contribution to the classification of PMI1 (Fig. 4C). In contrast, PMI15 classification integrates expression pattern of K1C13, CO3A1, and—to a slightly lesser extent—PGS1 (Fig. 4D). Meanwhile, for PMI20, only K1C13 and PGS1 are critical (Fig. 4E). The semitryptic abundances of these proteins across the different PMIs are provided in Fig. 4F–H, illustrating the specific expression patterns that the model relies on for accurate classification. This analysis clarifies the quantitative shifts in protein abundance required for the model to differentiate between PMI categories, further supporting K1C13, CO3A1, and PGS1 as potential biomarkers for PMI estimation.
Comments (0)