Patients and plasma samples
This study included five patients with mCRC, five patients with CRC, and five healthy individuals assessed at a tertiary hospital in Xinjiang between May 2023 and March 2024. The inclusion criteria required all participants with cancer to have a pathological diagnosis, with mCRC patients having stage IV disease and CRC patients having stage III disease. The patients had not undergone prior tumor-related radiotherapy or chemotherapy. The exclusion criteria were patients with other malignant tumors; other intestinal diseases; heart, liver, or kidney dysfunction; autoimmune diseases; blood diseases; or incomplete clinical data. Venous blood samples were collected from fasting participants, with 8–10 mL drawn and centrifuged at 3000×g in a high-capacity high-speed benchtop freezer centrifuge (CHT210R, China) for 10 min at 4 °C to obtain supernatant, which was stored at − 80 °C. The study received approval from the hospital ethics committee, and participants provided informed consent.
Isolation and extraction of plasma exosomes
Plasma samples were centrifuged at 4 ℃, 2000×g for 10min, and the supernatant was extracted and centrifuged at 4 ℃, 10,000×g for 30 min.The supernatant was extracted, and samples were transferred to ultra-high-speed centrifuge tubes, centrifuged at 4 ℃, 110,000× for 75 min (Optiam™ L-90k Ultracentrifuge, Beckman Coulter), and the supernatant was discarded. The precipitates were resuspended in 1 mL 1 × PBS, and each of the precipitates was diluted with 1 × PBS after resuspension and filtered through a 0.22-µm-pore membrane. The samples were transferred to ultra-high-speed centrifuge tubes, centrifuged at 4 ℃, 110,000×g for 75 min and the supernatant discarded. The precipitate was resuspended in 1 × PBS and stored at − 80 °C.
Nanoparticle tracking analysis (NTA)
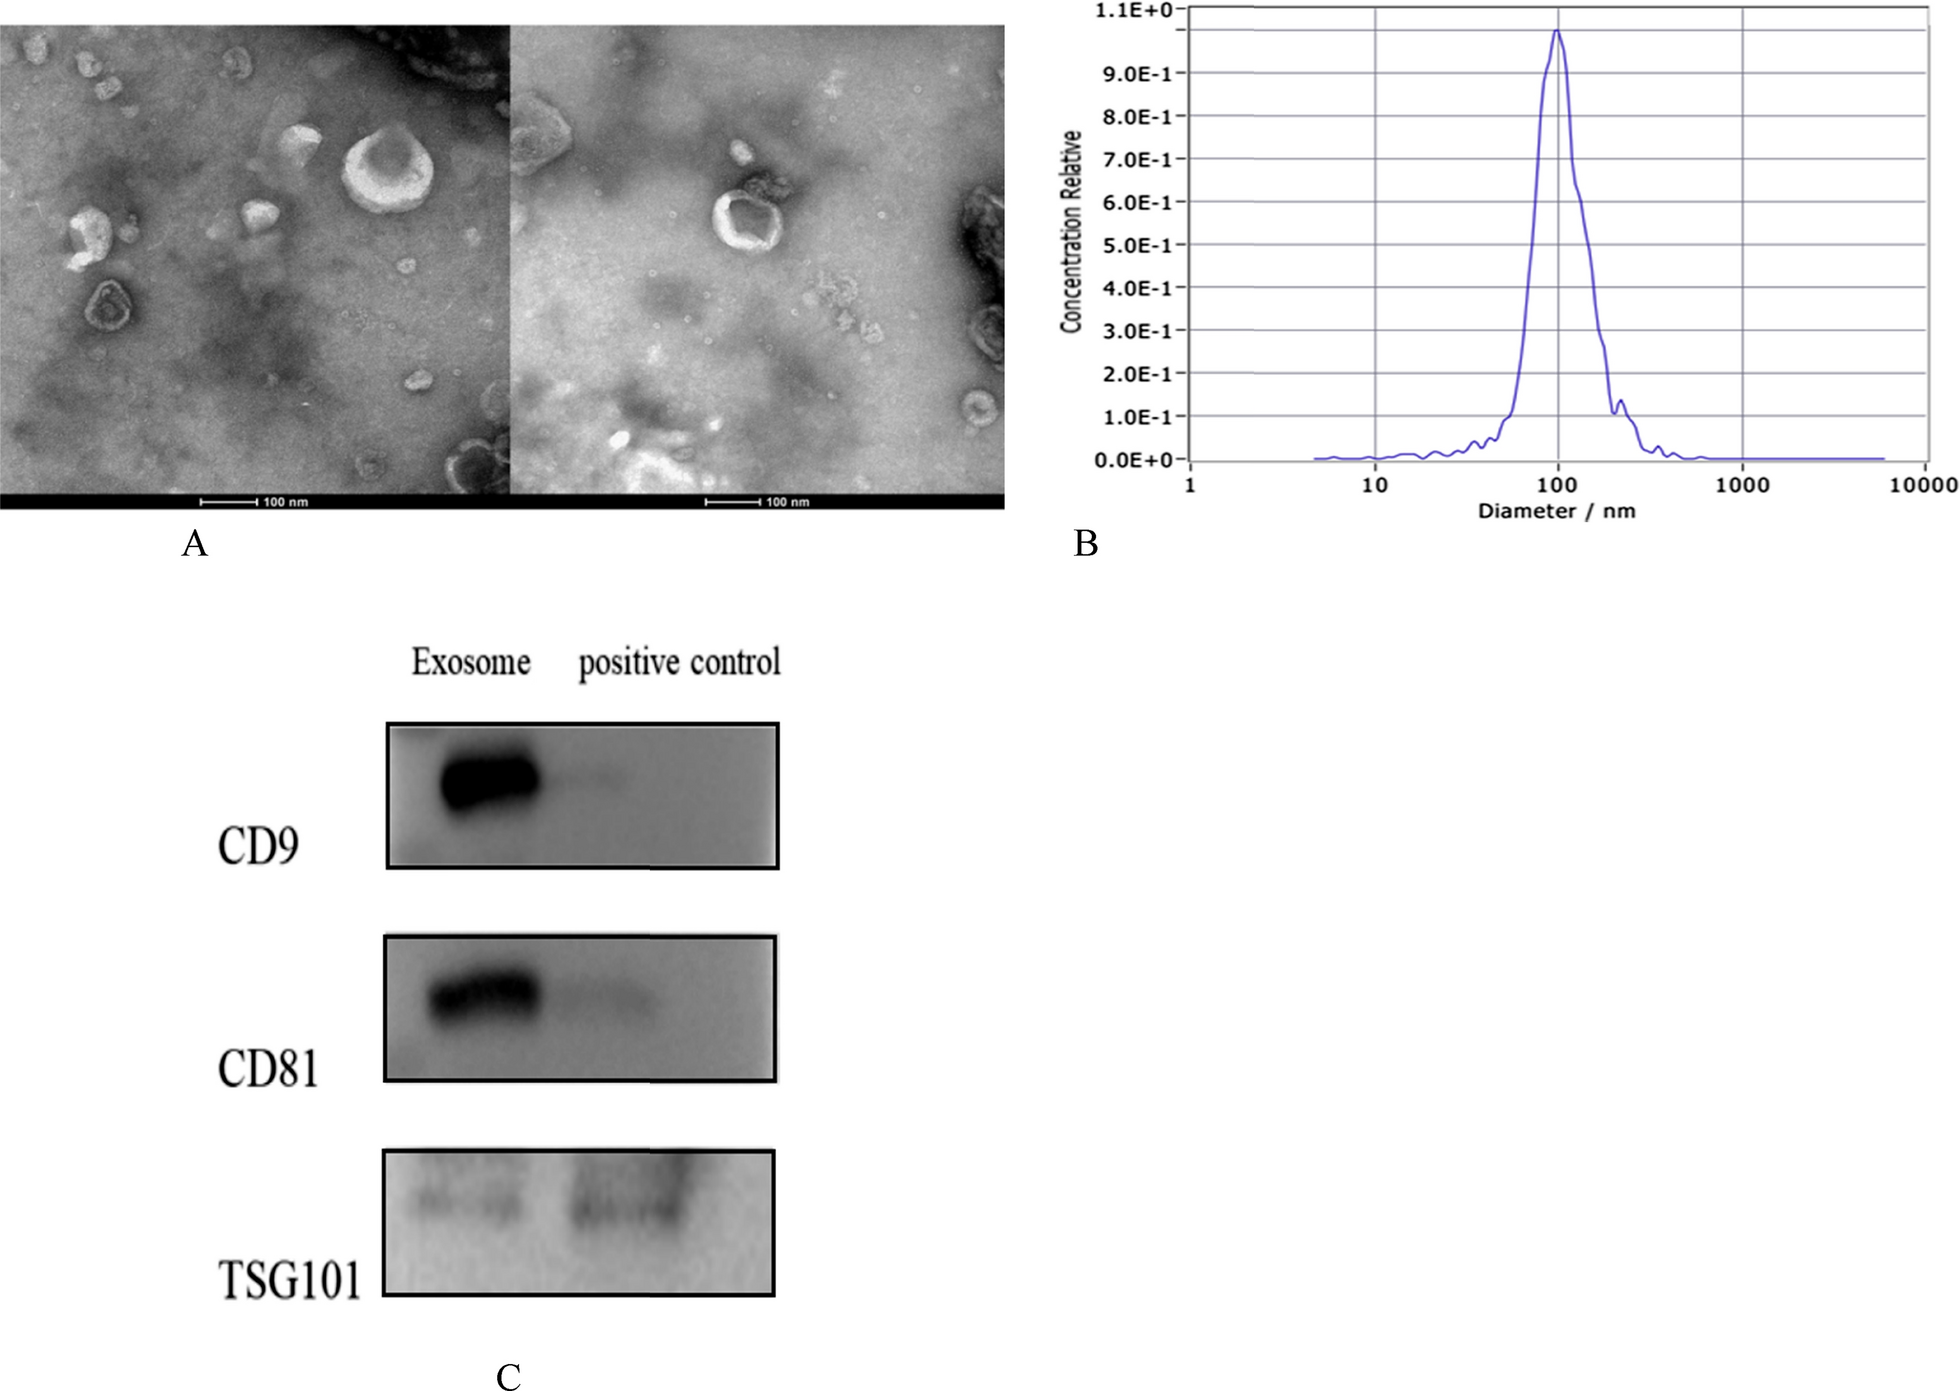
The size distribution of plasma exosomes was analyzed using a ZetaVIEW S/N 17-310 instrument (PARTICLE METRIX, Germany) equipped with nanoparticle tracking software (ZetaView 8. 04. 02). Frozen samples were thawed in a 25 °C water bath and placed on ice. Exosome samples were diluted in 1 × PBS for nanoparticle tracking analysis (NTA).
Transmission electron microscopy (TEM)
A 5 µL exosome sample was taken and applied to a copper grid, followed by a 5-min incubation at room temperature. After incubation, excess liquid was removed using absorbent paper. Subsequently, a drop of 2% hydrogen peroxide acetate was added to the copper grid and incubated at room temperature for 1 min. Again, excess liquid was removed using absorbent paper. The grid was then left to dry at room temperature for ~ 20 min before observation and imaging under a Tecnai G2 Spirit BioTwin electron microscope (FEI, USA).
Western blot analysis (WB)
To separate proteins based on molecular weight, a 1.5-mm glass plate and 15-well sample comb were used to create a separation gel and stacking gel. Electrophoresis was performed at a stable voltage of 80 V until the loading buffer entered the separation gel, then switched to 120 V until the loading buffer reached the bottom of the gel. The process was then terminated. For transfer, PVDF membranes with pore sizes of 0.22 µm and 0.45 µm were chosen, and a constant current of 200 mA was applied for 90 min. Blocking was achieved by adding 5% skim milk powder diluted in PBST, followed by 1-h blocking and a 30-min wash with PBST. The membrane was then incubated with primary antibodies, namely anti-CD9 antibody (EXOAB-CD9A-1; SBI, USA; 1:1,000), anti-CD81 antibody (YT5394; Immunoway, USA; 1:500), anti-TSG101 antibody (EXOAB-TSG101-1; SBI; 1:1000), anti-calnexin antibody (Immunoway), anti-integrin alpha 4 antibody (AB81280; Abcam, UK; 1:2000), and anti-GNAI1 antibody (AB140125; Abcam; 1:8000). After overnight incubation at 4 °C, the membrane was incubated with exosome-validated HRP-conjugated goat anti-rabbit secondary antibody (180202-001; SBI; 1:20,000). Following washing steps with PBST, ECL luminescent solution was added, and imaging was performed using a Tanon 5200 fully automatic chemiluminescence image analysis system (Tanon, Shanghai, China).
Exosome protein extraction and sample preparation
A specified volume of exosome suspension in PBS was combined with an equal volume of RIPA lysis buffer for protein extraction. The mixture was shaken and lysed at 4 °C for 30 min, with periodic shaking every 10 min. Following this, the lysate was centrifuged at 13,200 rpm at 4 °C for 15 min, and the supernatant was transferred to a new tube for protein quantification using the BCA protein assay reagent kit (Beyotime, China). After determining the protein concentration, 50 µg of protein solution was removed, and the lysate volume adjusted accordingly. Dithiothreitol (DTT) was added to achieve a final concentration of 10 mM, and the solution was mixed and incubated at 37 °C for 1 h. Indole acetic acid (IAA) was then added at a volume ratio of DTT:IAA = 1:5, thoroughly mixed, and incubated in the dark for 40 min. Subsequently, the solution was precipitated with five times the volume of precipitation reagent for 1 h, followed by centrifugation at 13,000 rpm, 4 °C for 1 h, and removal of the supernatant. The precipitate was washed with 1 mL of 100% acetone, centrifuged at 13,000 rpm for 30 min, and the process was repeated. The dried precipitate was then subjected to trypsin digestion overnight at 37 °C. The resulting peptides were concentrated by centrifugation, desalted using a Monospin column, and dried prior to mass spectrometry analysis. The dried mixed peptides were dissolved in 0.1% trifluoroacetic acid (TFA) solution. The desalting column was activated with 100% acetonitrile and balanced with 0.1% TFA solution. The sample was added to the desalting column, centrifuged, washed with 0.1% TFA solution, and eluted with 50% acetonitrile solution. The eluted solution was collected in a new tube, centrifuged, concentrated, and dried to remove the acetonitrile.
Liquid chromatography–mass spectrometry (LC–MS) analysis
LC–MS analysis was conducted using a nanoflow UPLC system (Brucker, Germany), specifically the Brucker NanoElute, for chromatographic separation. The buffers consisted of a 0.1% formic acid aqueous solution for solution A and a 0.1% formic acid acetonitrile solution for solution B. Prior to loading the sample, the column was equilibrated with 100% solution A. The sample was then loaded onto an analytical column (Aurora UPLC Column, C18 1.6 μm, 250 mm × 75 μm) using an automatic injector for separation with a flow rate of 300 nL/min. The liquid phase separation gradient proceeded as follows: from 0 to 45 min, there was a linear gradient of 2% to 22% liquid B; from 45 to 50 min, the gradient was increased from 22 to 35%; from 50 to 55 min, it was further increased from 35 to 80%; and from 55 to 60 min, the gradient was maintained at 80% liquid B. The samples separated by nanoliter high-performance liquid chromatography were then analyzed using DDA mass spectrometry with a timsTOF Pro mass spectrometer (Brucker). The analysis lasted 60 min, and the detection mode employed was positive ion. The first level mass spectrometry scan range was utilized, with 100–1700 m/z, 1/K0 start: 0.75 Vs/cm2, 1/K0 end: 1.40 Vs/cm2; intensity threshold: 5000.00; absolute threshold: 10; target intensity: 10,000 cts/s; release after: 0.50 min; no. of PASEF MS/MS scans: 10.
Bioinformatics analysis
Proteins were analyzed for significant differences in expression. Then, the clustering of differential proteins, Gene Ontology (GO, https://www.geneontology.org/) enrichment, Kyoto Encyclopedia of Genes and Genomes (KEGG, https://www.kegg.jp/kegg/pathway.html) pathway enrichment, and protein–protein interaction networks (PPI network, STRING database, https://string-db.org/) were analyzed.
Statistical analysis
When comparing two groups, the mean value of all sample signals within each group was calculated to ascertain the fold-change in intergroup ratio, and the p-value of the difference between the two groups was calculated using Student’s t test. Proteins that met the following two conditions were assigned as being differentially expressed between groups: (1) a fold-change in intergroup ratio ≥ 1.2 or ≤ 1/1.2; (2) a p-value < 0.05. The exosomal ITGA4 and GNAI1 levels in mCRC patients, CRC patients, and healthy controls were compared using a one-way analysis of variance using GraphPad Prism 7 software. A two-sided p < 0.05 was defined as indicating a statistically significant difference.


Comments (0)