Tumor specimens
In this manuscript we use ‘Black’ to refer to non-Hispanic Black or African American individuals and ‘White’ to refer to non-Hispanic White (NHW) individuals. Frozen HGSOC tumors from Black (n = 35) and White (n = 31) consenting patients were collected from the biorepositories of four academic medical centers, Northwestern Medicine or partner institutions (University of Chicago, Indiana University, University of North Carolina) and the biorepository of the NRG Oncology. Nucleic acids extracted from these specimens were used for RNA-Seq, methylation analyses and RT-PCR verification. The race of all participants was self-reported. Eligibility for the study included high grade serous histology and stage III/IV ovarian cancer. All patients were women, age was not an exclusion factor. Patients’ characteristics are in Supplementary Table 1. A tissue microarray (TMA) was constructed in the Northwestern University Pathology Core using HGSOC paraffin-embedded tumor cores from 10 Black and 22 White patients; each tumor being represented in duplicate. Patients’ characteristics are in Supplementary Table 6. Additional paraffin-embedded HGSOC tumor slides from 15 Black and 17 White patients were obtained from the biorepository of Northwestern University and the University of North Carolina. All patients provided written informed consent to tissue banking and use of tissue for research. All studies involving human participants or samples were conducted in accordance with relevant ethical regulations, including the Declaration of Helsinki, and were approved by the appropriate institutional review board (IRB) (STU00212683).
Cell culture
OVCAR5 cells were a gift from Dr. Marcus Peter, Northwestern University; OVCAR4 cells were from Dr. Mazhar Adli, Northwestern University; immortalized human fallopian tube luminal epithelial cells (FT190) were from Dr. R. Drapkin of University of Pennsylvania; OV90 cells were purchased from the American Type Culture Collection (ATCC). Cells were maintained in a 37 °C incubator with 5% CO2. Low passage cells were used, and all cell lines were authenticated (IDEXX BioAnalytics) and tested to be pathogen and Mycoplasma negative (Charles River Research Animal Diagnostic Services). OVCAR5 cells were maintained in RPMI-1640 with L-glutamine (Corning, Cat# 10-040-CV) plus 10% FBS, 1% GlutaMAX (Gibco, Cat# 35-050-061), and 1% penicillin-streptomycin. OV90 cells were cultured in a medium comprising a 1:1 mixture of MCDB 105 (Sigma Aldrich, Cat# M6395) and Medium 199 (Corning, Cat# 10-060-CV), supplemented with 15% FBS. All cell culture media were supplemented with 10% FBS (Fisher Scientific, Cat# 35011CV) and 1% penicillin-streptomycin solution (Corning, Cat# 30-002-CI).
Chemicals and reagents
INSR inhibitor HNMPA-(AM)3 (CAS 120944-03-8) (cat. no. sc-221730) was purchased from Santa Cruz. Insulin (cat. no. I0516), Cisplatin (CAS 15663-27-1) (cat.no. 232120), and dimethyl sulphoxide (DMSO, cat. no. D2650) were from Sigma-Aldrich.
gDNA and RNA extraction
Genomic DNA (gDNA) was extracted from human tumor tissues using the DNeasy Blood & Tissue Kit (Qiagen, Valencia, CA, Cat. # 69504). Total RNA was extracted using a RNeasy Mini kit with on-column DNA digestion (Qiagen, Cat. # 74104). The concentrations of gDNA and RNA were measured with the NanoDrop™ 2000 and Qubit spectrophotometry. Purity was estimated by calculating the absorbance ratio at 260/280 nm. DNA and RNA were used for RNA sequencing and methylation profiling, respectively.
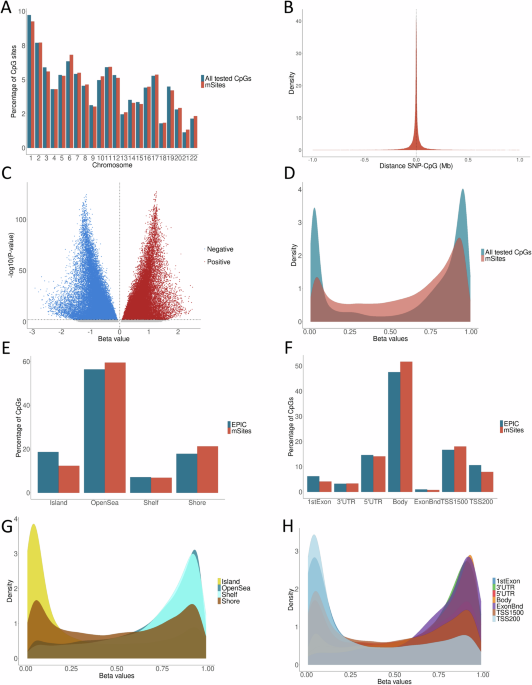
Infinium Methyation EPIC array data processing
gDNA (500 ng) was bisulfite converted and used for DNA methylation profiling at the NUSeq Core Facility, Northwestern University, using Epic methylation arrays according to the Illumina’s protocol. BeadChips were scanned with an Illumina iScan and then analyzed using the Illumina GenomeStudio software. Methylation array data were collected in idat format. Nine multi-aliquot samples existed, for which the mean beta values were used to represent each sample. After aliquot averaging, 35 black patient samples and 31 white patient samples remained for analysis. R package SeSAMe52 was used to process IDAT files that were generated from EPIC array and downstream differential methylation locus (DML) and region (DMR) analysis. “openSesame” from SeSAMe was used to process IDATs to DNA methylation level (aka β value) matrices in R. In DML, SeSAMe utilizes linear models to identify DMLs between two cohort groups, white and black, from DNA methylation values. In DMR, neighboring CpGs that show consistent methylation variation were merged into differentially methylated regions (DMRs), and adjusted pvalue was calculated using Benjamini-Hochberg procedure.
RNA-sequencing (RNA-seq) and data processing
RNA-seq data was collected as fastq read files and aligned using STAR. Expected read counts were estimated using RSEM and filtered for low expression. Three patient samples were removed during outlier detection, after inspection by principal component analysis. After quality control, 35 Black patient samples and 28 White patient samples remained for downstream analysis. RSEM expected counts were rounded to the nearest integer and used for downstream differential analysis. Normalization of expected counts was performed using DESeq2. After filtering, all downstream analysis was performed on 22,511 gene-features across n = 63 total samples.
Survival analysis
Clinical information (survival) for ovarian cancer patients was downloaded from the cbioportal website (https://www.cbioportal.org/) for HGSOC12, Ovarian Serous Cystadenocarcinoma (TCGA, Firehose Legacy) and Ovarian Serous Cystadenocarcinoma (TCGA PanCancer Atlas)13. Duplicated patient IDs were removed, resulting in a total of 1230 patients. Among those patients, 531 patients were self-identified as White and 37 as Black based on “Race Category” and were included in this analysis. Survival analysis was performed by using the Kaplan-Meier plot method for Black and White patients.
Quantitative real-time RT-PCR (qRT-PCR) analysis
QRT-PCR was used for validation. Total RNA (1 μg) was reverse transcribed into cDNA by using the Applied Biosystems™ High-Capacity cDNA Reverse Transcription Kit (Applied Biosystems) according to the manufacturer’s instructions. Quantitative real-time PCR analysis was performed by using Applied Biosystems™ Power SYBR™ Green PCR Master Mix (Applied Biosystems) and an AB 7900HT instrument (Applied Biosystems, Foster City, CA). 18S RNA was used as endogenous control. Sequences of primers for FOXA1, FOXAB1, EEF1A2, LDLR, SCD1, INSR, NXF3, CPNE4, WNT16 are included in Supplementary Table 7. The RT-PCR reaction used the following parameters: 94 °C for 10 min, followed by 40 cycles of amplification at 94 °C for 15 s and 60 °C for 1 min, and an extension step of 7 min at 72 °C. The relative expression of target genes was calculated by using the ΔΔCt method. Results are presented as means ±SD of replicates. Measurements were performed in triplicate for each sample.
Western blotting (WB)
Cells were lysed using the radio immunoprecipitation assay (RIPA) buffer. After sonication and centrifugation, protein concentrations were quantified by using the Bradford assay (Bio-Rad Protein Assay Reagent, Bio-Rad, Berkeley, CA). Equal amounts of protein were resolved by SDS-PAGE and transferred to PVDF membranes. After blocking in 5% non-fat milk, the membranes were incubated with primary antibody overnight at 4°C and then with secondary antibody. Detection used the SuperSignal West Pico PLUS Chemiluminescent Substrate (Thermo Scientific). Anti-INSR and anti-FOXA1 antibodies were purchased from Abcam (Cambridge, Massachusetts; Cat # ab137747 and ab170933, respectively).
Immunohistochemistry (IHC)
IHC was performed in the Lurie Cancer Center Pathology Core. The TMA and other paraffin embedded tumor slides were deparaffinized using xylene. Sections were rehydrated with decreasing ethanol concentration and incubated in epitope unmasking buffer (10 mM sodium citrate buffer; pH = 6) at 95 °C for 30 min. The sections were then blocked using 3% hydrogen peroxide for 15 min, followed by 3% normal goat serum (NGS), for 30 min. The sections were incubated with 1:250 anti-INSR antibody (ab137747; Abcam) and anti-FOXA1 [EPR10881] antibody (ab170933; Abcam) in 3% NGS overnight at 4 °C, after several dilutions had been tested. Negative control using serum only was used. The sections were then processed using LSAB2 Kits, Universal, HRP. Rabbit/Mouse kit (K0675; Agilent Technologies, Santa Clara, CA), followed by DAB + , liquid chromogen (K3467; Agilent Technologies, Santa Clara, CA), according to the manufacturer’s instructions. The sections were counterstained using hematoxylin (CS700; Agilent Technologies, Santa Clara, CA) and fixed using Faramount aqueous mounting medium (S302580-2; Agilent Technologies, Santa Clara, CA). A board-certified pathologist interpreted and scored the slides, blinded to the identity and race of patients. An H-Score was calculated based on the intensity (0-3 + ) and percentage of cancer cells staining (0-100%), using the formula: intensity x percentage/100.
Gene Set Enrichment Analysis
Gene Set Enrichment Analysis (GSEA) used RNA-seq counts from 35 black patients and 28 white patients (63 patients in total) collected and processed as described previously53. Hallmark and C2 curated gene sets were selected for the analysis.
Pathway enrichment analysis
Pathway enrichment analysis was performed by using Enrichr (https://maayanlab.cloud/enrichr/) In addition, functional analysis of genes was performed with Enrichr Knowledge Graph (Enrichr-KG), which combines enrichment analysis with a knowledge graph data representation to query a large collection of processed datasets comprising associations between genes and many biological and biomedical terms. This tool includes 26 gene set libraries from various categories, such as transcription, pathways, ontologies, diseases/drugs, and cell types. The study utilized three foundational pathway sets: Wiki 2021 Human, KEGG 2021 Human, and Go Biological Process 2021 Human, to analyze predicted top differential potential target genes. This approach facilitates the discovery of gene-gene links and reveals hidden relationships between genes and enriched terms from diverse datasets and resources. Enrichr-KG is an openly accessible tool, available at the provided URL (https://maayanlab.cloud/enrichr-kg)54.
Gene knockdown
The INSR gene was knocked down in OV90 cells by transduction with lentiviral particles containing shRNAs (shINSR-1 or shINSR-2) targeting human INSR (MilliporeSigma, Cat#: CSTVRS). OV90 cells transduced with a scrambled shRNAs (shNC) (MilliporeSigma, Cat#: SHC003V) served as controls (shNC). Transfected cells were selected with puromycin. A similar procedure was used to knock down FOXA1 in OVCAR5 cells, which were transduced with lentiviral particles containing shRNAs targeting human FOXA1 including 2 sequences (shINSR-1 and shINSR-2) which were purchased from Origene Technologies (Rockville, MD, Cat#: TL312942V).
Cell viability assay
Cells were treated with various concentrations of cisplatin for 24 h. Afterward, the medium was refreshed, and culture continued for 72 h. Cell viability was assessed using a Cell Counting Kit 8 (CCK8, Dojindo Molecular Technologies, Cat# CK04, Rockville, MD, USA), following the manufacturer’s protocol. Absorbances at 450 nm were recorded using a microplate reader (BioTek ELX800, BioTeK, Winooski, VT). The IC50 values were determined from these readings by using Prism (GraphPad software).
Colony formation assay
Two hundred cells per well were seeded in triplicate per each experimental condition in 6-well-plates. The media was changed every three days. After 2 weeks of growth, cultures were washed with PBS, fixed with 70% ice-cold ethanol, and stained with 1% crystal violet. Colonies were counted in each well and average numbers per condition were compared.
Cell proliferation assay
Cells were seeded in 96-well plates. Cell numbers were estimated by using a Cell Counting Kit 8 (CCK8, Dojindo Molecular Technologies, Cat# CK04, Rockville, MD, USA) at different time points, following the manufacturer’s protocol. Absorbances at 450 nm were recorded using a microplate reader (BioTek ELX800, BioTeK, Winooski, VT).
Analysis of immune cell types
To examine differences in immune cell types between the Black and White patient groups deconvolution analysis was performed using the xCell algorithm26. xCell is a gene signatures-based deconvolution method that performs cell-type enrichment analysis across a profile of 64 immune and stromal gene signatures; the output is a cell-type scoring which represents fractional abundance. We applied xCell on all gene expression data and conducted a Wilcoxon rank sum test to assess statistical significance. A p-value of 0.05 was used as the threshold for significance.
Multiplex immunohistochemistry (mIHC)
Formalin-fixed and paraffin-embedded (FFPE) HGSOC slides from 15 Black and 17 White patients were analyzed using the Opal 7-Color Multiplex IHC kit (AKOYA Biosciences) described previously55. Briefly, antigen retrieval was performed in AR9 retrieval buffer (AKOYA Biosciences) on deparaffinized and re-hydrated slides, followed by six cycles of staining procedures including blocking, binding of primary antibodies, second HRP-linked antibodies and visualized with the corresponding Opal fluorophores. Each staining cycle was finished up with heating in AR6 retrieval buffer (AKOYA Biosciences) to release the bounded primary and second antibodies but did not disturb the resident fluorophores. After six-round staining procedures, the slides were counterstained with DAPI. The single marker staining with individual opal fluorophore was employed as the reference for the “spectral unmixing process”. The antibodies and corresponding fluorophores are listed in Supplementary Table 8.
Acquirement of multispectral images (MSI) and data analysis of mIHC
The Opal fluorophore signals on the stained slides were captured with the Vectra 3 Automated Quantitative Pathology Imaging System (Perkin Elmer) at 200x magnification. Spectral unmixing into four individual fluorophores based on the unique emitting spectrum of each single fluorophore used InForm Advanced Image Analysis software (Akoya Biosciences). Subsequently, the spectral unmixed images underwent cell segmentation based on DAPI, and cell phenotyping based on specific cellular markers through the trained algorithm of Inform. The exported data containing composite images, cell segmentation, and cell phenotyping from InForm were used to quantify cell densities and protein intensities using R-based phenoptrReports & phenoptr (AKOYA biosciences).
Statistical analysis
Data were analyzed using Student t-test, ANOVA, or Wilcoxon rank sum test. Data are presented as means ± standard deviation (SD), and P < 0.05 was considered significant.

Comments (0)