
Remember me
A total of 232 probands originating from unrelated families were included, with no significant difference in the sex distribution observed (Table 1). The median age of symptom onset was 30.5 years. They were stratified into two groups based on their clinical profiles: 128 (55.2%) were placed in the “probable genetic origin” group, whereas 104 (44.8%) were categorized into the “uncertain origin” group (Fig. 1). Among the 128 individuals in the probable genetic group, 56 (43.8%) had a family history. Notably, the majority of those without a family history (53/72, 73.6%) presented with neurological disorders, often with atypical early-onset symptoms, which likely raised clinical suspicion of a genetic etiology despite the absence of a known family history. Overall, 170 individuals (73.3%) primarily exhibited neurological disorders, while 62 individuals (26.7%) presented with non-neurological conditions. Within the neurological disorder group, cerebellar ataxia (25.4%) was the most frequently observed phenotype, followed by spastic paraplegia (14.7%) and leukodystrophy (8.6%). In the non-neurological disorders group, musculoskeletal disorders (9.9%) were the most common, followed by cardiovascular diseases (3.4%). Diagnostic genetic testing was extensively utilized, with 226 individuals (97.4%) undergoing ES or GS. A minority of the cohort received either a single gene or targeted panel sequencing (three individuals) or antibody screening (three individuals). The most common sequencing approach was proband-only sequencing, which was used for 172 probands (74.1%) due to the difficulties of obtaining parental samples. However, to enhance the accuracy of variant interpretation, sequencing of additional family members was conducted if possible. As a result, 330 samples from 232 probands and their 98 family members underwent ES or GS, enabling trio sequencing for 34 families (14.7%), duo sequencing for 12 families (5.2%), and quartet sequencing for 8 families (3.4%).
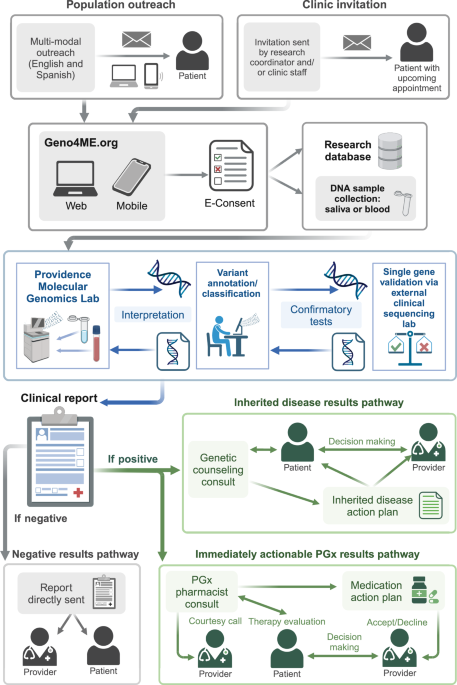
Table 1 Clinical characteristics of adults with undiagnosed rare diseasesFig. 1: Overview of the diagnostic and clinical management workflow for adults with undiagnosed rare disease.
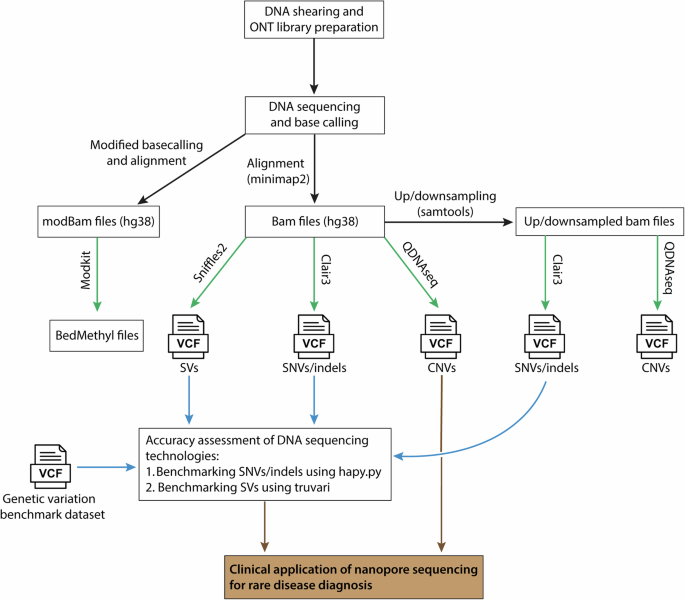
In this cohort, 232 adults with undiagnosed rare diseases were enrolled. The genetic cause was primarily evaluated using exome or GS (n = 226), although six underwent only single gene/panel sequencing or antibody screening. The bioinformatics pipeline included tools for copy-number variation (CNV) and short tandem repeat (STR) analyses to increase the diagnostic yield. For individuals with negative sequencing results but suspected STR disorders, we further employed repeat-primed PCR and/or nanopore long-read sequencing to identify potential cases of spinocerebellar ataxia or leukodystrophy. This methodology successfully resolved the diagnoses of 78 individuals, including 66 with genetic and 12 with non-genetic causes. For genetically confirmed cases, subsequent clinical management strategies such as surveillance, cascade screening, drug repurposing, genetic counseling for family planning, and subsequent preimplantation genetic testing (PGT) were conducted.
Non-genetic conditions requiring differential diagnosis with genetic originsAmong 104 individuals in the uncertain-origin group, 12 (11.5%) were ultimately identified as having a non-genetic etiology after receiving appropriate imaging, laboratory studies, immunologic tests, and infection workups as well as genetic testing. Specifically, three individuals with acute muscle weakness and elevated creatine kinase levels were positive for anti-signal recognition particle (SRP) antibodies. ES did not reveal causative variants in them. Their symptoms significantly improved after immunotherapy, which included steroids, intravenous immunoglobulin (IVIG), and rituximab. Another individual exhibited autoantibody against the leucine-rich glioma-inactivated 1 (LGI1) protein, indicating anti-LGI1 encephalitis. Additionally, three other subjects were diagnosed with seronegative autoimmune encephalitis manifesting as acute cognitive decline. Their conditions were characterized by fever, rapid cognitive and motor function decline, and a positive response to immunotherapy, including steroids, IVIG, rituximab, and/or tocilizumab, following the exclusion of infectious and genetic etiologies. Overall, seven individuals had immunological causes.
Another individual presented with subacute dizziness and general weakness and was ultimately diagnosed with fungal meningitis due to Trichosporon asahii23. This diagnosis was reached after magnetic resonance imaging and cerebrospinal fluid analysis suggested the presence of an atypical pontine infarction and meningitis, with genetic disorders ruled out through ES. Two other individuals with non-genetic causes were concluded to have a rare case of post-pump chorea and a functional movement disorder. Two individuals were diagnosed with Gorham–Stout disease and Parry–Romberg syndrome. Collectively, these cases highlight the intricate challenge of distinguishing non-genetic from genetic causes in undiagnosed adults and underscore the critical role of comprehensive clinical evaluation in identifying non-genetic etiologies that closely overlap with genetic disorders.
Diagnostic rate and strategies to maximize the yield of genetic approachTo enhance the diagnostic rate of genetic tests, we adopted a dynamic approach to data analysis, as illustrated in Fig. 1. We ensured that the databases were routinely updated and that reanalyzes were conducted every six months to incorporate emerging genetic discoveries. This approach led to the identification of causative single nucleotide variants (SNVs) or small indels in 47 individuals (Supplementary Data 2). Notably, 12 (25.6%) received their final diagnosis during the reanalysis phases due to variant reclassification. In addition, we employed multiple bioinformatics tools to detect disease-associated copy-number variations (CNVs) in exome and genome data. CNV detection tools identified disease-associated CNVs in 5 individuals (see Supplementary Table 1 for details). Notably, a deletion affecting the upper regulatory region of the LMNB1 gene was identified (AUDP040) using CONIFER and validated through GS (Fig. 2a). Intriguingly, this was the smallest deletion reported thus far affecting key regulatory domains, and this individual exhibited pronounced leukodystrophy on brain images (Fig. 2b, c)24,25,26. Additionally, a 1.4 Mb duplication encompassing the PMP22 gene, which is crucial for diagnosing type 1 A Charcot-Marie-Tooth disease, was detected (AUDP109) by CONIFER and confirmed through chromosomal microarray (Fig. 2d). Furthermore, a homozygous deletion spanning exons 1 to 4 of the DRC1 gene was identified (AUDP044) with primary ciliary dyskinesia using HMZDelFinder (Fig. 2e)27. Similarly, a 58.0-kb heterozygous deletion involving the entire SERPINC1 gene was identified (AUDP086) with antithrombin deficiency. In another case, a large inversion including the PAX6 gene was identified using GS in an individual with congenital aniridia (AUDP139).
Fig. 2: Enhanced detection of clinically significant copy-number variations utilizing bioinformatic tool.
a Discovery of a heterozygous deletion associated with adult-onset leukodystrophy in AUDP040. CONIFER, an exome-based CNV analysis tool, identified a deletion impacting the upstream regulatory elements of LMNB1. The deletion measures 199 kb (chr5:126,518,919-126,717,453) and its extent and breakpoints were confirmed by high-depth GS (30x coverage). b A comparative diagram of various heterozygous deletions identified within the enhancer regions of LMNB1 from different studies alongside the current case (AUDP040). The depicted critical region is the smallest deletion associated with LMNB1-related leukodystrophy identified thus far, which includes the gene’s upper regulatory domain. TAD: topologically associating domain, TDB: TAD boundary. c Magnetic resonance imaging scans of the brain revealing manifestations of adult-onset leukodystrophy in AUDP040. T2-weighted images show increased signal intensity in the cerebral and cerebellar white matter consistent with leukodystrophic alterations. d Detection of a heterozygous duplication linked to Charcot-Marie-Tooth disease in AUDP109. The duplication, which spans 1.4 Mb and includes the PMP22 gene, was initially detected by CONIFER and later confirmed with chromosomal microarray. e Detection of a homozygous deletion in the DRC1 gene in AUDP044, which led to a diagnosis of primary ciliary dyskinesia. The HMZDelFinder pinpointed the deletion, which encompasses exons 1-4 of DRC1 and spans 27.7 kb. This deletion is recognized as a founder mutation within the East Asian population, and its existence was confirmed through breakpoint PCR analysis.
When autosomal recessive disorders were strongly suspected but only one pathogenic allele was detected, multiplex ligation-dependent probe amplification (MLPA) was employed, as the MPLA proved invaluable for detecting small deletions that have been missed by ES (Supplementary Table 1). This allowed us to detect two small deletions involving SETX exon 26 and PANK2 exon 2. Notably, heterozygous and homozygous alleles of SETX exon 26 deletions were identified in two unrelated individuals (AUDP048 and SUDP059); one (AUDP048) with a heterozygous SETX deletion also possessed a splicing variant (NM_015046.7:c.6106+1 G > A) in the opposite allele, indicating compound heterozygosity28. The detection of the homozygous allele of SETX exon 26 deletion strongly suggested that the SETX exon 26 deletion may be a founder variant in the Korean or East Asian population and could be a frequent cause of ataxia with oculomotor apraxia type 2 (AOA2) in Korea. Similarly, one (SUDP059) with a PANK2 exon 2 deletion had an LP variant (NM_001386393.1:c.803 A > G; p.Asp268Gly) in the opposite allele. Collectively, the above findings highlight the importance of incorporating CNV analysis to optimize diagnostic outcomes.
Considering the high proportions of neurological disorders in our cohort, we extended our evaluation to include short tandem repeat (STR) disorders, which are often missed by standard molecular tests. For this, we screened known STR disorders utilizing exomes (ExpansionHunter)29 and/or conducted RP-PCR or Cas9-mediated nanopore long-read sequencing (LRS), particularly in cases where initial sequencing did not provide definitive results. This extended assessment primarily focused on suspected subgroups with symptoms of cerebellar ataxia or leukodystrophy. As a result, we identified 14 individuals with STR disorders (Supplementary Table 2) within diverse genes30,31, including NOP56 (n = 5), NOTCH2NLC (n = 4), ATXN3 (n = 2), ATXN7 (n = 1), ATXN8 (n = 1), and ATN1 (n = 1).
Impact of clinical factors on the diagnostic rateOverall, the disease etiology was identified in 78 probands (33.6%), including genetic origin in 66 (28.4%) and non-genetic origin in 12 (5.2%). All with non-genetic etiologies were found in the uncertain group and included three cases of inflammatory myopathy with anti-SRP antibodies, three of seronegative autoimmune encephalitis, and one each of anti-LGI1 encephalitis, fungal meningitis, post-pump chorea, functional movement disorder, Gorham–Stout disease, and Parry–Romberg syndrome. These conditions highlight the intricate challenge of distinguishing non-genetic from genetic causes in adults with undiagnosed diseases and underscore the critical role of comprehensive clinical evaluation in distinguishing non-genetic etiologies that closely overlap with genetic disorders.
Genetic causes were identified in 66 probands: 51 from the probable genetic origin group and 15 from the uncertain group. In the 15 diagnosed individuals from the uncertain group, differentiating the genetic causes based on initial clinical presentations was particularly challenging, as all were sporadic, with the majority affected by leukodystrophy (n = 6). The final diagnosis was established after identifying causative genetic variants, considering inheritance patterns, conducting familial studies, and thoroughly correlating genotypes with phenotype. Specifically, disease-associated SNVs, CNVs, and STRs (Supplementary Tables 2–4) were identified in 47, 8, and 14 individuals, respectively. These results highlighted the importance of considering diverse genetic variations for diagnostic success.
In sub-group analyses, the diagnostic yield was significantly greater in the probable genetic origin group (39.8%) than in the uncertain origin group (14.4%, P < 0.0001; Fig. 3a). Furthermore, the diagnostic rate was influenced by the presence of family history and age at symptom onset. Specifically, individuals with a family history had a greater diagnostic rate of 42.9% than 23.8% for those without such a history (P = 0.010; Fig. 3b). Despite not reaching statistical significance in our cohort, the age of symptom onset showed a negative relationship with the diagnostic rate (Fig. 3c). Furthermore, our analysis of the relationships between phenotypic categories and diagnostic success revealed no significant correlation across our cohort. However, the diagnostic rate for neurological phenotypes (30.6%) was marginally greater than that for non-neurological phenotypes (22.6%; Fig. 3d). Notably, within the neurological category, individuals who presented with leukodystrophy achieved the highest molecular diagnostic rate at 40.0% (Fig. 3e). This highest yield might be partially attributed to the cases diagnosed by CNV and STR analyses. In contrast, diagnostic rates among non-neurological disorders exhibited a wide variation ranging from 11.1% to 50.0% (Fig. 3f).
Fig. 3: Diagnostic rates according to clinical factors and phenotype categories.
a Genetic origin. Individuals classified into the probable genetic group had a higher rate of molecular diagnosis than those within the uncertain group (P < .0001). b Family history. Individuals with a family history appeared to have a significantly greater chance of having a positive molecular diagnosis than those without a family history (P = 0.010). c Onset age. The individuals were categorized into three groups based on their age of onset. Although individuals with an onset age younger than 18 years exhibited a greater diagnostic yield than individuals in the other age groups, the difference was not statistically significant. d Comparison of diagnostic yields between neurological and non-neurological disorders. No significant difference in the diagnostic rate according to the primary phenotype category was found. e Diagnostic yields in secondary phenotype categories of neurological disorders. f Diagnostic yields in secondary phenotype categories of non-neurological disorders. The bar graphs display the diagnostic yields for the corresponding phenotype categories highlighted in blue.
The time interval from symptom onsetNext, we analyzed the time interval between the onset of initial symptoms and the achievement of a definitive diagnosis or the last follow-up. Among the 66 individuals who received a genetic diagnosis, the median diagnostic interval was 8.9 years (95% CI: 6.5–12.4 years). In contrast, the undiagnosed individuals had a shorter median follow-up duration of 7.1 years (95% CI: 6.0–8.0 years). However, the difference in intervals between the diagnosed and undiagnosed groups was not statistically significant (Fig. 4a). Additionally, individuals in the probable genetic origin group experienced a longer diagnostic journey compared to those in the uncertain origin group, regardless of whether they received a diagnosis (Fig. 4b). The length of the diagnostic journey did not differ significantly based on the presence or absence of a family history (Fig. 4c). Notably, the higher diagnostic rate observed in individuals with a family history (Fig. 3b) was primarily distinguished during the earlier phase, specifically within the first 10 years of symptom onset (Fig. 4d). This highlights that individuals with a family history are more likely to benefit from early access to genetic testing compared to those without.
Fig. 4: Impact of clinical factors on the diagnostic journey in adults with rare diseases.
a Genetic diagnosis and diagnostic journey intervals. No significant difference in the duration of the diagnostic journey was noted between the genetically diagnosed (pink) and undiagnosed (blue) groups, with median durations of 8.9 years and 7.1 years, respectively. b Longer diagnostic journeys were observed in the group with probable genetic origins. Individuals with a probable genetic origin (pink) had a longer median diagnostic journey of 10.0 years than those with an uncertain genetic or non-genetic origin (blue), who had a median of 5.1 years (P = 0.008), indicating that earlier diagnostic efforts in the former group may have potentially shortened the diagnostic journey. c Family history and diagnostic journey. The length of the diagnostic journey did not significantly differ between individuals with (pink) and without (blue) a family history of disease. d A higher cumulative diagnostic rate was observed in individuals with a family history (pink), with the majority of diagnoses occurring within the first 10 years. This indicates the critical importance of early genetic testing, particularly for individuals with a family history. The bidirectional arrow highlights the difference in cumulative diagnostic rates at the 10-year mark. e Diagnostic journey by onset age. Adults with pediatric-onset disease (pink) experienced a significantly longer diagnostic interval than those with adult-onset disease as expected. f Cumulative diagnostic rate by age of onset. Adults with pediatric-onset disease (pink) initially had a similar or lower cumulative diagnostic rate than those with adult-onset disease (blue). However, this trend reversed around the 30-year mark, as indicated by the arrow, indicating the potential impact of limited access to advanced molecular technologies earlier in life. This underscores the need for intensified diagnostic efforts for adults with pediatric-onset diseases. **P < 0.01, ***P < 0.001, ****P < 0.0001, ns not significant (P > 0.05).
Additionally, individuals who experienced symptom onset during childhood endured significantly longer diagnostic journeys compared to those whose symptoms began in adulthood, as expected (Fig. 4e). Among the 17 individuals whose symptoms began in childhood and were diagnosed through the adult UDP, we observed that many cases were particularly challenging to diagnose. These included cases requiring the identification of CNVs (n = 3) or two trans alleles for autosomal recessive disorders (n = 6). These complexities may have hindered molecular diagnosis and further prolonged the diagnostic journey. Furthermore, we found that adults with pediatric-onset symptoms initially had a similar or even lower diagnostic rate compared to those whose symptoms began in adulthood. However, this trend reversed in the later phases of the diagnostic journey, particularly around the 30-year mark (Fig. 4f). This suggests that adults might have not fully benefited from recent advancements in molecular technologies during the early stages of their lives, underscoring the critical need for enhanced diagnostic efforts for undiagnosed adults who initially presented with symptoms during childhood.
Personalized management after diagnosisAfter receiving molecular diagnoses, 66 individuals were closely monitored for an average duration of 17.2 months, ranging from 0 to 42 months. Each individual, along with their family members, was provided with detailed information about their diseases and related genes supplemented by tailored genetic counseling. For 21 individuals (31.3%), previously unrecognized surveillance measures specific to their genetic conditions were initiated, demonstrating the value of precise genetic diagnosis in enhancing patient care. Additionally, cascade screening was conducted within 10 families (14.9%), resulting in the identification of 12 affected family members and 2 female carriers of X-linked conditions (Supplementary Table 3). Moreover, 10 individuals were identified as suitable candidates for drug repurposing based on their confirmed genetic diagnosis within 9 genes (Table 2). After excluding one who declined treatment, nine consented to receive new treatment options with repurposed drugs. Of these, five individuals experienced benefits from drug repurposing, whereas four did not exhibit definitive responses. Moreover, reproductive counseling was provided to two individuals having autosomal dominant disorders: CACNA1G-related spinocerebellar ataxia and PAX6-related aniridia. They opted for preimplantation genetic testing (PGT) for monogenic/single gene defects (PGT-M) and PGT for structural rearrangements (PGT-SR), which were conducted as preventive measures to ensure the health of their offspring.
Table 2 Cases with drug repurposing following molecular diagnosisFor non-genetic causes, personalized treatments were also provided. Three individuals diagnosed with anti-SRP immune-mediated necrotizing myopathy received a treatment regimen of methylprednisolone, IVIG, and rituximab, resulting in significant improvements in muscle weakness and reduced creatine kinase levels following immunotherapy. Similarly, in three individuals diagnosed with autoimmune encephalitis, symptoms such as cognitive decline improved after immunotherapy with rituximab, tocilizumab, and/or IVIG. These outcomes underscore the clinical significance of identifying non-genetic causes in undiagnosed rare diseases, not only for achieving accurate diagnoses but also for tailoring individualized treatment plans.
Comments (0)